
Remember me

E. coli strains were grown in lysogeny broth (LB) medium. When appropriate, the media was supplemented with antibiotics at the following concentrations (liquid/solid (μg ml−1)): carbenicillin (50/100), chloramphenicol (20/30), kanamycin (30/50), streptomycin (50/50) and tetracycline (12.5/12.5).
Plasmid and strain constructionPlasmids and strains used or generated in this study are listed in Supplementary Tables 1 and 2, respectively.
For plasmid construction, a double-stranded DNA fragment containing a desired sequence was chemically synthesized (gBlocks, IDT). The target plasmid was double-digested with restriction enzymes and gel-purified. A 10 μl reaction mixture was created with 5 μl 2× Gibson master mix (NEB) and 5 μl of combined equimolar concentration of purified backbone and gBlock(s). This mixture was incubated at 50°C for 60 min. Gibson assembly was possible owing to shared sequence similarity between the digested backbone and the gBlock fragment(s). All resulting plasmids were verified by Sanger sequencing (Genewiz) or whole-plasmid sequencing (Plasmidsaurus).
Construction of pET21b::korB–(his)6 (WT and mutants)DNA fragments containing mutated korB genes (korB*) were chemically synthesized (gBlocks, IDT). The NdeI-HindIII-cut pET21b plasmid backbone and korB* gBlocks fragments were assembled using a 2× Gibson master mix (NEB). Gibson assembly was possible owing to a 37 bp sequence shared between the NdeI-HindIII-cut pET21b backbone and the gBlocks fragment.
Construction of pET21b::korA–(his)6 (WT and mutants)DNA fragments containing mutated korA genes (korA*) were chemically synthesized (gBlocks, IDT). The NdeI-HindIII-cut pET21b plasmid backbone and korA* gBlocks fragments were assembled using a 2× Gibson master mix (NEB). Gibson assembly was possible owing to a 37 bp sequence shared between the NdeI-HindIII-cut pET21b backbone and the gBlocks fragment.
Construction of pBAD33::korB (WT and mutants)DNA fragments containing mutated korB genes (korB*) were chemically synthesized (gBlocks, IDT). The SacI-HindIII-cut pBAD33 plasmid backbone and korB* gBlocks fragments were assembled using a 2× Gibson master mix (NEB). Gibson assembly was possible owing to a 38 bp sequence shared between the SacI-HindIII-cut pBAD33 backbone and the gBlocks fragment.
Construction of pDM1.2::korA (WT and mutants)DNA fragments containing mutated korA genes (korA*) were chemically synthesized (gBlocks, IDT). The EcoRI-SalI-cut pDM2.1 plasmid backbone and korA* gBlocks fragments were assembled using a 2× Gibson master mix (NEB). Gibson assembly was possible owing to a 38 bp sequence shared between the EcoRI-SalI-cut pDM2.1 backbone and the gBlocks fragment.
Construction of pSC101::PkorA (WT and mutants)DNA fragments containing mutated PkorA promoters (PkorA*) were chemically synthesized (gBlocks, IDT). The BamHI-cut pSC101 plasmid backbone and PkorA* gBlocks fragments were assembled using a 2× Gibson master mix (NEB). Gibson assembly was possible owing to a 38 bp sequence shared between the BamHI-cut pSC101 backbone and the gBlocks fragment.
Construction of pUC19::146-bp-PkorAA 146 bp DNA fragment containing PkorA was chemically synthesized (gBlocks, IDT) and subsequently 5′-phosphorylated using T4 PNK (NEB). Phosphorylated 146 bp PkorA DNA was blunt-end ligated with a dephosphorylated SmaI-cut pUC19 using T4 DNA ligase (NEB).
Construction of pUC19::146-bp-PkorA:λPRTo clone the 146 bp PkorA:λPR discriminator DNA into pUC19, pUC19::146bp-PkorA was used as a template for site-directed mutagenesis with Q5 DNA Polymerase (NEB) using the primers 5′-AACATTTCTCGCACG-3′ and 5′-TAGCTAAACTGGTTGCATGTGCTGGCG-3′ at an annealing temperature of 57 °C. The resulting PCR product was introduced into E. coli DH5α, and carbenicillin-resistant colonies were isolated. Subsequently, plasmids were isolated and verified by whole-plasmid sequencing (Plasmidsaurus).
Construction of E. coli DH5α and BL21 pLysS strains containing the desired combinations of plasmidsPlasmids were introduced/co-introduced into E. coli DH5α or E. coli BL21 pLysS via heat shock transformation (42 °C, 30 s) in the required combinations (Supplementary Table 2).
Protein overexpression and purificationProteins used or generated in this study are listed in Supplementary Table 3.
KorA and KorB (WT and mutants)Protein preparation for crystallization, ITC and biochemical experiments, excluding BMOE crosslinking, was performed as follows. C-terminally His-tagged KorA and KorB (WT and mutants) were expressed from the plasmid pET21b in E. coli Rosetta (BL21 DE3) pLysS competent cells (Merck). Overnight culture (120 ml) was used to inoculate 6 l of LB with selective antibiotics. Cultures were incubated at 37 °C with shaking at 220 r.p.m. until OD600 of ~0.6. Cultures were cooled for 2 h at 4 °C before isopropyl-β-d-1-thiogalactopyranoside (IPTG) was added to a final concentration of 0.5 mM. The cultures were incubated overnight at 16 °C with shaking at 220 r.p.m. before cells were pelleted by centrifugation. Cell pellets were resuspended in buffer A (100 mM Tris–HCl, 300 mM NaCl, 10 mM imidazole, 5% (v/v) glycerol, pH 8.0) with 5 mg lysozyme (Merck) and a cOmplete EDTA-free protease inhibitor cocktail tablet (Merck) at room temperature for 30 min with gentle rotation. Cells were lysed on ice with 10 cycles of sonication: 15 s on/15 s off at an amplitude of 20 µm and pelleted at 32,000 g for 35 min at 4 °C, and the supernatant filtered through a 0.22 µm sterile filter (Sartorius). Clarified lysate was loaded onto a 1 ml HisTrap HP column (Cytiva) pre-equilibrated with buffer A. Protein was eluted from the column using an increasing gradient of imidazole (10–500 mM) in the same buffer. Desired protein fractions were pooled and diluted in buffer B (100 mM Tris–HCl, 20 mM NaCl, 5% v/v glycerol, pH 8.0) until the final concentration of NaCl was 60 mM. Pooled fractions were loaded onto a 1 ml Heparin HP column (Cytiva) pre-equilibrated with buffer B. Protein was eluted from the column using an increasing gradient of NaCl (20–1,000 mM) in the same buffer. Desired protein fractions were pooled and loaded onto a preparative-grade HiLoad 16/600 Superdex 75 pg gel filtration column (GE Healthcare) pre-equilibrated with elution buffer (10 mM Tris–HCl, 150 mM NaCl, pH 8.0). Desired fractions were identified and analysed for purity via sodium dodecyl sulfate–polyacrylamide gel electrophoresis (SDS–PAGE) before being pooled. Aliquots were flash frozen in liquid nitrogen and stored at −80 °C. For protein samples to be used for protein–nucleotide binding ITC experiments, Mg2+ was introduced via an overnight dialysis step at 4 °C in buffer containing 10 mM Tris–HCl, 150 mM NaCl and 5 mM MgCl2, pH 8.0 before concentration and quantification as described above.
Protein preparations for BMOE crosslinking were purified using a one-step Ni-affinity column with all buffers adjusted to pH 7.4 for optimal crosslinking. Purified proteins were subsequently desalted using a PD-10 column (Merck) before being concentrated using an Amicon Ultra-4 10 kDa cut-off spin column (Merck). Final protein samples were aliquoted and stored at −80 °C in storage buffer (100 mM Tris–HCl, 300 mM NaCl, 5% v/v glycerol, 1 mM Tris(2-carboxyethyl) phosphine, pH 7.4).
Both biological (new sample preparations from a stock aliquot) and technical (same sample preparation) replicates were performed for assays in this study. Protein concentrations were determined by Bradford assay and reported as concentrations of KorA or KorB dimers.
E. coli His10–PPX–RNAPPlasmid pVS11 (also called pEcrpoABC(-XH)Z)59,60 was used to overexpress each subunit of E. coli RNAP (full-length α, β, ω) as well as β′-PPX-His10 (PPX; PreScission protease site, LEVLFQGP, GE Healthcare) were co-introduced with a pACYCDuet-1::E.coli rpoZ into E. coli BL21(DE3) to ensure saturation of all RNAPs with E. coli RpoZ. Cells were grown in the presence of 100 µg ml−1 ampicillin and 34 μg ml−1 chloramphenicol to an OD600 of ~0.6 in a 37 °C shaker. Protein expression was induced with 1 mM IPTG (final concentration) for 4 h at 30 °C. Cells were collected by centrifugation and resuspended in 50 mM Tris–HCl pH 8.0, 5% w/v glycerol, 10 mM dithiothreitol (DTT), 1 mM phenylmethylsulfonyl fluoride (PMSF) and 1× protease inhibitor cocktail. For 200× protease inhibitor cocktail (40 ml volume), the following are dissolved into 100% ethanol: 696 mg PMSF, 1.248 g benzamidine, 20 mg chymostatin, 20 mg leupeptin, 4 mg pepstatin A and 40 mg aprotinin.
After lysis by French press (Avestin) at 4 °C, the lysate was centrifuged twice for 30 min each. Polyethyleneimine (PEI, 10% w/v pH 8.0, Acros Organics, Thermo Fisher Scientific) was slowly added to the supernatant to a final concentration of ~0.6% PEI with continuous stirring. The mixture was stirred at 4 °C for an additional 25 min, then centrifuged for 1.5 h at 4 °C. The pellets were washed three times with 50 mM Tris–HCl pH 8.0, 500 mM NaCl, 10 mM DTT, 5% w/v glycerol, 1 mM PMSF, and 1× protease inhibitor cocktail. For each wash, the pellets were homogenized and then centrifuged again. RNAP was eluted by washing the pellets three times with 50 mM Tris–HCl pH 8.0, 1 M NaCl, 10 mM DTT, 5% w/v glycerol, 1× protease inhibitor cocktail and 1 mM PMSF. The PEI elutions were combined and precipitated overnight with ammonium sulfate at a final concentration of 35% w/v. The mixture was centrifuged, and the pellets were resuspended in 20 mM Tris–HCl pH 8.0, 1 M NaCl, 5% w/v glycerol and 1 mM β-mercaptoethanol (BME). The mixture was loaded onto two 5 ml HiTrap IMAC HP columns (Cytiva) for a total column volume of 10 ml. RNAP(β′-PPX-His10) was eluted at 250 mM imidazole in column buffer (20 mM Tris–HCl pH 8.0, 1 M NaCl, 5% w/v glycerol and 1 mM BME). The eluted RNAP fractions were combined and dialysed into 10 mM Tris–HCl pH 8.0, 0.1 mM EDTA pH 8.0, 100 mM NaCl, 5% w/v glycerol and 5 mM DTT. The sample was then loaded onto a 40 ml Bio-Rex-70 column (Bio-Rad), washed with 10 mM Tris–HCl pH 8.0, 0.1 mM EDTA, 5% w/v glycerol and 5 mM DTT in isocratic steps of increasing concentration of NaCl (eluted at 0.5 M NaCl). The eluted fractions were combined, concentrated by centrifugal filtration, then loaded onto a 320 ml HiLoad 26/600 Superdex 200 column (Cytiva) pre-equilibrated in gel filtration buffer (10 mM Tris–HCl pH 8.0, 0.1 mM EDTA pH 8.0, 0.5 M NaCl, 5% w/v glycerol and 5 mM DTT). The eluted RNAP was concentrated to ~8–10 mg ml−1 by centrifugal concentration, supplemented with glycerol to 20% w/v, flash frozen in liquid nitrogen and stored at −80 °C.
E. coli His10-SUMO (small ubiquitin-like modifier)-σ70Plasmid pSAD1403 (ref. 61) was introduced into E. coli BL21(DE3). The cells were grown in the presence of 50 μg ml−1 kanamycin to an OD600 of ~0.6 at 37 °C. Protein expression was induced with 1 mM IPTG for 1–1.5 h at 30 °C. Cells were collected by centrifugation and resuspended in 20 mM Tris–HCl pH 8.0, 500 mM NaCl, 0.1 mM EDTA pH 8.0, 5 mM imidazole, 5% w/v glycerol, 0.5 mM BME, 1 mM PMSF and 1× protease inhibitor cocktail. After lysis by French press (Avestin) at 4 °C, cell debris was removed by centrifugation twice. The lysate was loaded onto two 5 ml HiTrap IMAC HP columns (Cytiva) for a total column volume of 10 ml. His10-SUMO-σ70 was eluted at 250 mM imidazole in 20 mM Tris–HCl pH 8.0, 500 mM NaCl, 0.1 mM EDTA pH 8.0, 5% w/v glycerol and 0.5 mM BME. Peak fractions were combined, cleaved with Ulp1 protease and dialysed against 20 mM Tris–HCl pH 8.0, 500 mM NaCl, 0.1 mM EDTA pH 8.0, 5% w/v glycerol and 0.5 mM BME, resulting in a final concentration of 25 mM imidazole. The cleaved sample was loaded onto one 5 ml HiTrap IMAC HP to remove His10-SUMO tag along with any remaining uncleaved σ70. Untagged σ70 fractions were pooled and diluted with 10 mM Tris–HCl pH 8.0, 0.1 mM EDTA pH 8.0, 5% w/v glycerol and 1 mM DTT until the conductivity corresponds to NaCl concentration slightly below 200 mM. The diluted sample was injected onto three 5 ml HiTrap Heparin HP columns (total column volume of 15 ml; Cytiva) which were pre-equilibrated at the same diluent buffer but with 200 mM NaCl, with a gradient to 1 M NaCl, with the first major peak as the target peak. The target peak sample was pooled and concentrated by centrifugal filtration before being loaded onto a HiLoad 16/60 Superdex 200 (Cytiva) which was pre-equilibrated in 20 mM Tris–HCl pH 8.0, 500 mM NaCl, 5% w/v glycerol and 1 mM DTT. Peak fractions of σ70 were pooled, supplemented with glycerol to a final concentration of 20% w/v, flash frozen in liquid nitrogen and stored at −80 °C.
Protein crystallizationCrystallization screens for both KorBΔN30ΔCTD–CTPγS and KorBΔN30ΔCTD–KorA–OA complexes were performed in sitting-drop vapour diffusion format in MRC2 96-well crystallization plates. Drops consisted of 0.3 μl precipitant solution and 0.3 μl protein complex with incubation at 293 K.
KorBΔN30ΔCTD–CTPγSPurified His-tagged KorBΔN30ΔCTD was premixed at 20 mg ml−1 with 1 mM MgCl2 and 1 mM CTPγS in buffer containing 10 mM Tris–HCl and 150 mM NaCl, pH 8.0. The KorBΔN30ΔCTD–CTPγS crystals grew in a solution containing 160 mM LiOAc and 2.0 M ammonium sulfate. Suitable crystals were cryoprotected with 20% (v/v) ethylene glycol and mounted in Litholoops (Molecular Dimensions). Crystals were flash-cooled by plunging into liquid nitrogen.
KorBΔN30ΔCTD–KorA–OAPurified His-tagged KorBΔN30ΔCTD was combined with purified His-tagged KorA in equimolar concentrations before being purified by gel filtration as described above. The protein complex was premixed at 20 mg ml−1 with a 14 bp dsDNA (OA, TGTTTAGCTAAACA) at a molar ratio 1:1.2 (protein complex to DNA) in buffer containing 10 mM Tris–HCl and 150 mM NaCl, pH 8.0. Crystals grew in a solution containing 1.95 M ammonium sulfate and 0.1 M NaOAc, pH 4.6. Suitable crystals were cryoprotected with 25% (v/v) glycerol and mounted in Litholoops (Molecular Dimensions). Crystals were flash-cooled by plunging into liquid nitrogen.
Structure determination and refinementX-ray data were recorded either on beamline I04-1 or beamline I03 at the Diamond Light Source using either an Eiger2 XE 9M or an Eiger2 XE 16M hybrid photon counting detector (Dectris), respectively, with crystals maintained at 100 K by a Cryojet cryocooler (Oxford Instruments). Diffraction data were integrated and scaled using DIALS (v. 3)62 via the XIA2 (v. 3.9.dev0) expert system62 then merged using AIMLESS (v. 0.7.7)63. The majority of the downstream analysis was performed through the CCP4i2 (v. 7.1.018) graphical user interface64. MolProbity (v. 4.4) was additionally used for validation of 3D atomic models. Data collection statistics are summarized in Supplementary Table 5.
X-ray data for KorBΔN30ΔCTD–CTPγS were collected from a single crystal at a wavelength of 0.9179 Å and processed to 2.3 Å resolution in space group P212121, with approximate cell parameters of a = 58.7, b = 152.8 and c = 198.3 Å. Analysis of the likely composition of the asymmetric unit suggested that it could contain between four and eight copies of the KorB subunit with an estimated solvent content in the range of 43–72%.
Structural predictions for KorB were generated using AlphaFold2 (AF2)65, as implemented through ColabFold66. There was good sequence coverage, and the predicted local distance difference test (pLDDT) scores were generally good (for example, average of 85 from the rank 1 prediction). For a single subunit simulation, the predicted aligned error scores indicated a two-domain structure with very low confidence in the relative placement of the two domains, while for a dimer simulation, the predicted aligned error scores suggested high confidence in the relative placement of all four domains. Consistent with this, all five independently generated models were closely superposable.
The KorBΔN30ΔCTD–CTPγS complex structure was solved via molecular replacement using PHASER67. A dimer template was prepared from the rank 1 AF2 model using the ‘Process Predicted Models’ CCP4i2 task, which removed low-confidence regions (based on pLDDT) and converted the pLDDT scores in the B-factor field of the PDB coordinate files to pseudo B factors. Initial attempts used an isomorphous dataset at 3.25 Å resolution. After much trial and error, searching with separate templates corresponding to the two KorB domains showed the most promise. PHASER (v. 2.8.3) produced a partial solution where three pairs of domains were juxtaposed such that they could be connected into single subunits using COOT (v. 0.9.6)68. One of the latter was then used as the template for a subsequent run, where PHASER placed five of these in the asymmetric unit (ASU), which were arranged as two dimers and a single subunit. Inspection of this solution in COOT revealed residual electron density adjacent to the latter which could be filled by a sixth subunit by extrapolation from one of the dimers. This final composition of six protomers per ASU gave an estimated solvent content of 57%. When the 2.3 Å resolution dataset became available, the preliminary model was refined directly against this in REFMAC5 (v. 5.8.0403)69. At this stage, residual electron density at the interface between the NTDs of each dimer indicated the presence of two symmetry-related ligands. These were built as CTP molecules, as it was not possible to define the locations of the sulfur atoms of CTPγS. The model was completed through several iterations of model building in COOT and restrained refinement in REFMAC5. Pairwise superpositions of the three dimers gave overall r.m.s. deviations of 0.63–1.18 Å, indicating that they were closely similar. Comparison against the AF2 dimer model showed that this experimental structure had a domain-swapped arrangement, while the predicted structure did not. Refinement and validation statistics are summarized in Supplementary Table 5.
X-ray data for KorBΔN30ΔCTD–KorA–OA were collected from a single crystal at a wavelength of 0.9763 Å (2 × 360° passes) and processed to 2.7 Å resolution in space group C2, with approximate cell parameters of a = 173.2, b = 77.1, c = 84.6 Å and β = 107.4°. Analysis of the likely composition of the asymmetric unit suggested that it contained a single complex comprising two copies of each of the KorA and KorB subunits and a single DNA duplex, giving an estimated solvent content of 61%.
The structure was solved via molecular replacement using PHASER. Separate templates were prepared for the two KorB domains from the A chain of the above KorBΔN30ΔCTD–CTPγS complex, for the KorA subunit by taking a single chain from the previously solved KorA–DNA complex (PDB code 2W7N)70 and for the DNA by generating an ideal B-form DNA duplex in COOT from the palindromic sequence TGTTTAGCTAAACA. PHASER was able to locate the four domains expected for a KorB dimer and the DNA duplex, but not the two KorA subunits. However, after refinement in REFMAC5, a clear difference density was visible for the missing KorA subunits. These could be manually placed from a superposition of the KorA–DNA complex. Several sulfates were built into the density, presumably derived from the precipitant. Two of these occupied positions equivalent to the β-phosphates of the CTP ligands in the previous structure. The model was completed through several iterations of model building in COOT and restrained refinement in REFMAC5. In contrast to the KorB dimer from the CTP complex, this dimer does not have a domain-swapped architecture. Moreover, a superposition of this KorB dimer onto the AF2 dimer model revealed that they were almost identical at the protein backbone level, giving an overall r.m.s. deviation of only 1.01 Å. Refinement and validation statistics are summarized in Supplementary Table 5.
DNA preparation for in vitro NTPase, crosslinking and ITC experimentsPalindromic single-stranded DNA oligonucleotides (OB, GGGATATTTTAGCGGCTAAAAGGA; OA, TGTTTAGCTAAACA) (100 µM in 1 mM Tris–HCl pH 8.0, 5 mM NaCl buffer) were heated at 98 °C for 5 min before being left to cool down to room temperature overnight to form 50 µM dsDNA. The core sequence of OB or OA is underlined.
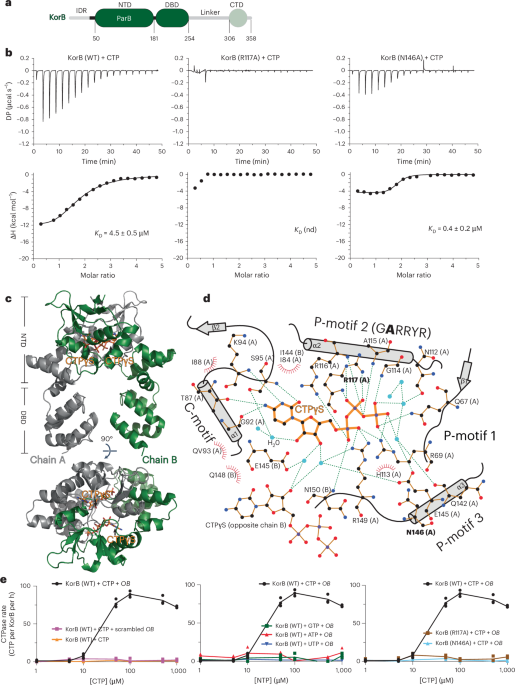
Measurement of CTPase activity by EnzChek phosphate release assayCTP hydrolysis was monitored using an EnzCheck Phosphate Assay Kit (Thermo Fisher Scientific). Samples (100 µl) containing a reaction buffer supplemented with an increasing concentration of CTP (1, 5, 10, 50, 100, 500 and 1,000 µM), 0.5 µM of 24 bp OB DNA, and 1 µM dimer concentration of KorB (WT or mutants) were assayed in a CLARIOstar Plus plate reader (BMG Labtech) at 25 °C for 5 h with readings every 2 min with continuous orbital shaking at 300 r.p.m. between reads. The reaction buffer (1 ml) typically contained 740 μl ultrapure water, 50 μl 20× reaction buffer (100 mM Tris–HCl, 2 M NaCl and 20 mM MgCl2, pH 8.0), 200 μl 2-amino-6-mercapto-7-methylpurine riboside (MESG) substrate solution and 10 μl purine nucleoside phosphorylase enzyme (one unit). Reactions with buffer only or buffer + CTP + 24 bp OB DNA only were also included as controls. The inorganic phosphate standard curve was also constructed according to the instruction guidelines. The results were analysed using Excel (v. 16.92) and plotted in GraphPad Prism (v. 9.5.1). The CTPase rates were calculated using a linear regression fitting in GraphPad Prism 9. Error bars represent standard deviations from triplicate experiments.
In vitro crosslinking assay using a sulfhydryl-to-sulfhydryl crosslinker BMOEA 50 µl mixture of 8 µM dimer concentration of KorB WT or mutants ± 1 mM NTP ± 0.5 µM 24 bp dsDNA containing OB or scrambled OB was assembled in a reaction buffer (10 mM Tris–HCl pH 7.4, 100 mM NaCl and 1 mM MgCl2) and incubated for 5 min at room temperature. BMOE was added to a final concentration of 1 mM, and the reaction was quickly mixed by three pulses of vortexing. The reaction was then immediately quenched through the addition of SDS–PAGE sample buffer containing 23 mM BME. Samples were heated to 50 °C for 5 min before being loaded on 12% Novex WedgeWell Tris-Glycine gels (Thermo Fisher Scientific). Protein bands were stained with an InstantBlue Coomassie protein stain (Abcam), and band intensity was quantified using ImageJ (v. 2.14.0/1.54f). The results were analysed in Excel and plotted using GraphPad Prism 9.
For the experiments containing KorA in addition to KorB, an equimolar amount was used (8 µM of WT or mutants, dimer concentration). The reaction was otherwise assembled identically and loaded on 4–20% Novex WedgeWell Tris-Glycine gels (Thermo Fisher Scientific) for sufficient separation of KorA in the samples. Band intensity was quantified using ImageJ, and the results were analysed in Excel and plotted using GraphPad Prism 9.
ITCAll ITC experiments were recorded using a MicroCal PEAQ ITC instrument (Malvern Panalytical). Experiments were performed at 25 °C. For protein–nucleotide binding experiments, all components were in 10 mM Tris–HCl, 150 mM NaCl and 5 mM MgCl2, pH 8.0 buffer. For protein–protein binding experiments, all components were in 10 mM Tris–HCl and 150 mM NaCl, pH 8.0 buffer. For each ITC run, the calorimetric cell was filled with 20 μM dimer concentration of KorB (WT or mutant), and a single injection of 0.4 μl of 500 μM small-molecule nucleotides or 200 μM protein partner was performed first, followed by 19 injections of 2 μl each. Injections were carried out at 150 s intervals with a stirring speed of 750 r.p.m. The raw titration data were integrated and fitted to a one-site binding model using the built-in software of the MicroCal PEAQ ITC instrument. Each experiment was run in duplicate. Controls of ligand into buffer and buffer into protein were performed with no signal observed. Where required, representative data are presented.
xylE reporter gene assaysReporter gene assays were carried out using a modified version of ref. 71. In short, E. coli DH5α cells containing relevant expression plasmids were grown to a logarithmic phase from a 1:100 dilution of overnight culture. Induction of KorB WT/mutant expression was achieved with 0.2% (PkorA; Fig. 5e) and 0.02% (PtrbB; Fig. 3) arabinose. In the three plasmid experiments, induction of KorA WT/Y84A required no additional IPTG. About 10 or 50 ml of culture was pelleted and resuspended in 500 μl resuspension buffer (0.1 M sodium phosphate buffer pH 7.4, 10% v/v acetone). From this point onwards, samples were kept on ice. Cells were disrupted using sonication at 10 µm for 10 s and subsequently pelleted. The supernatant was transferred to a fresh microcentrifuge tube and assayed for catechol 2,3-oxygenase activity. Samples were diluted 1:10 in reaction buffer (0.1 M sodium phosphate buffer pH 7.4, 200 μM catechol) and incubated at room temperature for 1 min before the absorbance at 374 nm was determined using a BioMate 3 spectrophotometer (Thermo Fisher Scientific). Protein concentration, determined using Bradford assay, was used to normalize the samples. The results were analysed in Excel and plotted using GraphPad Prism 9.
Immunoblot analysisFor western blot analysis samples, 200 ng total protein lysate was resuspended in 1× SDS–PAGE sample buffer and heated to 95 °C for 10 min before loading. Denatured samples were run on 12% Novex WedgeWell gels (Thermo Fisher Scientific) at 150 V for 55 min. Resolved proteins were transferred to PVDF membranes using the Trans-Blot Turbo Transfer System (BioRad) and incubated with a 1:5,000 dilution of α-KorB primary antibody (Cambridge Research Biochemicals) or with 1:300 dilution of α-KorA. Membranes were washed and subsequently probed with a 1:10,000 dilution of mouse α-rabbit HRP-conjugated secondary antibody (Abcam). Blots were imaged after incubation with SuperSignal West PICO PLUS Chemiluminescent Substrate (Thermo Fisher Scientific) using an Amersham Imager 600 (GE HealthCare). Loading controls of denatured 200 ng total protein lysate were run on 12% Novex WedgeWell gels (Thermo Fisher Scientific) at 150 V for 55 min and stained with InstantBlue Coomassie protein stain (Abcam).
Protein labelling with Alexa Fluor for confocal optical tweezers (C-trap) experimentsC-terminally His-tagged versions of KorB (A6C) and KorA (WT/Y84A variant) with an extra cysteine residue at the C-terminus were coupled to maleimide-conjugated Alexa Fluor (AF) 488 and 647, respectively. A6C was selected because it resides in a surface-exposed intrinsically disordered region at the N-terminal region of KorB. His-tagged KorB (A6C) and His-tagged KorA-extra C were purified as described for the WT proteins. About 250 µl of 50 µM KorB (A6C) or KorA-extra C were incubated with 0.3 mM tris-carboxyethyl phosphine for 30 min at room temperature in a buffer containing 10 mM Tris–HCl and 300 mM NaCl, pH 7.4. Subsequently, 6 µl of 30 mM AF488 or AF647 (dissolved in DMSO) was added, and the reaction was incubated with rotation at 4 °C overnight. The conjugate solution was then loaded onto a Superdex increase 200 pg 10/300 gel filtration column (pre-equilibrated with 10 mM Tris–HCl, 300 mM NaCl, pH 8.0) to separate labelled KorB/A from unincorporated fluorophore. AF-labelled KorB/A was pooled and concentrated before storage as described for WT KorB and KorA.
Design and construction of a DNA plasmid with 16×OB sites and 1×OA site for magnetic tweezers experimentsA DNA plasmid containing 16×OB sites (ATTTTAGCGGCTAAAAG) and 1×OA site (AATGTTTAGCTAAACCTT) was produced by modification of a pUC19 plasmid containing a single copy of each site separated by 1,016 bp (pUC19_v1), following several cloning steps and methods described elsewhere29,72.
First, the original pUC19 plasmid (4,886 bp) with one of each site was enlarged by introducing a piece of DNA obtained from a lab plasmid. This resulted in a larger plasmid (7,699 bp) which, after digestion with appropriate restriction enzymes, produces the central part of a magnetic tweezers DNA construct with centred OB and OA sites.
To increase the number of OB sites, two long oligonucleotides (Supplementary Table 4) containing 2×OB sites separated by 40 bp with a PshAI restriction site in the middle of this region were annealed by heating at 95 °C for 5 min and cooling down to 20 °C at a rate of −1 °C min−1 in hybridization buffer (10 mM Tris–HCl pH 8.0, 1 mM EDTA, 200 mM NaCl and 5 mM MgCl2) followed by a phosphorylation step of the 5′-terminal ends by the T4 PNK (NEB). This dsDNA duplex was ligated into the previous plasmid of 7,699 bp that already contained 1×OA and 1×OB sites digested with PshAI restriction enzyme (NEB) and dephosphorylated. These oligonucleotides were designed to lose the original PshAI site at both ends after ligation, so that once ligated into a cloning plasmid they could not be cleaved again by PshAI. The single bona fide PshAI site located in the middle of the duplex allows for repetition of the ligation process to be repeated as many times as desired in the cloning plasmid to add new pairs of OB sites. Plasmids containing 1×OA site and up to 8×OB have been obtained following this procedure. Note that in one of the rounds of cloning and by chance, half of a previous duplex was lost during the ligation process, and therefore the final plasmid contains 8×OB instead of 9×OB as expected.
A plasmid with 1×OA site and 16×OB was produced by PCR amplifying an 8×OB cassette with Phusion High-Fidelity DNA Polymerase (Thermo Scientific) (see Supplementary Table 4 for primer sequences). The PCR fragment was then digested with SpeI and XhoI (both from NEB) and ligated into the plasmid already containing 1×OA site and 8×OB copies previously digested with XbaI (NEB) and XhoI and dephosphorylated. This resulted in a plasmid with 1×OA site and 16×OB sites (8,705 bp). Plasmids were introduced into E. coli DH5α competent cells, and potentially positive colonies were then selected by colony PCR. Plasmids were purified from the cultures using a QIAprep Spin Miniprep Kit (QIAGEN), analysed by restriction enzyme digestion and finally verified by Sanger sequencing. This plasmid was subsequently used to produce a magnetic tweezers dsDNA construct.
Construction of large plasmids with different combinations of OB and OA sites for confocal optical tweezers (C-Trap) experimentsC-Trap experiments were performed on three types of molecule: one containing only a single copy of the OA site without any OB site and two different versions containing 1×OA or 2×OA sites together with 8×OB sites. Therefore, different large plasmids were cloned. First, a large DNA plasmid with 1×OA site was fabricated by ligating a DNA fragment containing a single copy of the OA site into a previously prepared large plasmid in our laboratory that did not contain either of these sites. The fragment containing the OA site was obtained by PCR amplification using Phusion High-Fidelity DNA Polymerase with the pUC19 plasmid containing a single copy of the OB and OA sites as a template (see Supplementary Table 4 for sequences of oligonucleotides). The PCR fragment was digested with KpnI (NEB) and ligated into the previously large plasmid prepared in our laboratory that did not contain either of these sites, digested with KpnI and dephosphorylated. This resulted in a large plasmid with a single OA site (20,985 bp). A DNA fragment with 8×OB sites was then inserted over this new large plasmid. The 8×OB fragment was obtained by PCR amplification (see Supplementary Table 4 for sequences of oligonucleotides) using Phusion High-Fidelity DNA Polymerase with the magnetic tweezers plasmid that contained 1×OA and 8×OB sites as a template. The PCR fragment was digested with SpeI and XbaI and ligated into the large plasmid, which already contained 1×OA site, digested with XbaI and dephosphorylated, resulting in a large plasmid with 1×OA site and 8×OB sites (22,394 bp). The large DNA plasmid containing 8×OB sites and 2×OA sites (22,733 bp) was produced by inserting a new copy of the OA site into the previously described plasmid digested with NruI (NEB). A new 339 bp dsDNA fragment with a copy of the OA site was obtained by digestion of the pUC19 plasmid containing a single copy of the OB and OA sites with SfoI and HpaI (NEB). The dsDNA fragment was gel extracted, purified and ligated into the NruI-linearized large plasmid described before. The plasmids were cloned and analysed as described before for magnetic tweezers plasmids, looking for a final plasmid with the new OA site in the same orientation as the previous one. These plasmids were subsequently used to prepare various C-Trap dsDNA constructs.
Magnetic tweezers dsDNA construct with 16×OB and 1×OA sitesThe dsDNA construct for magnetic tweezers experiments consisted of a central dsDNA fragment of 8,693 bp containing 16×OB and 1×OA sites, obtained by digestion with NotI and ApaI (NEB) of the final magnetic tweezers plasmid described above, flanked by two highly labelled DNA fragments, one with digoxigenins and the other with biotins, of 997 bp and 140 bp, respectively, used as immobilization handles. The biotinylated handle was shorter to minimize the attachment of two beads per DNA tether. Handles for magnetic tweezers constructs were prepared by PCR (see Supplementary Table 4 for sequences of oligonucleotides) with 200 µM final concentration of each dNTP (dGTP, dCTP, dATP), 140 µM dTTP and 66 µM Bio-16-dUTP or Dig-11 dUTP (Roche) using plasmid pSP73-JY0 (ref. 73) as template, followed by digestion with the restriction enzyme ApaI or PspOMI (NEB), respectively. Labelled handles were ligated to the central part overnight using T4 DNA Ligase (NEB). The sample was then ready for use in magnetic tweezers experiments without further purification. The DNAs were never exposed to intercalating dyes or UV radiation during their production and were stored at 4 °C. The sequence of the central part of the magnetic tweezers construct is included in Supplementary Table 6.
C-Trap dsDNA constructs with different combinations of OB and OA sitesC-Trap experiments were performed on three types of molecule: one containing a single copy of the OA site without any OB sites and two different versions containing 1×OA or 2×OA sites together with 8×OB sites. The C-Trap dsDNA construct consisting of a large central fragment of 22,394 bp containing 8×OB and 1×OA sites was produced by digestion of the large C-trap plasmid with NotI. Without further purification, the fragment was ligated to highly biotinylated handles of ~1 kbp ending in PspOMI. Handles for C-Trap constructs were prepared by PCR (see Supplementary Table 4 for sequences of oligonucleotides) as described for biotin-labelled magnetic tweezers handles. These handles were highly biotinylated to facilitate the capture of DNA molecules in the C-Trap experiments. As both sides of the DNA fragment end in NotI, it is possible to generate tandem (double length) tethers flanked by the labelled handles. The sample was ready for use in C-Trap experiments without further purification. The dsDNA constructs with 8×OB and 2×OA sites (22,733 bp) or with only a 1×OA site (20,985 bp) were equally prepared, but they were obtained by digestion with NotI of the other large C-Trap plasmids described above: the one with 8×OB and 2×OA sites or the one with a single copy of the OA site without any OB sites, respectively. The DNAs were not exposed to intercalating dyes or UV radiation during their production and were stored at 4 °C. The sequence of the central part of the C-Trap construct is included in Supplementary Table 6.
Confocal optical tweezers experimentsConfocal optical tweezers experiments were carried out using a dual optical tweezers set-up combined with confocal microscopy and microfluidics (C-Trap; Lumicks)74,75. A computer-controlled stage allowed rapid displacement of the optical traps within a five-channel fluid cell, allowing the transfer of the tethered DNA between different channels separated by laminar flow. Channel 1 contained 4.38 µm streptavidin-coated polystyrene beads (Spherotech). Channel 2 contained the DNA substrate labelled with multiple biotins at both ends. Both DNA and beads were diluted in 20 mM HEPES pH 7.8, 100 mM KCl and 5 mM MgCl2. A single DNA tether was assembled by first capturing two beads in channel 1, one in each optical trap, and fishing for a DNA molecule in channel 2. The tether was then transferred to channel 3 filled with reaction buffer (10 mM Tris pH 8, 100 mM NaCl, 5 mM MgCl2 and 1 mM DTT) to verify the correct length of the DNA by force–extension curves. The DNA was then incubated for 1 min in channel 4 filled with KorB and/or KorA proteins in reaction buffer and supplemented with 2 mM CTP as indicated. To reduce the fluorescence background in single KorB diffusion measurements, imaging was occasionally performed in channel 3 after protein incubation in channel 4 (as indicated in figure legends). All the fluorescence intensities in kymograms were normalized, and the scales in the intensity profiles were adjusted for better visualization. Scale bars in figures represent fluorescence intensity on the kymographs.
The system is equipped with three laser lines for confocal microscopy (488, 532 and 635 nm). In this study, the 488 nm laser was used to excite AF488–KorB and the 635 nm laser to excite AF647–KorA, with emission filters of 500–525 nm and 650–750 nm, respectively. Protein-containing channels were passivated with BSA (0.1% w/v in PBS) for 30 min before the experiment. Kymographs were generated by single line scans between the two beads using a pixel size of 100 nm and a pixel time of 0.1 ms, resulting in a typical time per line of 22.4 ms. The confocal laser intensity at the sample was 2.2 µW for the 488 laser and 1.92 µW for the 635 laser. Experiments were performed in constant-force mode at 15 pN.
Magnetic tweezers experimentsMagnetic tweezers experiments were performed using a homemade set-up that was previously described76,77. Briefly, optical images of micron-sized superparamagnetic beads tethered to a glass surface by DNA substrates were acquired using a ×100 oil immersion objective and a CCD camera operating at 120 Hz. Real-time image analysis allows the spatial coordinates of the beads to be determined with nanometre accuracy in the x, y and z directions. We controlled the stretching force of the DNA by using a step motor coupled to a pair of magnets located above the sample. The applied force is quantified from the Brownian motion of the bead and the extension of the tether, obtained by direct comparison of images taken at different focal planes78,79.
Magnetic tweezers experiments were performed as follows. The DNA sample containing 16×OB sites was diluted in 10 mM Tris–HCl pH 8.5 and 1 mM EDTA and mixed with 1-µm-diameter magnetic beads (Dynabeads, MyOne Streptavidin, Invitrogen) for 10 min. Magnetic beads were previously washed three times with PBS and resuspended in PBS/BSA at a 1:10 dilution. The DNA to bead ratio was adjusted to obtain as many single-tethered beads as possible. After incubation, we introduced the DNA–bead sample in a double-PARAFILM (Sigma)-layer flow cell and allowed them to sink for 10 min to promote the binding of the digoxigenin (DIG)-labelled end of the DNA to the anti-DIG glass-coated surface. Then, a force of 5 pN was applied to remove non-attached molecules from the surface. The chamber was washed with ~500 µl of PBS before experiments. Torsionally constrained molecules and beads containing more than a single DNA molecule were identified from their distinct rotation–extension curves and discarded for further analysis. Force–extension curves were generated by measuring the extension of the tethers at decreasing forces from 5.5 pN to 0.002 pN. The curves were first measured on naked DNA molecules, and then the experiment was repeated using different concentrations of B. subtilis ParB and KorB ± KorA in a reaction buffer (10 mM Tris pH 8, 100 mM NaCl, 5 mM MgCl2, 1 mM DTT and 0.1 mg ml−1 BSA) supplemented with 2 mM CTP. Data were analysed and plotted using OriginPro (v. 2022b) software.
Construction of PkorA and PkorA:λP R linear scaffoldsThe plasmid pUC19::146-bp-PkorA was used as a template to amplify a 146 bp linear PkorA DNA scaffold using primers 5′-AGACGAAAGCCCGGTTTCCGGG-3′ and 5′-CTCCGCGCCTTGGTTGAACATAG-3′ in a PCR reaction with Taq DNA polymerase (Promega) at an annealing temperature of 65 °C (Supplementary Table 4). The correct band was gel extracted from a 2% w/v agarose gel and eluted into TE buffer. The plasmid (pUC19-146-bp-PkorA:λPR) was similarly used as a template to amplify a linear 146 bp PkorA:λPR DNA scaffold (Supplementary Table 1).
Construction of a PkorA linear scaffold for nMSThe PkorA sequence was shortened to its minimal elements as a 100 bp DNA scaffold and synthesized as separate PAGE-purified top and bottom strand oligos (IDT) (Supplementary Table 6). The two strands were resuspended separately to 1 mM solutions in 10 mM Tris–HCl pH 8.0, 50 mM NaCl and 1 mM EDTA, pH 8.0. The strands were mixed in a 1:1 molar ratio for a 500 μM dsDNA (final concentration) and were heated to 95 °C before being cooled down to 25 °C in a 1 °C stepwise decrease using a Thermocycler PCR machine (Eppendorf). The resulting dsDNA was assayed by 2% w/v agarose gel electrophoresis for purity and was quantified using a Qubit (Invitrogen) dsDNA broad-range quantification kit.
Construction of a promoter bubble DNA for half-life abortive initiation assaysAn ideal promoter bubble DNA (generated with a non-complementary intervening sequence) was used as a competitor DNA for the in vitro half-life abortive initiation assays (Supplementary Table 6)80. The top and bottom strands were synthesized and annealed as described for WT PkorA 100-bp DNA scaffold used in nMS.
Electrophoretic mobility shift assaysTo check for E. coli Eσ70 binding to the PkorA DNA scaffolds, 50 nM of PkorA DNA scaffold was mixed with 50 nM E. coli Eσ70 and incubated at 37 °C for 5 min. In all biochemical experiments except nMS, Eσ70 was assembled by incubating E. coli His10–PPX–RNAP with a fivefold molar excess of σ70 at 37 °C for 15 min (excess σ70 was not purified away). The Eσ70–DNA sample was then loaded onto a 4.5% native Tris–borate–EDTA (90 mM TBE pH 8.3) polyacrylamide gel and run at a constant current of 15 mA for 1.5 h at 5–10 °C in a cold room. The gel was stained for dsDNA using GelRed (Biotium).
In vitro abortive initiation assay for transcription initiation repressionTo assay for transcription initiation repression, we monitored levels of abortive initiation RNA products in an NTP-restricted in vitro promoter-based transcription reaction. The 146 bp WT PkorA and PkorA:λPR discriminator linear DNA scaffolds were used to assay KorA and KorB-mediated repression on WT and mutant DNA-derived transcription, respectively. E. coli Eσ70 was assembled as described for electrophoretic mobility shift assays. The transcription buffer consists of 50 mM Tris–HCl pH 8.0, 10 mM MgCl2, 150 mM KCl, 0.1 mg ml−1 BSA and 1 mM DTT. Assembly of protein–DNA mixes before the addition of NTP mix involved a sequential incubation of DNA (10 nM), E. coli Eσ70 (50 nM) and KorAB factors (250 nM; and saturating CTP where relevant) at 37 °C in 5 min incubations. NTP mix (50 μM GTP, 250 μM ApU dinucleotide, 0.05 μCi per μl reaction volume of α-32P-GTP (PerkinElmer)) was added once all factors were added and incubated for 10 min at 37 °C to synthesize one abortive RNA band (5′-ApUpG*-3′; +1 to +3 RNA). Reactions were quenched using a 2× STOP buffer (45 mM TBE pH 8.3, 8 M urea, 30 mM EDTA pH 8.0, 0.05% w/v bromophenol blue and 0.05% w/v xylene cyanol). Reaction samples were analysed on a 23% denaturing PAGE (19:1 acrylamide to bis-acrylamide, 90 mM TBE pH 8.3, 6 M urea) for 1.5–2 h at a constant voltage of 800 V, and the gel was exposed to a storage phosphor screen for 1–2 h and imaged using a Typhoon Phosphorimager (Cytiva). Band intensities were quantified on ImageJ81, with measured values subtracted of the background and normalized to an E.coli Eσ70–DNA only control (no repression) for values to be averaged among replicates (n of at least 3 in all repression conditions). Repression as percentage values was calculated as (1-normalized intensity) × 100%, graphed and statistically analysed in GraphPad Prism using unpaired Welch’s t-tests.
In vitro abortive initiation assay for half-life estimationTo estimate half-lives of E. coli Eσ70-open promoter complexes on both the WT and mutant PkorA DNA scaffolds, we adapted the in vitro abortive initiation assay by including a competitor DNA to compete with the promoter DNA of interest. In this setup, the assay is similar to the previous abortive initiation assay80, except that competitor DNA is added in the beginning, and NTP mix is added afterwards at several varying timepoints. Eσ70 was incubated in transcription buffer for 5 min at 37
Comments (0)