
Remember me


Patient characteristics are shown in Table 1. A total of 779 patients who underwent oral cancer surgery were recruited in this study. A total of 2,185 person-years of follow-up up to July 2022, 632 cases were censored (comparising 519 surviving cases and 113 lost to follow-up, resulting in a loss rate of 14.51%), and 147 deaths were recorded, with a mean follow-up time of 34.14 ± 24.39 months. The mean age of all patients was 61.00 years (IQR: 52.00–69.00), and 305 (39.15%) were females and 474 (60.85%) were males. According to the clinical staging, most of the patients were in Stage IV (40.08%). The median PIV was 174.26 (IQR: 97.93- 297.95), and according to the X-tile software, a PIV cutoff value of 180.90 was obtained and patients were categorized into low PIV (≤ 180.9) or high PIV (> 180.9) group.
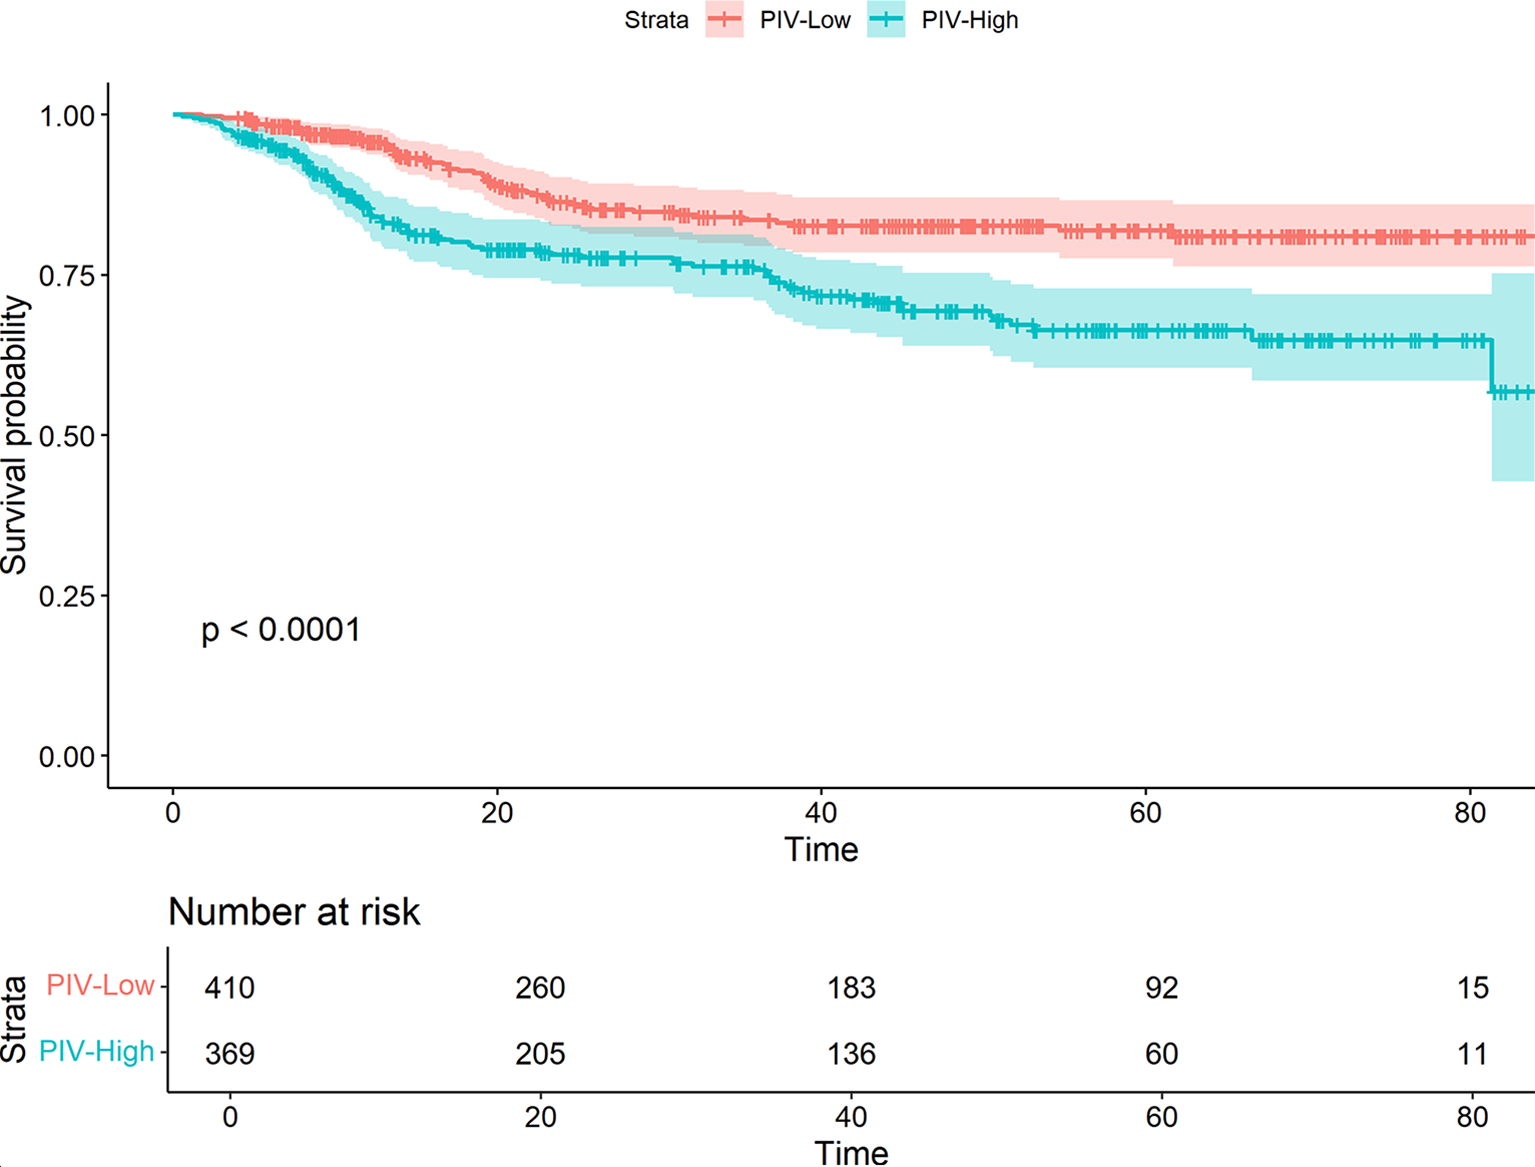
Table 1 Patient baseline demographicPrognostic analysis of PIVIn order to evaluate the prognostic influencing factors of oral cancer, this study conducted unifactorial and multifactorial analyses of oral cancer OS. In the unifactorial results (Supplemental Table 1), age, diabetes mellitus, clinical stage, degree of differentiation, BMI, PIV, comorbidities, and duration of surgery were the potential influencing factors related to oral cancer OS, and the above variables were included in the multifactorial Cox regression analyses. The results showed that age was positively associated with the prognosis of oral cancer (HR = 1.02, 95%CI:1.01–1.04, P = 0.009), the risk of death in patients with clinical stage IV was 3.13 times higher than that in patients with stage I (HR = 3.13, 95%CI:1.56–6.28, P = 0.001), and the risk of death in patients with poorly differentiated oral cancer was 1.63 times higher than that in patients with highly differentiated oral cancer (HR = 1.63, 95%CI:1.02–2.60, P = 0.043), and patients with BMI < 18.5Kg/m2 had an 81% increased risk of death compared with normal weight patients (HR = 1.81, 95%CI:1.17–2.28, P = 0.008) Postoperative complications were also associated with increased mortality risk (HR = 1.84, 95% CI:1.30–2.60, P = 0.001). Furthermore, higher PIV values were positively correlated with increased risk of death, with the high PIV group exhibiting a 1.62-fold higher risk compared to the low PIV group (HR = 1.62, 95%CI:1.15–2.29, P = 0.006) (Table 2). Figure 1 shows a significant survival difference (P < 0.001) between the low PIV group (PIV ≤ 180.9) and the high PIV group (PIV > 180.9).
Additionally, to explore the dose-response relationship between PIV values and the prognostic risk of oral cancer, a restricted cubic spline plot based on the raw PIV values was generated (Supplemental Fig. 2), which showed a linear association between PIV and prognostic risk (P For Nonlinear = 0.8561) .
Fig. 1
The Kaplan–Meier curve of low and high level of PIV
Table 2 Multivariate Cox regression analysis of OSPSM-based validationTo address the differences in baseline characteristics, we performed PSM based on the PIV grouping. Supplementary Table 2 presents the baseline characteristics before and after matching. Prior to matching, patients with a high PIV value were more likely to be male, smoke, not drink alcohol, have an oral cancer site of the tongue, be classified as stage IV, experience longer surgical durations, and have extended hospital stays following surgery. After matching, these variables were balanced and comparable, as demonstrated by the standardized mean differences (SMD) depicted in Supplementary Fig. 3. Following matching, the Kaplan-Meier curve (Figs. 2) indicated a continued survival difference between the high PIV value group and the low PIV value group (P = 0.0.34), and the multifactorial Cox regression after matching showed that (Table 3), age, stage, BMI, postoperative complications, and PIV value remained significant risk factors for oral cancer prognosis. Specifically, the risk of death was 1.55 times higher in the high PIV group compared to the low PIV group (HR = 1.55 times higher in the low PIV group). 1.55 times (HR = 1.55, 95%CI:1.03–2.23, P = 0.035), a finding consistent with results observed before matching.
Fig. 2
The Kaplan–Meier curve of low and high level of PIV after matching
Table 3 Multivariate Cox regression after PSMRandomized survival forest analysisThe significance value of each predictor variable in the RSF analysis was evaluated using the log-rank split rule, with a higher significance value indicating greater predictive power. As illustrated in Fig. 3, TNM stage, PIV value, duration of surgery, complications, BMI, postoperative hospitalization, postoperative radiotherapy, diabetes mellitus, degree of differentiation, hypertension, postoperative chemotherapy, tumor site, age, gender, and smoking were identified as significant predictors (variable importance > 0). Among these, PIV values were ranked third in predictive importance, indicating that PIV values play a crucial role in predicting the prognosis of oral cancer.
Fig. 3
Importance of stochastic survival forest variables
Building nomogram modelsWe constructed a prognostic Nomogram model for oral cancer patients based on age, clinical stage, degree of differentiation, diabetes mellitus, comorbidities, duration of surgery, PIV value, and BMI (Fig. 4). Further plotted ROC curves to compare the prognostic risk prediction ability of death of oral cancer with the traditional TNM staging (Fig. 5), which showed that the Nomogram model constructed by combining PIV value, exhibited strong predictive performance for 1-, 3-, and 5-year survival rates of oral cancer patients, with AUC values of 0.796, 0.754, and 0.756, respectively, and outperformed the predictive ability of traditional TNM. The internally validated calibration curves (Fig. 6) showed the good performance of the Nomogram model in predicting 1-, 3-, and 5-year survival rates of oral cancer.
Fig. 4
Nomogram model based on GLR and other significant predictors
Fig. 5
Comparison of prediction performance between PIV-based model and index TNM in OS
Fig. 6
Calibration curves for predicting prognostic 1-(A), 3-(B), and 5-year (C) survival rates PIV-based models
Comments (0)