Bioinformatics
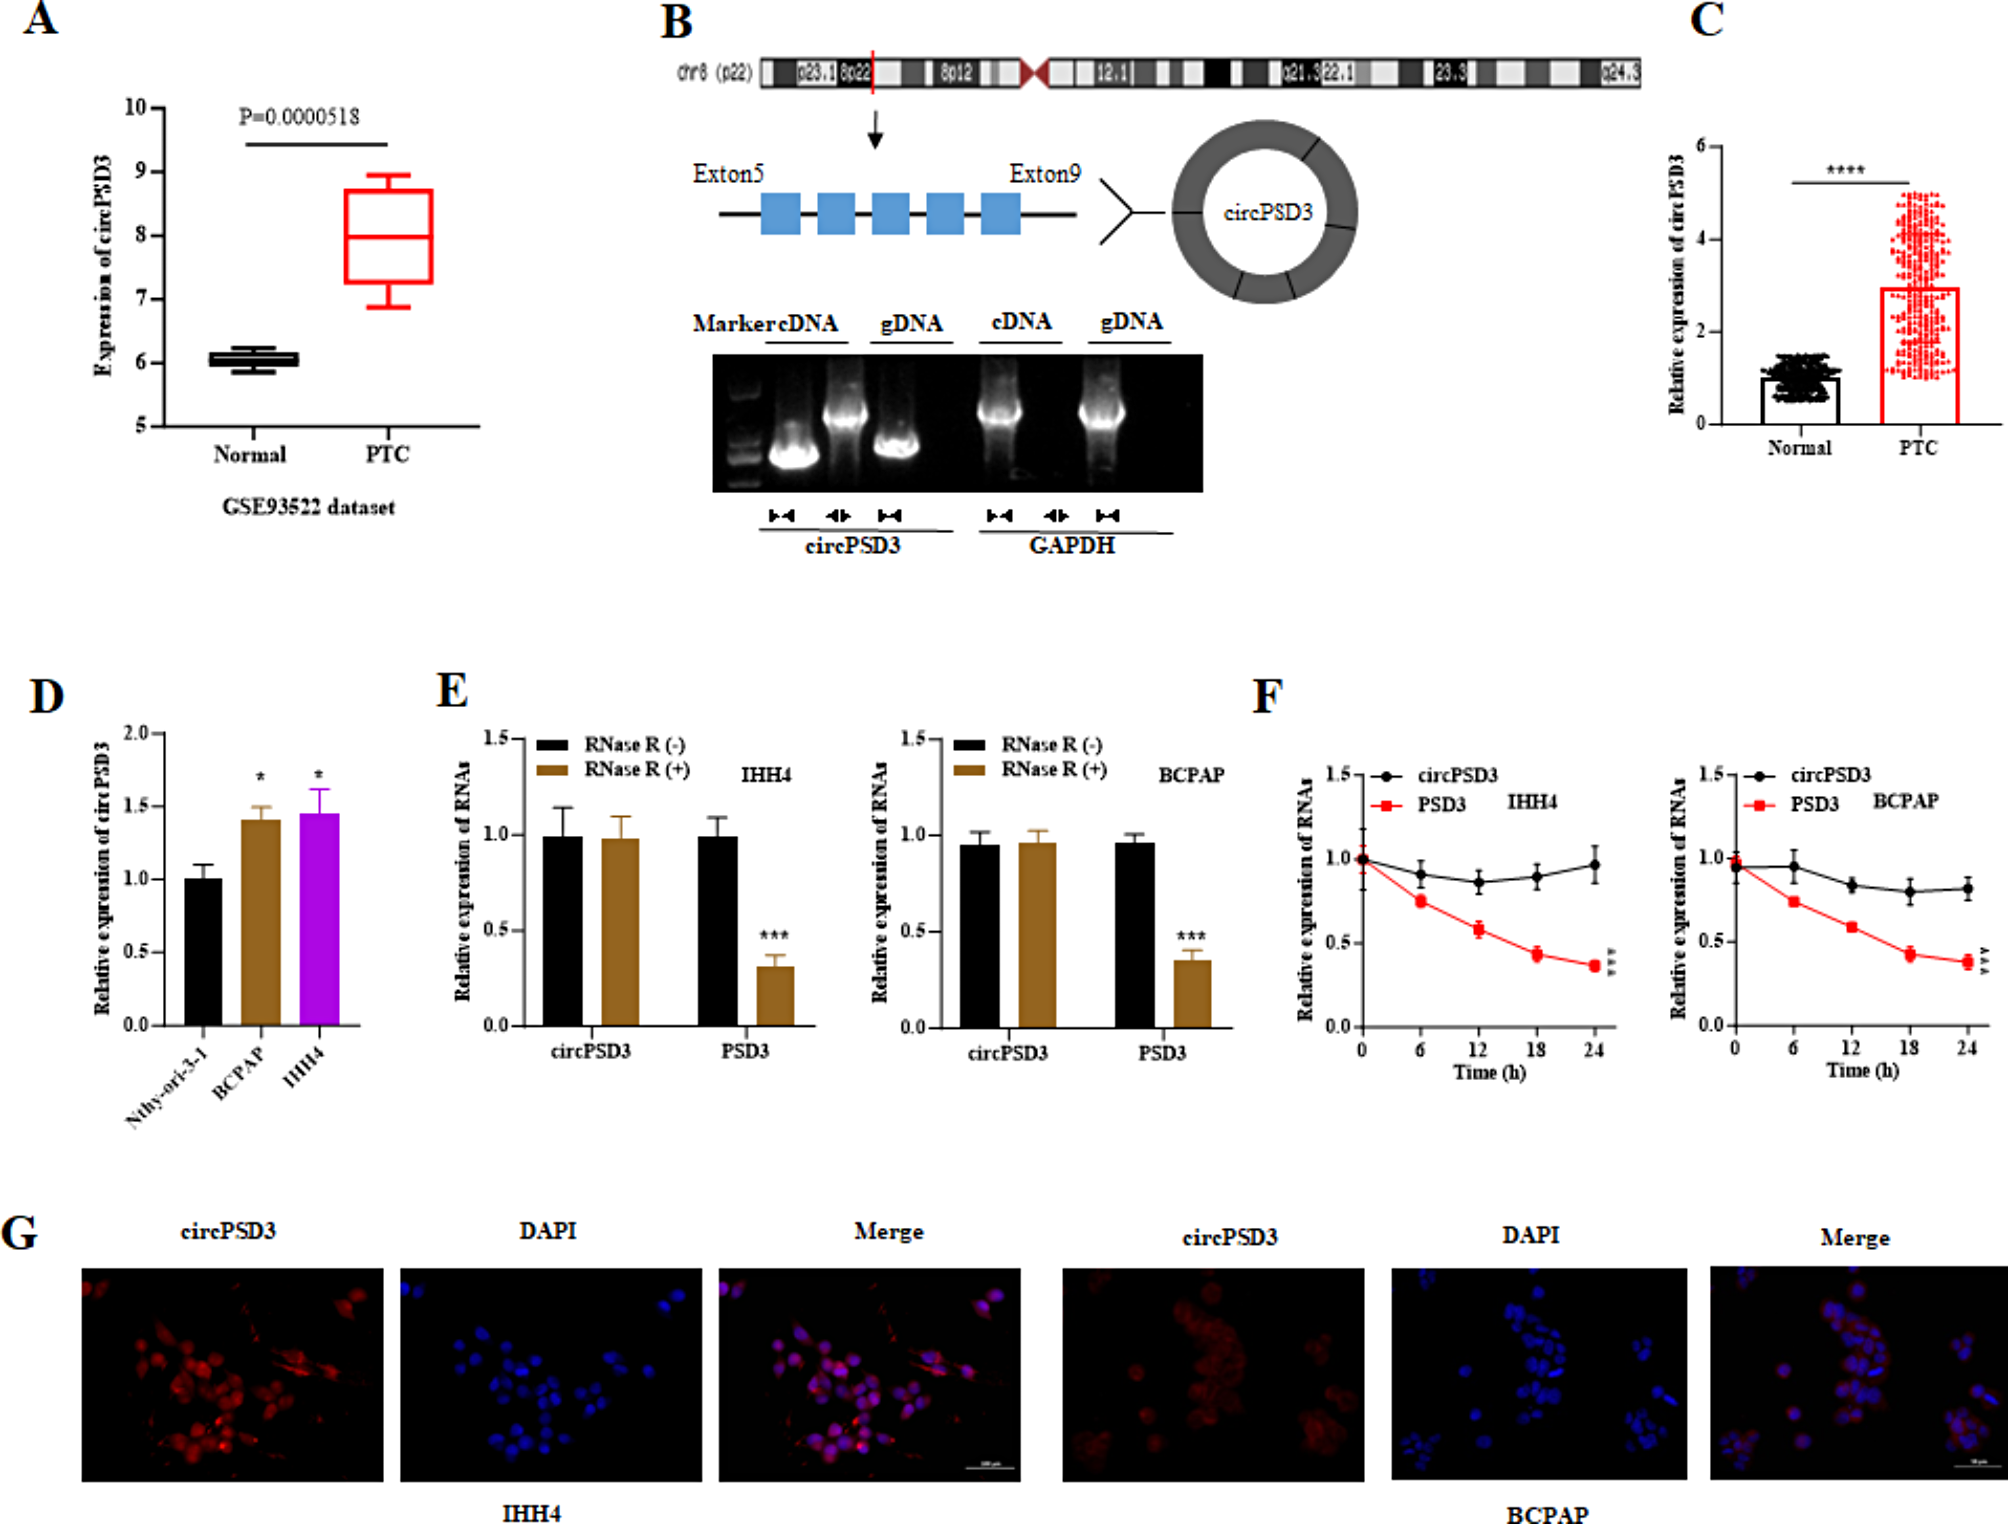
CircPSD3 (also termed hsa_circ_0002111) expression in six benign thyroid lesions and six matching contralateral normal samples was obtained from the GSE93522 dataset (https://www.ncbi.nlm.nih.gov/geo/query/acc.cgi?acc=GSE93522) [24]. The origin of exon circPSD3 was obtained from the circBase database (http://circbase.org/). To predict miRNAs that may interact with circPSD3 (hsa_circ_0002111), we utilized the Circinteractome web tool (https://circinteractome.nia.nih.gov/), which provides a comprehensive database of miRNA binding sites on circular RNAs. This resource allowed us to identify potential miRNAs that could bind to circPSD3, which is implicated in regulating various cellular processes. Furthermore, to predict the target mRNAs of miR-526b, we used the ENCORI (https://rnasysu.com/encori/index.php), a widely recognized resource for miRNA-target interaction analysis. This tool helped us identify putative mRNA targets of miR-526b, which may contribute to the downstream effects observed in our study.
Patient tissue specimens
A total of 326 pairs of PTC tumor and normal tissue sections were obtained from patients who were diagnosed with PTC through high-frequency ultrasound examination and fine-needle aspiration biopsy and who received surgery at Henan Provincial People’s Hospital in 2017 and 2022. At the same time, all these PTC samples were confirmed for the presence of BRAFV600E. Tissues were frozen in liquid nitrogen and stored at − 80 °C. This study was approved by Henan Provincial People’s Hospital. All patients had signed informed consent forms.
Detection of BRAFV600 mutation in patient tissue specimens
The mutation analysis of formalin-fixed and paraffin-embedded tumor tissues in thyroidectomy specimens was carried out as described previously [25]. Three 10 µm-thick unstained sections were obtained from the tumor tissue for dewaxing and macroscopic dissection. DNA was extracted using a Qiagen tissue DNA extraction kit (QIAGEN, Germany). BRAF exon 15 was amplified using a BRAF mutation detection kit. Briefly, 5 µL of DNA was added to a 35 µL amplification reaction. The upstream primer sequence of BRAF was 5’-ATGCTTGCTCTGATAGGAA-3’ while the downstream primer sequence was 5’-GCATCTCAGGGCCAAA-3’. Polymerase Chain Reaction (PCR) amplification was then performed. BRAF amplification products were purified and sequenced by the BigDye® Terminator v3.1 Cycle Sequencing Kit (Applied Biosystems, USA).
Cell culture and transfection
BRAFV600E PTC cell lines (IHH4 cells and BCPAP cells) and human normal thyroid cell line Nthy-ori-3-1 were obtained from ATCC (Manassas, VA, USA). Cells were incubated in RPMI-1640 medium (Invitrogen, USA) together with 10% FBS (Gibco, USA), 100 U/ml penicillin (Gibco, USA), and 100 µg/ml streptomycin (Gibco, USA) at 37 °C with 5% CO2.
To silence circPSD3 expression, shRNA specifically targeting circPSD3 (sh-circPSD3) and its negative control (sh-NC) were designed by GenePharma (Shanghai, China). The pcDNA3.1-BRAFV600E (OE-BRAF) and NC vector (OE-NC) were also developed by GenePharma to overexpress BRAF in cells. The shRNA targeting BRAF (sh-BRAF) and negative vector (sh-NC) were also developed by GenePharma to inhibit BRAF expression in PTC cells. Moreover, miR-526b mimics and NC mimics were purchased from Genechem (Shanghai, China) for overexpressing miR-526b in cells. The cells were transfected with lipofectamine 3000 (Invitrogen, USA) following the manufacturer’s protocol. After 48 h of transfection, cells were collected for the following assays.
RT-qPCR
Total RNA from tissue samples and cells was extracted utilizing the TRIzol reagent (Life Technologies, Carlsbad, CA, USA). Subsequently, cDNA was synthesized using a cDNA Synthesis kit (Takara, Otsu, Japan). Next, qPCR was implemented utilizing SYBR Green PCR Master Mix (Takara). Gene expression levels were quantified using the 2−ΔΔCt method and normalized to GAPDH or U6. The primer sequences used in this study are shown in Table 1.
Table 1 Primers used in the studyWestern blot
Total protein from cells was extracted with RIPA lysis buffer (Sigma, USA) and quantified using an enhanced bicinchoninic acid (BCA) Protein Assay Kit (Beyotime, Shanghai, China). Then, an equal amount of protein (30 µg) was loaded and isolated via 12% SDS-PAGE gel and transferred to PVDF membranes (Millipore, USA). The membranes were then blocked with 5% skimmed milk. After washing the membranes with T-BST five times, the membranes were incubated with primary antibodies against RAP2A (#ab173296, 1/1000, AB_2177307, Abcam, USA), anti-BRAF (#ab33899, 1/1000, AB_1641515, Abcam, USA) and anti-β-actin (#ab5694, 0.5 µg/ml, AB_2750915, AB_1641515, Abcam, USA) at 4 °C for one night. The next day, the membranes were washed and incubated with the HRP-conjugated goat anti-rabbit secondary antibody anti-IgG (#ab6721, 1/2000, AB_955447, Abcam, USA) for 1 h. Finally, the ECL chemiluminescent detection reagent (Millipore, USA) was applied to visualize the proteins.
Actinomycin D (Act D) and RNase R assays
For Act D assay, cells were incubated with 2 mg/mL of Act D for 6, 12, 18, and 24 h to block RNA transcription. For the RNase R assay, total RNA was cultured with 3 U/µg RNase R for half an hour at 37℃. After that, RT-qPCR was conducted to assess RNA expression level.
FISH assay
The fluorescent in situ hybridization kit (Thermo Fisher Scientific, USA) was utilized for detecting the subcellular location of circPSD3 in accordance with user guidelines. Cy3-labeled circPSD3 probes were designed and synthesized by Foco (Guangzhou, China). DAPI was used to counterstain the nucleus. The images were obtained through the confocal microscope (Bx53, Olympus, Japan).
CCK-8 assay
A Cell Counting Kit-8 (CCK8; Dojindo, Tokyo, Japan) was utilized for measuring cell viability. 1 × 10⁴ cells per well were seeded in the 96-well plates and cultured for 0, 24, 48, and 72 h. Thereafter, 10 µl of CCK-8 solution was added to each well and the plate was incubated for 2 h. Finally, a microplate reader (Thermo Fisher Scientific, USA) was utilized to detect the absorbance at 450 nm.
EdU assay
An EdU staining Kit (Ribobio, Guangzhou, China) was employed for assessing cell proliferative capability. Briefly, 1 × 10⁴ cells/well were seeded in the 96-well plates for 24 h and then incubated with 10 µM EdU reagent for 2 h. Cell nucleus was dyed with DAPI (Sigma). Images were taken with a fluorescence microscope (AX10 imager A2, Zeiss, Jena, Germany).
Flow cytometry
The FITC-labeled Annexin V (Annexin V-FITC) apoptosis detection kit (BD Biosciences) was used to assess cell apoptosis. In short, 1 × 10⁶ cells were resuspended in 1X binding buffer solution. The cells were subsequently stained with a solution containing Annexin V/FITC (5 µL of FITC Annexin V) and propidium iodide (PI) (5 µL) and incubated at room temperature for 30 min in the dark. Cells were acquired on a flow cytometer (FACS Calibur, BD Biosciences), and data was analyzed with FlowJo software.
Transwell invasion assay
The cell invasion capacity was measured using Transwell chambers with 8 μm pore size (Corning, NY, USA). 1 × 10⁵ cells were inoculated in the upper chamber with serum-free medium, and the chamber was pre-coated with Matrigel, while the lower chamber was filled with 200 µL of complete medium. After 24 h of culture, non-invading cells on the membrane were removed by cotton swabs. The invaded cells were fixed by 4% PFA and dyed with 0.1% crystal violet. The cells were photographed using a microscope (MM-800 N, Nikon, Japan) and counted in five random distinct fields.
Wound healing assay
5 × 10⁴ cells were seeded on the 6-well plates and cultured until confluence reached 80%. A scratch was made using 200 µl pipette tips, and then cells were cultured in a serum-free medium. After 24 h, the images were photographed at 0 h and 24 h with a microscope (MM-800 N, Nikon, Japan), and the wound closure percentage was calculated using five randomly chosen fields.
RNA pulldown assay
Biotin-labeled miR-526b and negative control (Bio-NC) were obtained from GenePharma (China). After transfection with Bio-miR-526b probe or Bio-NC for 2 days, cells were collected and incubated with lysis buffer. Thereafter, the cells were cultured with M280 streptavidin Dynabeads (Invitrogen) for 6 h at 4 °C. The samples were rinsed with buffer and eluted, and then the RNA enrichment was measured through RT-qPCR.
Luciferase reporter assay
The wild type (WT) and mutated (MUT) miR-526b binding sites to circPSD3 or RAP2A 3’UTR were obtained to generate the pmirGLO-circPSD3-WT/MUT and pmirGLO-RAP2A-WT/MUT luciferase vectors (Promega, USA). After co-transfection with vectors and indicated plasmids in cells using the Lipofectamine® 2000 Transfection Reagent (Thermo Fisher Scientific, Inc., USA), the luciferase activities were determined utilizing the Dual-Luciferase Reporter Assay System (Promega).
Tumor xenograft model
BALB/c nude mice (4–6 weeks age) (n = 5 each group) were purchased from Henan Provincial People’s Hospital. Animal experiments were approved by Henan Provincial People’s Hospital. For generating tumor xenograft model, IHH4 cells (1 × 10⁶ cells/200 µl) stably transfected with sh-NC, sh-circPSD3, or sh-circPSD3 + miR-526b mimics, and OE-NC, or OE-BRAF vectors were subcutaneously injected into the back of mice. Tumor volume (mm3) was calculated every five days and calculated as tumor volume = length × width2 × 0.5. After 20 days, mice were anesthetized with 4% isoflurane and euthanized by asphyxiation with CO2, and tumors were removed. Thereafter, tumors were photographed and weighed.
Statistical analysis
Statistical analyses were performed using GraphPad Prism 8 software (GraphPad Software, CA) and presented as mean ± SD of three independent experiments. Data from the two groups were normally distributed, and an independent sample t-test was employed for comparison. For the multivariate comparison, a one-way analysis of variance, followed by Tukey’s post hoc test, was performed. Pearson correlation analysis was used to examine the correlation between RAP2A, miR-526b and circPSD3 and between BRAF and circPSD3. P < 0.05 indicated a statistically significant difference.


Comments (0)