
Remember me
Colorectal cancer (CRC) is one of the most prevalent and deadly cancers worldwide, accounting for approximately 1.9 million new cases and over 900,000 deaths each year (Bray et al., 2024). It ranks as the third most common cancer and the second leading cause of cancer-related mortality globally (Bray et al., 2024). The high mortality rate from CRC is largely driven by metastasis, which occurs in a significant proportion of patients. According to statistics, approximately 20% of patients with newly diagnosed CRC present with synchronous metastases, primarily affecting the liver (Cervantes et al., 2023). Furthermore, up to 50% of patients initially diagnosed with localized disease will develop metastases following treatment of initially localized primary tumor (Cervantes et al., 2023). Despite advancements in treatment, including surgery, chemotherapy, and targeted therapies, achieving long-term survival in metastatic CRC remains a significant challenge (Ciardiello et al., 2022). Therefore, it is crucial to develop not only new treatments for metastatic colorectal cancer but also strategies to prevent recurrence, most of which manifest as distant metastases (Haria et al., 2021).
In clinical practice, the assessment of colorectal cancer recurrence risk and therapy selection relies on well-established markers such as TNM staging, MSI status, and mutations in KRAS, NRAS, and BRAF, which are routinely used to guide treatment decisions (Koncina et al., 2020). In addition, emerging gene expression signatures, such as the Oncotype DX Colon and Consensus Molecular Subtypes (CMS), are being integrated into clinical settings to personalize therapy, predict recurrence, and optimize patient outcomes (Ahluwalia et al., 2021). Current molecular biomarkers, such as mutations and expression signatures, mainly reflect the biological characteristics of tumors rather than their sensitivity to therapy. While some of them are useful for guiding targeted and immunotherapy, neither molecular nor clinical markers available today can reliably predict responses to chemotherapy. As chemotherapy remains a cornerstone of colorectal cancer treatment, the limitations of existing biomarkers underscore the need for developing new tools to enhance personalized treatment strategies.
There has been growing interest in testing chemotherapeutic and targeted agents directly on CRC organoids, which accurately replicate the histological and molecular characteristics of the original tumors (van de Wetering et al., 2015; Su et al., 2023). This method offers a personalized approach by allowing precise evaluations of how individual tumors respond to specific drugs, potentially improving treatment outcomes through tailored therapies based on each patient’s unique cancer profile. Currently, this approach is primarily applied to metastatic cancer, where it is easier to compare in vitro results with clinical responses (Ooft et al., 2019; Narasimhan et al., 2020; Tan et al., 2023). However, the method has several limitations, including high costs, labor-intensive processes, and challenges in successfully establishing organoid cultures. Furthermore, clinical validation remains limited.
An intriguing alternative is to combine molecular and culturing approaches: identifying drug sensitivity markers from a small set of organoid cultures and applying these markers directly to tumor tissues. This method eliminates the need for extensive organoid culture, making the process faster and more cost-effective. Notably, this combined approach has already been successfully implemented for pancreatic cancer (Tiriac et al., 2018), gastric cancer (Vistoso Monreal et al., 2024) and biliary tract cancer (Ren et al., 2023).
In this study, we expanded our collection of CRC organoids to identify correlations between gene expression and IC50 values for three commonly used CRC drugs: 5-fluorouracil (5-FU), oxaliplatin, and SN-38 (the active metabolite of irinotecan). To ensure robust results, we integrated our organoid data with publicly available data on CRC cell lines, thus bridging two distinct in vitro models currently available for cancer research and validating the results of each experiment. As a result, we identified genes whose expression consistently correlates with the response to standard chemotherapeutic drugs. These genes could serve as potential new targets to overcome drug resistance and warrant further investigation. Additionally, using publicly available transcriptomic datasets, we demonstrated that some of these genes possess prognostic value for both early- and late-stage CRC. Gene expression signatures based on these identified genes were shown to effectively predict patient outcomes, underscoring their potential for further translational research. A general flow chart of this study is presented in Supplementary Figure S1.
2 Materials and methods2.1 Primary patient material and organoid cultureIn this work 4 new cultures of colorectal cancer patient-derived organoids (CRC PDOs) were established from resected metastatic tissue as described previously (Nikulin et al., 2020; Poloznikov et al., 2021). Initial material was obtained from 3 distinct patients P4, P5 and P6 and 2 different metastases from P6 were used for two CRC PDOs P6(1) and P6(2). The generation of CRC PDOs P1, P2 and P3 was described previously (Poloznikov et al., 2021). The main clinical parameters of the patients included in the study are summarized in Supplementary Table S1. The study was approved by the local ethics committee.
The tissue sample was obtained during the examination of the surgically resected tissue block by a qualified pathologist who identified the resected tissue as a metastasis. Tissue was cut into small fragments and placed immediately into MACS tissue storage solution (Miltenyi Biotec, Germany). The sample was stored for several hours at 4°C. Then, the tissue fragments were transferred into a tube for tissue homogenization (gentleMACS C Tube, Miltenyi Biotec, Germany), and dissociated with gentleMACS Octo Dissociator (Miltenyi Biotec, Germany) according to the manufacturer’s instructions. After the end of the program, the resulting suspension was centrifuged at 300 g for 10 min. The supernatant was removed, and the pellet was resuspended in 10 mL of DPBS (Thermo Fisher Scientific, United States of America). Then, the suspension was recentrifuged with the same parameters, the supernatant was also removed, and the pellet was resuspended in DMEM/F-12 culture medium (Thermo Fisher Scientific, United States of America). Then, the tube with the suspension was placed on ice, and the suspension was mixed with Matrigel Growth Factor Reduced (GFR) Basement Membrane Matrix (Corning, United States of America) in the ratio 1:2. Then, 50 μL drops of the resulting suspension in the extracellular matrix were transferred into the wells of a 24-well culture plate (TPP, Switzerland) and placed into a cell culture incubator (37°C, 5% CO2) for 20 min for solidification of the gel. Then, 750 μL of complete cell culture medium was added to each well, and the plate was incubated in a cell culture incubator. The recipe of the complete cell culture medium for CRC organoids was described earlier (Poloznikov et al., 2021). The cell culture medium was replaced every 48 h. Cells were inspected visually by an inverted Axio Observer Z1 microscope (Carl Zeiss, Germany). Organoids were subcultured (1:5 dilution) every 2 weeks with the help of TrypLE Express (Thermo Fisher Scientific, United States of America).
2.2 HistologyFragments of the original tumor tissue were fixed in 10% neutral buffered formalin (overnight at room temperature) and embedded into paraffin. Formalin-fixed samples of tumor organoids were covered with Histogel (Thermo Fisher Scientific, United States of America) and then embedded into paraffin. Serial sections with a thickness of 4 μm were cut and then were routinely stained with hematoxylin-eosin and examined by light microscopy.
2.3 Drug testOrganoids were diluted in Matrigel GFR Basement Membrane Matrix (Corning, United States of America) and seeded into 96-well plates (TPP, Switzerland) (50 organoids per well). After solidification of the gel, 100 ul of complete cell culture medium was added into each well. After 24 h, the organoid culture medium was replaced with the control medium or the medium containing single standard-of-care (SoC) drugs. Stock solutions of 5-FU and SN-38 were prepared in DMSO; stock solution of Oxaliplatin was prepared in water (Hall et al., 2014). Then CRC organoids were incubated in a cell culture incubator (37°C, 5% CO2) for 72 h, and the relative number of viable cells was measured with MTS assay (Promega, United States of America). Each experiment was performed in triplicates. An R package “drc” was used to fit dose-response curves and to determine the half-maximal inhibitory concentration IC50 (Ritz et al., 2015). To confirm the data on sensitivity and resistance, a separate experiment was additionally conducted on two organoid cultures P1 and P3. The size changes of the obtained organoids under conditions similar to the MTS test were assessed using microphotographs obtained by an inverted microscope PrimoVert (Carl Zeiss, Germany).
2.4 RNA sequencingOrganoids were lysed with the QIAzol Lysis Reagent (Qiagen, Germany). The lysates were stored at −80°C before RNA isolation. RNA isolation was performed using miRNeasy Micro Kit (Qiagen, Germany) according to the manufacturer’s protocol. Nanodrop ND-1000 (Thermo Fisher Scientific, United States of America) was used to assess the quantity and purity of the extracted RNA. Total RNA samples were also QC-checked using an Agilent 2100 Bioanalyzer (Agilent Technologies, United States of America). For each CRC PDO, three independently obtained samples of RNA were used.
Libraries for mRNA sequencing were prepared from total RNA samples using the Illumina Stranded mRNA Library Prep Kit (Illumina, United States of America). Each sample was sequenced on the NextSeq 550 (Illumina, United States of America) to generate paired-end 75-nucleotide reads.
The quality of FASTQ files was assessed with FastQC v0.11.9 (Babraham Bioinformatics, United Kingdom) and multiQC v1.9 (Ewels et al., 2016). The adapters were trimmed with fastp 0.21.1 (Chen et al., 2018). The trimmed mRNA-seq reads were mapped on the reference human genome GENCODE release 37 (GENCODE GRCh38. primary assembly) with STAR 2.7.7a (Dobin et al., 2013). GENCODE release 37 genome annotation (gencode.v37. primary assembly. annotation) (Frankish et al., 2019) was used to generate the count matrix with the featureCount tool from ssubread-2.0.1 aligner (Liao et al., 2013; 2014).
RNA-seq data generated in this study were deposited into the Gene Expression Omnibus database under accession GSE251958 (https://www.ncbi.nlm.nih.gov/geo/query/acc.cgi?acc=GSE251958).
2.5 Gene expression and correlation analysisThis study utilized data on the sensitivity of colorectal cancer cell lines and organoids to SoC chemotherapeutic drugs, as well as RNA expression data. The analysis of cell lines was based on publicly available data from the Genomics of Drug Sensitivity in Cancer (GDSC) (Yang et al., 2012) and the Cancer Cell Line Encyclopedia (CCLE) (Barretina et al., 2012). Sensitivity data for the cell lines to SoC drugs were available across several datasets. For 5-FU, both GDSC1 and GDSC2 datasets were used. Oxaliplatin sensitivity data came from two independent repeats within the GDSC2 dataset, labeled GDSC2 and GDSC2_2. SN-38 data was only available in the GDSC1 dataset. All cell line data were downloaded from the DepMap portal https://depmap.org/portal (Tsherniak et al., 2017).
Gene expression analysis was performed using DESeq2 v1.28.1 (Love et al., 2014). A regularized logarithm transformation of the count data was applied before conducting correlation analysis (Love et al., 2014). Spearman correlation coefficients were calculated for all genes in relation to the IC50 values of each chemotherapeutic drug. Correlations were considered significant if the absolute value of the Spearman correlation coefficient exceeded 0.3 and the p-value was less than 0.05. The threshold for the Spearman correlation coefficient was selected based on prior studies (Shee et al., 2019; Ioannidis et al., 2020) and the understanding that drug response is a complex and multifactorial biological process. In this context, the influence of any single gene is inherently limited. Thus, even modest correlations with a Spearman coefficient of ±0.3 are considered meaningful, particularly when they are reproducible across independent datasets.
An intersection analysis was subsequently conducted to identify genes with significant co-directional correlations across the available datasets (GDSC1, GDSC2, and ORGANOIDS). This resulted in a subset of genes consistently correlated across all datasets.
2.6 Pathway analysisFollowing the intersection analysis, genes common across all tested datasets were selected for further investigation. For each drug, a list of genes was compiled and categorized based on the direction of their correlation. This gene list was then used as the basis for pathway enrichment analysis.
The enrichment analysis focused on signaling pathways, using an overrepresentation approach. This was performed with the “enrichPathway” function from the ReactomePA package, applying the default settings (Yu and He, 2016).
2.7 Construction of the gene expression classifierWe used the subset of genes consistently correlated across all datasets to develop prognostic classifiers for both metastatic and non-metastatic colorectal cancer. For late-stage metastatic CRC, our goal was to predict overall survival (OS) status within 5 years, while for early-stage non-metastatic CRC, we aimed to predict relapse-free survival (RFS) status.
For metastatic CRC, we utilized the publicly available dataset GSE159216 from the Gene Expression Omnibus (GEO) (Eide et al., 2021; Moosavi et al., 2021). This dataset contains transcriptomic profiles from metastatic liver tissue of 171 CRC patients. Patients who died within 5 years were categorized as having an unfavorable prognosis, while a favorable prognosis was assigned only if the follow-up period was at least 5 years and the patient was alive. A subset of patients with available prognostic information was split into training (112 patients) and testing (47 patients) datasets. For non-metastatic CRC we used data from the GSE39582 dataset (Marisa et al., 2013). Initially, we selected only the patients who had II or III stage of the disease and who were treated with chemotherapy. This filter resulted in the whole treated patient dataset with 210 patients. Then we defined the status of the patients as favorable in case of absence of relapse and time of follow-up more or equal to 5 years and unfavorable in case of developing of relapse within 5 years. The subset of patients with available prognostic status was split to construct train (112 patients) and test (47 patients) datasets. We also evaluated the performance of the best constructed classifier on a group of untreated patients at the same disease stages from the same dataset. The microarray data were normalized using the Robust Multiarray Average (RMA) method, implemented in the “affy” package in R (Gautier et al., 2004).
The classifier constructed for Stage II/III CRC patients was further validated using the mRNA-seq dataset E-MTAB-12862 from ArrayExpress, with a training cohort of 441 patients and a testing cohort of 189 patients (Nunes et al., 2024). Raw count data derived from STAR alignment were normalized using the trimmed mean of M values (TMM) method followed by log-transformed counts per million (logCPM), as implemented in the “edgeR” package (Robinson et al., 2010; McCarthy et al., 2012; Chen et al., 2016).
To construct gene expression-based classifiers, we employed a sequential algorithm using logistic regression, implemented with the “glm” function in R. The classifiers were trained exclusively on the training datasets. Initially, models were built using a single gene from the list of consistently correlated genes, with additional genes added stepwise, up to a total of 12 genes. At each step, models were retained if the newly added gene was at least marginally significant (p-value <0.15) and all other genes were significant (p-value <0.05). Additionally, we conducted repeated 3-fold cross-validation at each step, selecting the top 50% of models based on average ROC-AUC values.
Survival analysis for groups predicted by the best classifier (with a threshold set at 0.5) was performed using the Kaplan-Meier method and log-rank test. To assess whether the gene expression-based model served as an independent prognostic factor when accounting for other clinically relevant variables, we used a multivariate Cox proportional hazards model. All analyses were conducted in R using the “survival” and “survminer” packages.
2.8 Analysis of biological mechanisms underlying prognostic classificationsTo investigate the differences in molecular pathways and immune response-related pathways between favorable and unfavorable prognosis groups in CRC at Stages II-III and IV, we employed the clusterProfiler package along with the KEGG (Kyoto Encyclopedia of Genes and Genomes) and GO (Gene Ontology) databases (Ashburner et al., 2000; Kanehisa and Goto, 2000; Yu et al., 2012). Differentially expressed genes were identified using the “limma” package, and enrichment analyses for KEGG pathways and GO biological processes were performed with a significance threshold of an adjusted p-value <0.05 (Ritchie et al., 2015).
To examine immune and stromal differences between prognosis groups, the ESTIMATE algorithm was applied (Yoshihara et al., 2013). Preprocessed and normalized gene expression data were used to calculate immune and stromal scores, as well as tumor purity estimates. A two-sample t-test was conducted to evaluate the statistical significance of score differences between prognosis groups.
For detailed immune cell population analysis, the xCell algorithm was utilized (Aran et al., 2017). Normalized gene expression data were input into xCell to estimate the relative abundances of various immune and stromal cell types. Differences in cell type proportions between prognosis groups were assessed using a t-test, with adjusted p-values calculated via the Benjamini–Hochberg (BH) method to account for multiple comparisons. Results were visualized using boxplots, displaying the distribution of each cell type stratified by prognosis group, providing insights into the immune microenvironment of CRC in relation to patient outcomes.
3 Results3.1 Morphological similarities between patient-derived tumor organoids and corresponding clinical tumorsPatient-derived colorectal cancer organoids (CRC PDOs) were generated from digested tumor tissue, embedded in Matrigel, and cultured for up to 3 weeks without passaging. After subculturing, significant cell growth was observed as early as the second day post-seeding. To verify that the organoids consisted of colorectal cancer cells rather than normal epithelial cells, H&E histological analysis was performed on the established CRC PDOs. An experienced pathologist compared the morphology of the organoids to that of the primary tumors, confirming that all organoid cultures were composed of malignant cells (Figure 1; Supplementary Figure S2).
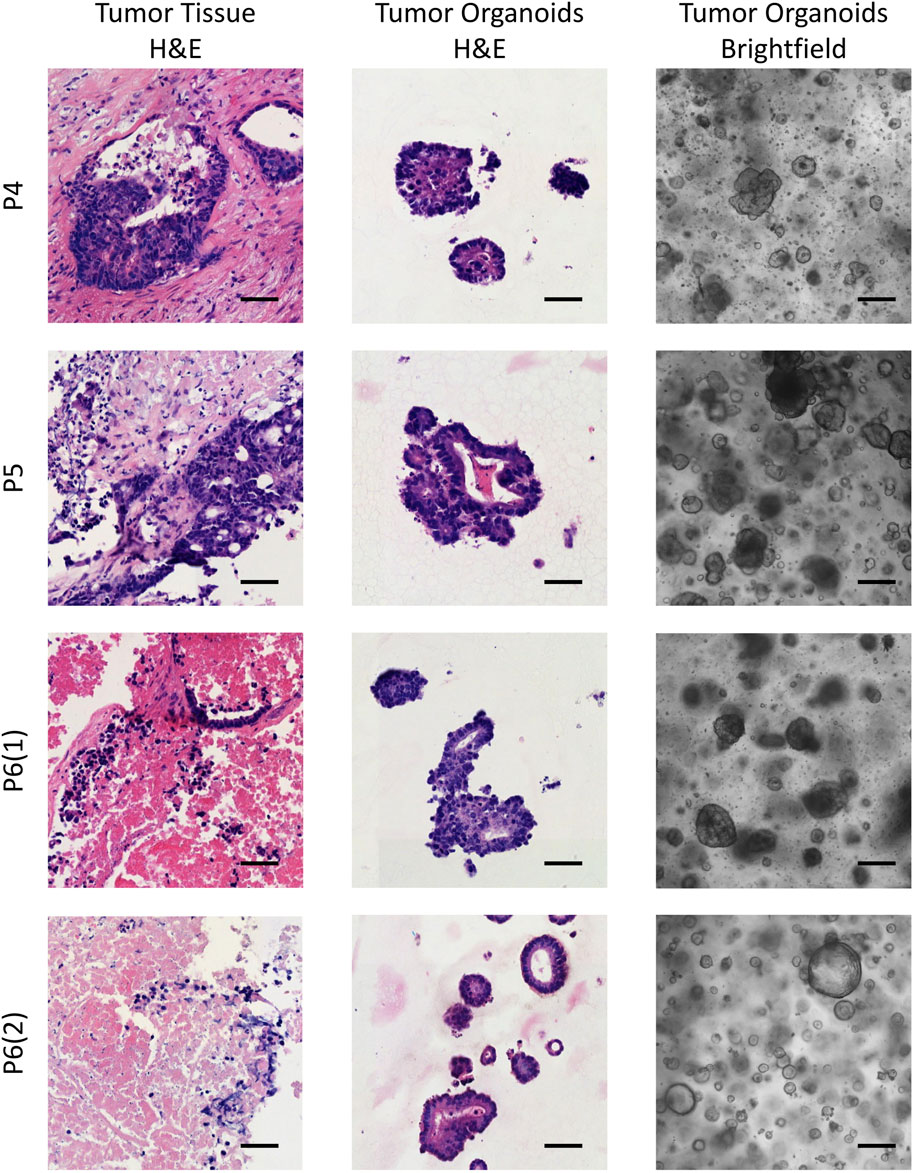
Figure 1. Brightfield images of the established CRC PDOs alongside comparative histological analysis of H&E-stained slides from the initial tissue and organoids. P4–P6 refers to patient numbers. Scale bars represent 200 μm in the brightfield images and 50 μm in the H&E images.
3.2 Response of CRC patient-derived organoids (PDOs) to standard-of-care chemotherapeutic drugsOur results revealed that the response to standard chemotherapeutic drugs varied significantly across the tumor organoid cultures (Figure 2). Organoids from patients P1 and P4 exhibited the highest resistance to 5-FU, with IC50 values of 313 µM and 984 μM, respectively, which were 6 and 20 times higher than the average IC50 values for other patients. For oxaliplatin, organoids from patients P3, P4, and P5 showed the greatest resistance, with IC50 values ranging from 190 to 440 μM, compared to 20–70 µM for other patients. Interestingly, organoids from P3 and P4 also displayed the highest resistance to SN-38, although the variation in SN-38 sensitivity across organoids was less pronounced compared to the other drugs. These viability assays allowed us to identify organoid cultures with differing levels of sensitivity and resistance, highlighting potential variations in drug responsiveness among patients. The results of the drug sensitivity and resistance tests were further validated through micrographs of the two organoid cultures, P1 and P3, taken after 72-h treatment with the drugs, as well as under control conditions (Supplementary Figure S3). These visual observations confirmed that P1 exhibited greater resistance to 5-FU compared to P3, while P3 showed higher resistance to Oxaliplatin and SN-38 compared to P1. These findings were fully consistent with the results obtained from the MTS assay, further supporting the robustness of our observations.
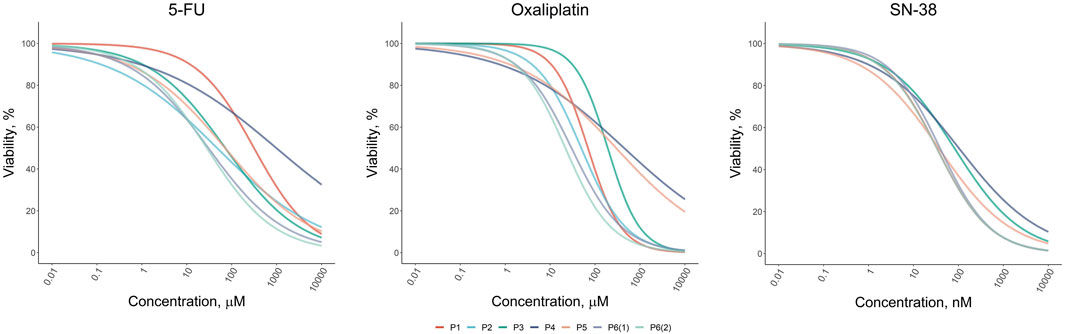
Figure 2. Dose-response results of the drug test for standard-of-care drugs (5-FU, Oxaliplatin, and SN-38) on colorectal cancer organoids derived from patients P1–P6.
3.3 Correlation analysis of gene expression with resistance to standard-of-care drugsCorrelational analysis of gene expression and IC50 values for established CRC PDOs and CRC cell lines from publicly available datasets (GDSC1, GDSC2, GDSC2_2) revealed a large number of genes whose expression was positively or negatively correlated with sensitivity to standard chemotherapy drugs (Figure 3). The number of genes significantly correlated with drug sensitivity in a single direction for one dataset ranged from a few hundred to nearly two thousand. Notably, the reproducibility of the correlations between the CRC cell line datasets was moderate. Furthermore, the number of genes consistently correlated with drug sensitivity across both CRC cell lines and organoids was very limited. For 5-FU, a total of 91 genes were consistently correlated (50 positively and 41 negatively), while for oxaliplatin, only 53 genes were identified (20 positively and 33 negatively). Interestingly, SN-38 had the smallest number of consistently correlated genes across datasets, with 23 genes showing positive correlations and 5 showing negative correlations; however, this analysis involved only two datasets (ORGANOIDS and GDSC1). The complete list of intersecting genes is provided in the Supplementary Tables S2–S4. Selected genes associated with resistance to standard chemotherapy will be discussed in detail in the Discussion section.
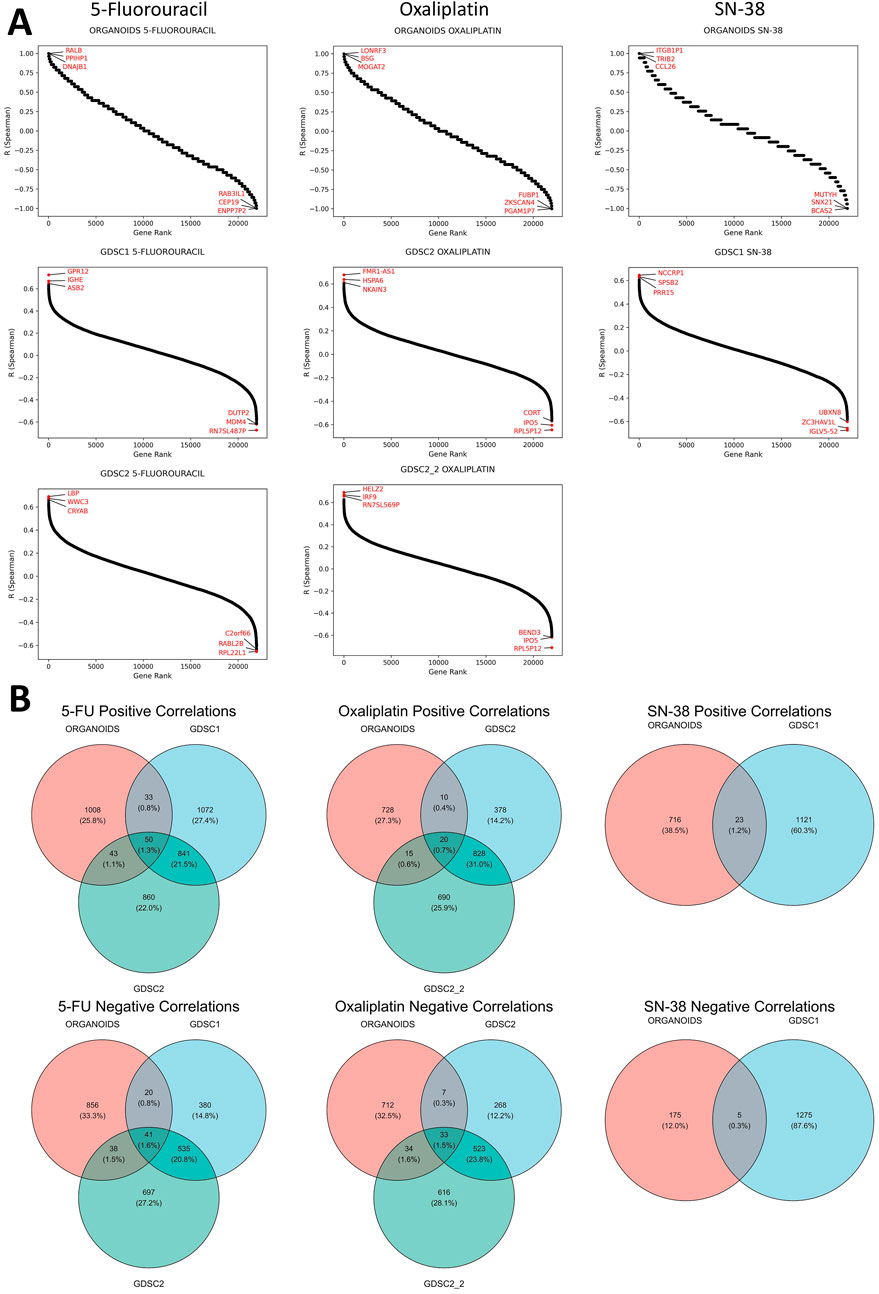
Figure 3. Results of the correlational analysis between gene expression levels and IC50 values in established CRC patient-derived organoids and cell lines. (A) Ranked Spearman correlation coefficients displaying the relationship between gene expression levels and IC50 values of standard-of-care drugs across different datasets, with genes showing the highest correlation coefficients marked in the plots. (B) Venn diagrams showing the overlap of significantly correlated genes for each SOC drug across the different datasets.
We also aimed to identify genes whose expression correlated with sensitivity to more than one SoC drug. The analysis revealed that the number of such genes was extremely limited, with no genes found in the triple intersection of the Venn diagrams for all three SoC drugs (Supplementary Figure S4). Furthermore, no genes showed significant correlations in opposite directions for any pair of tested SoC drugs, indicating no contradictory findings regarding chemotherapy sensitivity (Supplementary Figure S5). However, common genes were identified between 5-FU and oxaliplatin: one gene (AVPI1) showed a positive correlation, while four genes (DHX33, LYRM2, RANGRF, WRAP53) exhibited negative correlations with IC50 values for both drugs across all datasets. These genes will be discussed in detail in the Discussion section.
3.4 Pathway analysisSeveral significantly enriched pathways were identified based on genes whose expression consistently correlated with drug sensitivity (Supplementary Table S5). For 5-FU, the pathways “Iron Uptake and Transport” and “Transferrin Endocytosis and Recycling” were activated in more resistant cells. In oxaliplatin-resistant cells, pathways such as “Rab Regulation of Trafficking” and “RAB GEFs exchange GTP for GDP on RABs” were identified. In contrast, oxaliplatin-sensitive cells showed activation of pathways like “Transport of Mature mRNA derived from an Intron-Containing Transcript”, “Transport of Mature Transcript to Cytoplasm”, and “Processing of Capped Intron-Containing Pre-mRNA”, indicating enhanced nuclear pore complex transport. In SN-38-sensitive cells, pathways associated with taste receptors, which belong to the GPCR transmembrane protein superfamily, were activated. These pathways include “Sensory Perception of Taste”, “Sensory Perception of Sweet, Bitter, and Umami (Glutamate) Taste”, and “GPCR Ligand Binding”. The role of some of these pathways in cancer progression will be further explored in the Discussion section.
3.5 Predictive 12-gene classifier assessing overall survival of patients with metastatic CRCUsing genes whose expression is consistently associated with resistance to the three tested standard-of-care drugs, we developed a series of classifiers to predict OS status in patients with metastatic Stage IV colorectal cancer. Gene expression data from liver metastasis samples (GSE159216) were used, with the dataset split into training and test sets. Classifiers were constructed using logistic regression models incorporating 12 genes, with over 6 million classifiers generated based on various gene combinations. All classifiers were trained and cross-validated on the training dataset, and their performance was subsequently evaluated on the test dataset. To identify the most stable classifier, we selected models with ROC-AUC values exceeding 0.85 on both training and test datasets, and the best classifier was chosen based on the highest ROC-AUC value achieved during cross-validation. This approach allows for the identification of a stable gene expression signature most suitable for further validation. A list of genes and model coefficients for the optimal signature is provided in the Supplementary Table S6, with select genes discussed in the Discussion section.
The best classifier achieved an AUC of 0.94 on the training dataset and 0.87 on the test dataset (Figure 4A). Kaplan-Meier analysis for the training, test, and complete datasets (the latter also includes patients with uncertain status) demonstrated a significantly better overall survival for patients predicted to have a favorable OS status (log-rank p < 0.0001). Approximately two-thirds of metastatic CRC patients were classified as having an unfavorable prognosis, with only one-third predicted to have a favorable prognosis. The 5-year survival rate for patients with a favorable prognosis exceeded 75%, which is uncommon in metastatic CRC.
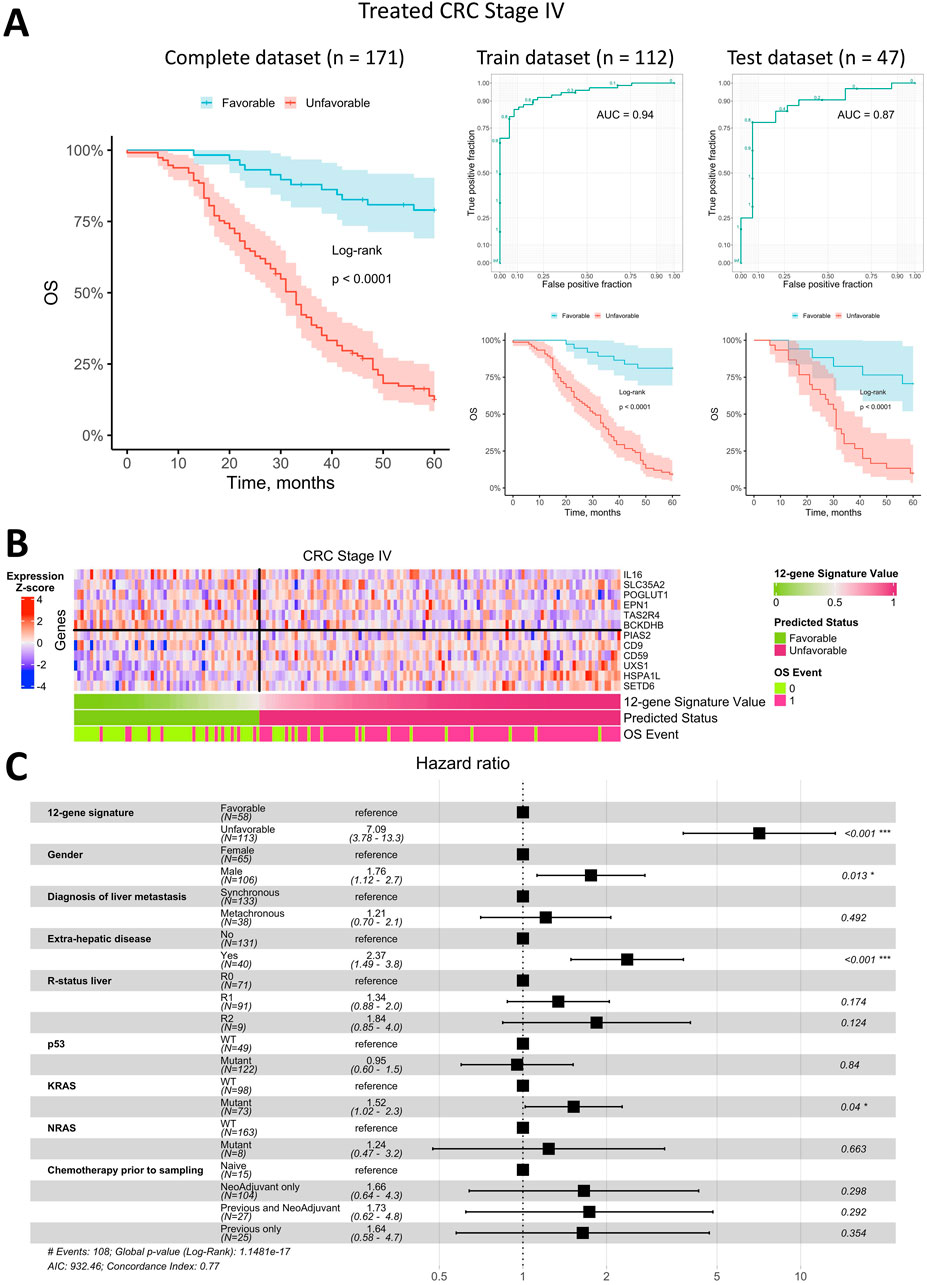
Figure 4. Prediction of overall survival for patients with metastatic Stage IV CRC using a 12-gene expression signature. (A) Kaplan-Meier plots for the training, test, and complete (including censored data) datasets, along with ROC curves for the training and test datasets. (B) Heatmap of gene expression in metastatic tumor tissue for genes included in the 12-gene signature, with classifier predictions and actual OS status included. (C) Forest plot displaying the results of a multivariate Cox regression model, identifying potential risk factors for overall survival in patients with metastatic Stage IV CRC.
The heatmap of gene expression for the 12-gene signature (Figure 4B) indicates that robust OS status prediction cannot rely on any single gene alone, despite trends of higher or lower expression in metastatic tissue samples from patients with differing prognoses. However, the combined expression of these genes produced a highly robust classifier with a low error rate.
To assess whether the OS status predicted by the 12-gene expression signature was an independent prognostic factor, we performed a Cox multivariate analysis alongside available clinical parameters and visualized the results in a forest plot (Figure 4C). The predicted OS status was confirmed as an independent prognostic factor, exhibiting the highest HR of 7.1 (95% CI: 3.8–13.3). The next strongest independent factors were the presence of extrahepatic metastases (HR = 2.4, 95% CI 1.5–3.8), gender (HR = 1.8, 95% CI 1.1–2.7), and KRAS mutations (HR = 1.5, 95% CI 1.0–2.3). All other factors were insignificant in the multivariate analysis.
3.6 Predictive 12-gene classifier assessing relapse-free survival of patients with stage II/III CRCSimilar to metastatic Stage IV CRC, we searched classifiers based on genes whose expression is consistently associated with resistance to the three standard-of-care drugs in non-metastatic Stage II/III CRC, to predict RFS status. For this analysis, we used the publicly available dataset GSE39582, which includes gene expression data from primary colorectal tumors. We first focused on patients treated with adjuvant chemotherapy, as our genes of interest relate to response to SoC chemotherapy. The dataset was split into training and test sets. We included 12 genes in the classifiers, as in the metastatic CRC analysis, and generated approximately 123,000 classifiers in total—a much smaller number than for metastatic CRC. For Stage II/III CRC, no classifiers reached a ROC-AUC value over 0.85 on both training and test datasets, so we lowered the threshold to 0.75. As with metastatic CRC, the best classifier was selected based on the highest ROC-AUC value obtained during cross-validation. This optimal classifier was then tested on patients who had not received adjuvant chemotherapy. The genes and coefficients for the best gene expression signature for Stage II/III CRC are available in Supplementary Table S7, with selected genes discussed in the Discussion section.
Overall, the best classifier’s AUC for treated Stage II/III CRC was lower than for metastatic CRC, at 0.92 on the training dataset and 0.76 on the test dataset (Figure 5A). Kaplan-Meier analysis of the training, test, and complete datasets (the latter includes patients with uncertain status) for Stage II/III CRC patients treated with adjuvant chemotherapy indicated a significantly better prognosis for patients predicted to have a favorable RFS status (log-rank p < 0.0001 for training and complete datasets; log-rank p = 0.004 for the test dataset). Approximately 56% of treated Stage II/III CRC patients were classified as having a favorable prognosis, while 44% were classified as unfavorable. Notably, the 5-year survival rate for patients with an unfavorable prognosis was approximately 35%, which is notably low for early-stage CRC.
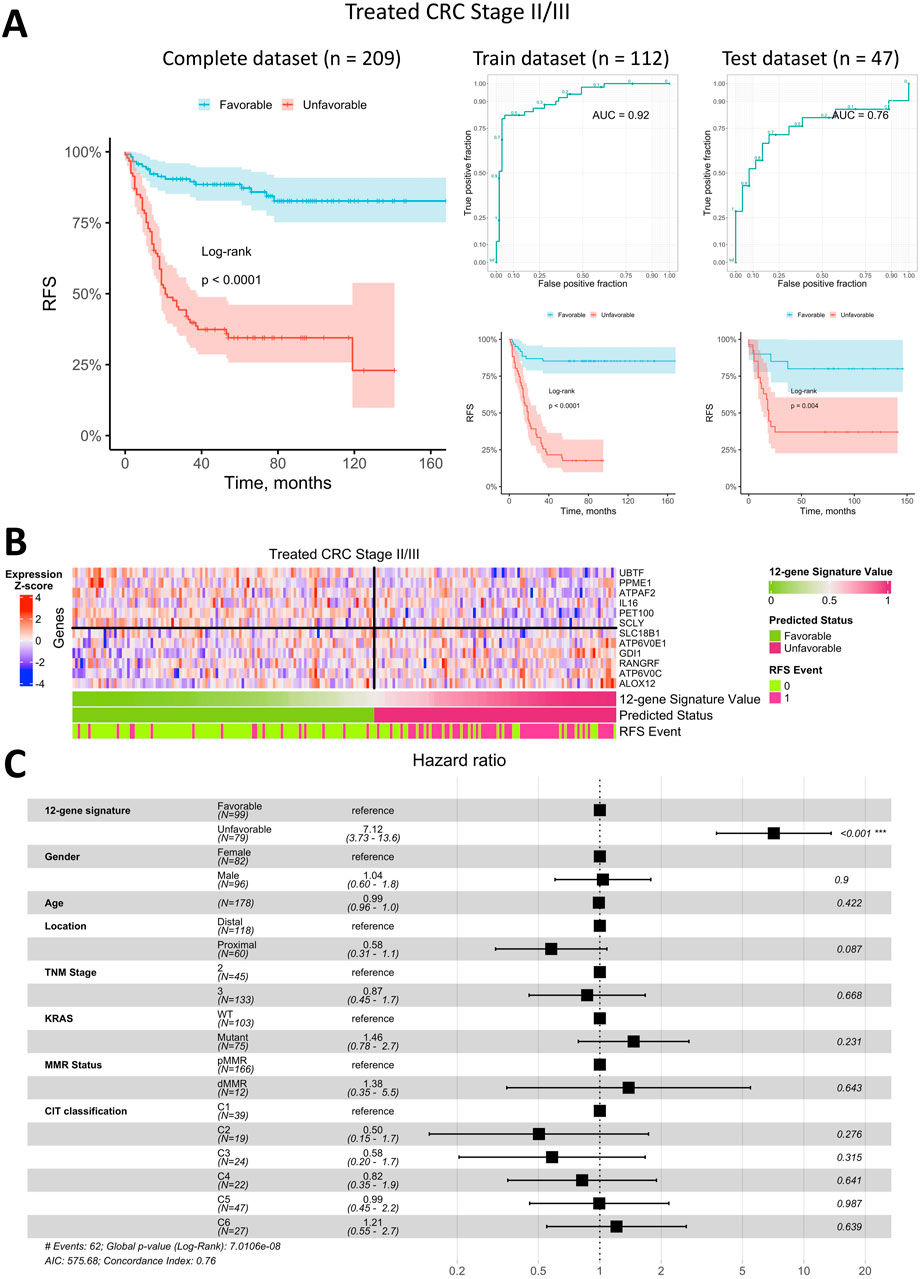
Figure 5. Prediction of relapse-free survival for Stage II/III CRC patients treated with adjuvant chemotherapy using a 12-gene expression signature. (A) Kaplan-Meier plots for the training, test, and complete (including censored data) datasets, alongside ROC curves for the training and test datasets. (B) Heatmap of gene expression in primary tumor tissue for genes in the 12-gene signature, including classifier predictions and actual RFS status. (C) Forest plot showing results of a multivariate Cox regression model, identifying potential risk factors for RFS in Stage II/III CRC patients treated with adjuvant chemotherapy.
The heatmap of gene expression for the 12-gene signature (Figure 5B) demonstrates that robust RFS status prediction in Stage II/III CRC patients treated with adjuvant chemotherapy cannot rely on any single gene alone, though some genes showed distinct expression trends in primary tumor samples from patients with different prognoses. However, the classifier combining all 12 genes was robust, with a low error rate similar to that observed in metastatic CRC.
To assess whether the predicted RFS status based on the 12-gene expression signature is an independent prognostic factor, we performed a Cox multivariate analysis incorporating available clinical parameters and visualized the results in a forest plot (Figure 5C). This analysis indicated that the predicted status was the only independent prognostic factor with HR of 7.1 (95% CI 3.7–13.6). All other factors, including the TNM stage and molecular CIT subtype (Marisa et al., 2013), were found to be insignificant in the multivariate analysis.
We next evaluated whether the best classifier, developed using data from Stage II/III CRC patients treated with adjuvant chemotherapy, could predict RFS status in patients who did not receive adjuvant chemotherapy. Kaplan-Meier analysis (Figure 6A) indicated that patients with a predicted favorable prognosis had a higher RFS rate (log-rank p = 0.013). However, the survival difference between patients with favorable and unfavorable prognoses was notably smaller than that observed in the adjuvant-treated group. Among Stage II/III CRC patients untreated with adjuvant chemotherapy, approximately 59% were classified as having a favorable prognosis, and 41% as unfavorable, which is comparable to the distribution seen in the adjuvant-treated cohort. Additional validation was conducted using the RNA-seq dataset of Stage II/III CRC patients (Nunes et al., 2024). Kaplan-Meier analysis (Supplementary Figure S6) revealed that patients with a predicted favorable prognosis had a relapse-free survival rate exceeding 75%, compared to less than 50% in patients with an unfavorable prognosis (log-rank p = 0.003 in the training dataset and log-rank p = 0.049 in the test dataset). These findings further support the classifier’s robustness and its ability to reliably distinguish between favorable and unfavorable prognosis groups across independent datasets.
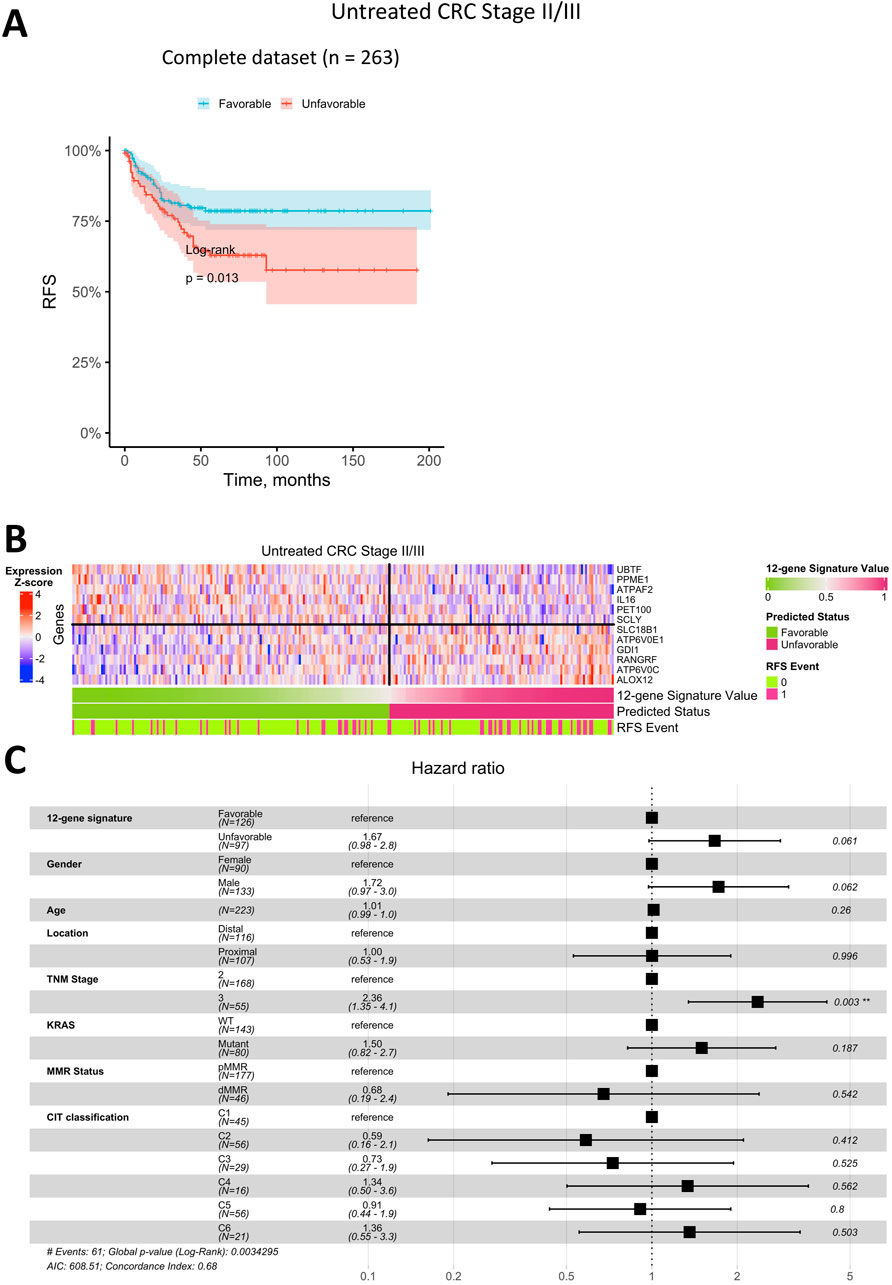
Figure 6. Prediction of relapse-free survival for Stage II/III CRC patients untreated with adjuvant chemotherapy using a 12-gene expression signature. (A) Kaplan-Meier plot for the complete (including censored data) dataset. (B) Heatmap of gene expression in primary tumor tissue for genes in the 12-gene signature, including classifier predictions and actual RFS status. (C) Forest plot showing results of a multivariate Cox regression model, identifying potential risk factors for RFS in Stage II/III CRC patients untreated with adjuvant chemotherapy.
Similar to the treated cohort, the heatmap of gene expression for the 12-gene signature in untreated patients (Figure 6B) demonstrated that robust RFS prediction would not be feasible based on the expression of a single gene. Although certain genes exhibited clear expression patterns associated with prognosis, the combined 12-gene classifier was not as robust, showing a higher error rate in this group.
In Cox multivariate analysis of clinical parameters for untreated Stage II/III CRC patients (Figure 6C), the RFS status predicted by the 12-gene signature was not an independent prognostic factor (p > 0.05). In this group, the only significant independent prognostic factor was TNM Stage, with HR of 2.4 (95% CI 1.4–4.1).
3.7 Analysis of biological mechanisms underlying prognostic classificationsTo elucidate the biological mechanisms underlying prognostic classifications, we examined differences in molecular pathways, immune response-related pathways, immune scores, stromal scores, and immune cell proportions between favorable and unfavorable prognosis groups. This comprehensive analysis was performed across both early (Stages II/III) and late (Stage IV) stages of CRC to provide a detailed understanding of the factors contributing to patient outcomes.
In Stages II-III, KEGG pathway enrichment analysis revealed significant activation of pathways associated with oxidative phosphorylation, thermogenesis, and extracellular matrix (ECM) organization in the unfavorable prognosis group (Supplementary Table S8). These findings emphasize the pivotal role of enhanced mitochondrial activity and ECM remodeling, both of which are integral to tumor growth and localized invasion. Supporting this, GO analysis highlighted mitochondrial respiratory chain complex assembly and ECM structural organization as key biological processes driving these outcomes (Supplementary Table S9). Together, these results underscore the critical influence of metabolic activity and ECM dynamics in determining the prognosis of early-stage CRC.
In Stage IV tumors, KEGG pathway enrichment analysis identified significant activation of immune-related pathways and pathways associated with cellular stress and proliferation in the unfavorable prognosis group (Supplementary Table S10). Notably, pathways related to infection, such as Salmonella infection, were enriched, potentially indicating a link to immune responses or inflammation within the tumor microenvironment. Additional enriched pathways included those involved in cell cycle regulation and apoptosis, aligning with the high proliferative and adaptive capacity that characterizes metastatic cancer (Supplementary Table S11). These findings highlight the complex interplay between immune dynamics, cellular stress, and proliferation in shaping the outcomes of advanced-stage CRC.
In Stages II-III, patients with a favorable prognosis exhibited significantly lower immune (p = 4.6E-02) and stromal scores (p = 2.5E-05) compared to those with an unfavorable prognosis, reflecting a tumor microenvironment with reduced immune infiltration (Supplementary Figure S7). Higher tumor purity was also observed in favorable prognosis cases (p = 4.0E-04), suggesting a less complex and potentially less immunologically active tumor microenvironment. ESTIMATE scores further supported these findings, showing significant differences between prognosis groups (p = 6.4E-04).
Conversely, in Stage IV tumors, no significant differences in immune, stromal, or ESTIMATE scores were observed between the favorable and unfavorable prognosis groups (Supplementary Figure S8). This indicates that the tumor microenvironment in metastatic CRC is consistently immune-enriched, regardless of prognosis.
Immune cell composition analysis showed minimal variations specific to disease stages. In Stages II-III, no significant differences in the proportions of individual immune cell types were identified between prognosis groups (adjusted p-value ≥0.05), suggesting that the differences in the tumor microenvironment are systemic rather than cell-type specific (Supplementary Table S12; Supplementary Figures S9A, 9B). However, the significant differences in overall immune and stromal scores underscore broader changes in the immune landscape between prognosis groups in this case.
In Stage IV tumors, immune cell composition remained consistent across prognosis groups, with no significant differences identified (adjusted p-value ≥0.05) (Supplementary Table S13; Supplementary Figures S10A, 10B). These findings suggest that the immune cell profile in metastatic CRC is stable and does not vary significantly with prognosis.
4 DiscussionThe treatment of metastatic colorectal cancer remains a significant challenge (Ciardiello et al., 2022). Therefore, developing new therapeutic options for metastatic CRC, along with strategies to prevent recurrence in initially localized disease—often manifesting as distant metastases—continues to be essential (Haria et al., 2021). With an increasing array of treatments available, precision medicine is gaining importance in ensuring that the most effective therapies are selected for each patient. Tumor organoids represent a promising tool for assessing personalized treatment sensitivity. Studies have shown that CRC organoids can reasonably predict clinical responses (Ooft et al., 2019; Narasimhan et al., 2020; Tan et al., 2023). However, several factors currently limit their broader use, including challenges in establishing organoid cultures from tumor tissue, lack of immune or stromal components in the organoid system, high costs, and labor-intensive procedures. Although the direct clinical application of tumor organoids is still under development, organoids serve as highly relevant in vitro models (Veninga and Voest, 2021). They reflect many characteristics of the original tumors and offer a valuable platform for identifying novel biomarkers, including those associated with drug resistance (Mir et al., 2016; Ryu et al., 2024).
In this study, we expanded our previously established CRC organoid collection (Poloznikov et al., 2021) to identify robust biomarkers associated with resistance to three standard-of-care chemotherapeutic agents — 5-FU, oxaliplatin, and SN-38 (an active metabolite of CPT-11 or irinotecan), which are key components of systemic CRC treatment. To achieve this, we conducted mRNA sequencing on the organoids and performed cytotoxicity assays to assess drug response, aiming to identify genes with expression levels that correlate with drug resistance. These genes could serve as biomarkers for drug resistance and may also represent therapeutic targets. Even modest correlations with a Spearman coefficient of ±0.3 are meaningful if reproducible, as this ensures reliability in the context of drug response, a complex biological process where the influence of any single gene is often limited. For the first time, in our study we conducted correlational analyses using both CRC organoids and publicly available CRC cell line data to ensure reliable findings. The intersection of gene lists from these datasets allowed us to pinpoint genes whose expression consistently correlates with resistance to each SoC drug. We would like to emphasize that our novel approach of combining two in vitro models enabled the identification of new genes previously not associated with drug resistance. Finally, these genes were used to construct gene expression signatures to predict overall survival in Stage IV CRC patients and relapse-free survival in Stage II/III CRC patients.
Our results highlight the limited reproducibility in studies that correlate drug resistance with gene expression, especially when comparing data across different models. Even within comparisons of cancer cell lines alone, reproducibility is modest, and this becomes more pronounced when comparing cell lines to tumor organoids. This may be partly due to varying experimental conditions. Additionally, tumor organoids, as more advanced models, may inherently yield different results than traditional cancer cell lines. However, the extensive use of cancer cell lines in research has demonstrated their utility, underscoring the importance of synthesizing findings from diverse model types to ensure robust, reliable conclusions. In the future, larger studies on CRC organoids may reveal additional genes associated with resistance to commonly used chemotherapeutic agents in CRC treatment—genes that might not be detectable in cell line models.
The first drug we studied, 5-fluorouracil (5-FU), is a cornerstone of chemotherapy for CRC treatment (Kumar et al., 2023). Structurally, 5-FU is a heterocyclic aromatic compound similar to pyrimidines, specifically resembling uracil but with a fluorine atom substituting for hydrogen at the C-5 position. This structural similarity enables 5-FU to be incorporated into RNA and DNA, disrupting nucleoside metabolism and causing cytotoxicity and death in rapidly dividing cells (Noordhuis et al., 2004). In mammalian cells, 5-FU is metabolized into three main active forms: fluorodeoxyuridine triphosphate (FdUTP), fluorouridine triphosphate (FUTP), and fluorodeoxyuridine monophosphate (FdUMP). Among these, FdUMP inhibits thymidylate synthase (TS) by forming a stable complex that blocks the synthesis of deoxythymidine monophosphate (dTMP), an essential nucleotide for DNA replication and repair (Longley et al., 2003).
Currently, numerous mechanisms of resistance to 5-FU have been identified. Some are broadly relevant across anticancer drugs, such as the expression of ABC transporters, while others are more specific to 5-FU, involving enzymes that metabolize the drug (Azwar et al., 2021). In this study, we identified additional genes linked to 5-FU response, with UXS1 standing out as particularly notable. UXS1 encodes an enzyme that converts UDP-glucuronic acid to UDP-xylose. Interestingly, previous research has connected this gene to 5-FU resistance in fungal cells (Billmyre et al., 2020). In fungi, mutations and downregulation of UXS1 lead to the accumulation of UDP-glucuronic acid, which may hinder the formation of toxic 5-FU metabolites or interfere with the inhibition of drug targets, like TS. Consequently, in fungi, UXS1 expression correlates negatively with 5-FU resistance. However, our findings suggest a different relationship in CRC, where UXS1 expression is distinctly associated with 5-FU resistance. In our study, UXS1 expression showed a positive correlation with IC50 values for 5-FU, indicating that higher UXS1 expression is linked to increased drug resistance. Furthermore, elevated UXS1 expression significantly increased the risk of death in patients with metastatic CRC. Notably, recent work has demonstrated that cisplatin-resistant lung and breast cancer cells exhibit sensitivity to UXS1 knockout (Doshi et al., 2023). This underscores the potential of UXS1 as a novel therapeutic target in overcoming chemoresistance in certain cancers, including CRC.
Our pathway analysis revealed, among others, a pathway for iron uptake and transport. There is now a large body of research showing that resistance to anticancer drugs significantly alters iron metabolism depending on the type of cancer and the drugs used. Since iron is an essential element for cell proliferation, various drug-resistant cells with high proliferation rates often increase iron uptake, thereby increasing its intracellular level (Kazan et al., 2017). Particularly, increased expression of several genes, associated with this pathway, including the V-ATPase subunit genes ATP6V0C and ATP6V0E1, was linked to heightened resistance to 5-FU. V-ATPase is involved in membrane trafficking, receptor recycling (e.g., transferrin and insulin receptors), and autophagy (Collins and Forgac, 2020). Elevated V-ATPase expression correlates with poor prognosis across many cancer types, and its inhibition presents a potential anticancer strategy (Chen F. et al., 2022). Notably, higher expression of ATP6V0C and ATP6V0E1 was significantly associated with worse prognosis for Stage II/III CRC patients.
In addition, it was revealed that increased expression of the genes HSPA1L and SETD6 was significantly correlated with resistance to 5-FU. Their high expression levels were found to be associated with poor prognosis for metastatic colorectal cancer. Previous research has established that heat shock 70-kDa protein 1-like (HSPA1L) is crucial in promoting CRC proliferation via HIF-1α activation and cellular prion protein (PrPC) regulation within tumor niches (Lee et al., 2017), and its expression has already been linked to CRC prognosis (Lee et al., 2019; Huang et al., 2024). Similarly, SETD6 has been implicated as a marker in breast cancer stem cells, and its mutation is associated with increased susceptibility to familial colorectal cancer type X (Martín-Morales et al., 2017; Li et al., 2023). Overall, our study highlights the previously underexplored role of these genes in 5-FU resistance, offering novel insights into their potential as therapeutic targets in CRC.
Conversely, higher expression of certain genes linked to 5-FU response was associated with a significantly improved prognosis in CRC patients. One prominent example is POGLUT1 (Protein O-Glucosyltransferase 1), whose expression showed a negative correlation with 5-FU IC50 values, suggesting increased sensitivity to the drug. Consistent with this, elevated POGLUT1 expression significantly lowered the risk of death for metastatic CRC patients. Interestingly, previous studies linked higher POGLUT1 levels to more advanced CRC (Mehboob and Lang, 2021). POGLUT1 expression has been observed to be significantly elevated in colorectal cancer tissues compared to adjacent noncancerous areas, with overexpression linked to advanced TNM stages, lymph node metastasis, and shorter survival times (Fang et al., 2017). Knockdown of POGLUT1 in CRC cells has been shown to halt proliferation and enhance cell adhesion (Fang et al., 2017). These findings underscore how the role of specific genes in cancer progression and therapeutic response can vary widely, sometimes even showing opposite effects.
Another notable example is IL16, where higher expression is associated with significantly improved prognosis. Intriguingly, IL16 was the only gene included in both gene expression signatures for metastatic Stage IV CRC and early Stage II/III CRC patients. The limited overlap between metastatic and non-metastatic CRC gene signatures can be attributed to the fundamentally distinct characteristics of primary and metastatic tumors. In early-stage CRC, chemotherapy primarily targets a small population of residual cancer cells that have not yet initiated metastasis. In contrast, metastatic cancer involves widely disseminated cells that have already adapted to the tumor microenvironment and developed enhanced resistance to treatment (D’Alterio et al., 2020). Interleukin-16, a multifunctional cytokine, plays a key role in inflammatory diseases and contributes to tumor development and progression (Kovacs, 2001; Richmond et al., 2014). Recent studies have identified single nucleotide polymorphisms (SNPs) in the IL16 gene as a potential factor in CRC susceptibility. While CRC patients have significantly higher serum IL-16 levels than healthy individuals, no significant association was found between IL16 polymorphisms and serum IL-16 levels (Gao et al., 2008). In our analysis, IL16 expression was positively correlated with 5-FU resistance in vitro, with higher expression observed in more resistant cells. However, patient data showed an opposite association, where elevated IL16 expression was linked to a better prognosis. This discrepancy underscores the limitations of directly translating in vitro findings, even from advanced models like organoids, into clinical observations. One possible explanation for this opposing effect is that IL16 is predominantly expressed in immune cells, not epithelial cells. Higher IL16 expression in tumor tissue may indicate greater immune system activation, which could enhance the patient’s prognosis.
The second key CRC drug explored in this study is oxaliplatin, a third-generation platinum-based medication commonly used in colorectal, gastric, and pancreatic cancers (Mustafa et al., 2024a). Its introduction has notably improved objective response rates and progression-free survival in metastatic CRC patients. Oxaliplatin functions primarily by binding to DNA to create adducts that cause DNA damage, which disrupts replication and transcription processes, ultimately leading to apoptosis and triggering immune responses (Alcindor
Comments (0)