
Remember me
Since 1999 a total of 358 cases were identified with available follow-up visit entries exhibiting a median age of 61 years (IQR 50–70 years) and more than 95% of Caucasian descent, 168 (46.9%) were females (Table 1). Across all cases, the mean observation time was 5.8 years within a range of 131 days up to twenty-one years. According to the novel 2022 ACR/EULAR criteria, we identified 208 individuals (58.1%) as GPA and 139 (38.8%) as MPA [4, 5]. Eleven cases (3.1%) could not be classified based on these criteria (Table 1). Three of the four Asian patients had diagnosis of an MPA. Following re-classification, we observed an increase in MPA cases compared to the initial clinical diagnosis. This change is primarily due to 29 cases, initially diagnosed as “renal limited AAV”, being re-classified as MPA and only three as GPA (suppl. table 1). We calculated high concordance rates (90% for GPA an 98% for MPA patients) between initial diagnoses and those based on the novel criteria as previously demonstrated [9]. Nine of the eleven “unclassified cases” did not display PR3- or MPO-specificity at the time of initial diagnosis, two cases were PR3-positive. “Unclassified patients” showed predominantly ENT (7/11), pulmonal (6/11), and in minority renal involvement (4/11). The evaluation of relevant concomitant conditions revealed no significant differences between both groups in smoking, hypertension, or coronary artery disease except for preexisting renal disease in the MPA group. Overall, MPA patients were significantly older at diagnosis (65.0 vs 58.2 years), whereas gender distribution was almost balanced between both groups. At initial presentation, GPA patients exhibited higher disease activity in general as expressed by increased BVAS scores than MPA patients (16.2 vs.13.7). In more detail, renal AAV affection was found more frequent in the MPA group (84.9 vs. 68.3%) and was significantly more severe as documented by lower baseline eGFR (37.3 vs. 59.2 ml/min/1.73 m2 in GPA patients). Organ involvement was more heterogeneous among GPA patients with more prominent general, ENT, lung, neurological and mucosal manifestations.
Table 1 Baseline characteristics, comorbidities, organ manifestations, vasculitis associated activity and outcomeProportion of GPA and MPA cases over timeWe observed a more pronounced increase in anti-MPO+/MPA cases between 1999 and 2022 as compared to anti-PR3+/GPA cases (Fig. 1) across all four centers. When dividing all AAV cases into those diagnosed up to and from 2013 which almost represents the median follow-up period of the data collection, the proportion of MPA cases increased from 29.1% up to 44.8% among all AAV cases, whereas GPA cases decreased from 68.3% to 52%.
Fig. 1
Classification and therapy for induction over time
Induction and maintenance therapiesOver the entire observational period, the majority of AAV patients (65%) received CYC for remission induction, whereas RTX was only used in a minor fraction (16.8%, Table 2). Fifteen patients (4.2%) received a CYC/RTX combination regimen, and 50 patients (14.0%) received none of these classic induction therapies, but were treated with methotrexate (MTX, 5%), azathioprine (AZA, 1.4%), mycophenolate mofetil (MMF, 0.3%) or corticosteroid monotherapy (3.9%). Patients that received a combined CYC/RTX induction regimen (n = 15) were around 55 years old, 67% had GPA and mean BVAS score ranged around 17, thus comparable to the main cohort. In nine AAV patients, CYC was used as initial agent followed by RTX within 90 days after diagnosis (vice versa in six patients). Overall this subgroup showed more multi-organ involvement than in the entire cohort. Upon remission induction, maintenance therapy was conducted with azathioprine (AZA) in 154 patients (43.0%) and RTX in 48 patients (13.4%). Sixty-four patients (17.9%) received low-dose corticosteroids without additional continuous immunosuppression. Only few patients were treated with MTX (12%), MMF (11.5%), or leflunomide (LEF, 2.2%) as maintenance therapy.
Table 2 Therapies used for remission induction and maintenanceThe most common combination regimen for induction/maintenance therapy was CYC followed by AZA (37.2%). Since RTX was first licensed in 2013 for AAV treatment by the European regulatory authorities, the majority of RTX was administered thereafter in the participating centers and was used for both, remission induction and maintenance in 20 patients (5.6% of the entire cohort). A combination of CYC for induction and RTX for maintenance was applied in 19 cases (5.3%). Virtually all patients (97.2%) received corticosteroids (i.e. up to three intravenous boli of ≥ 250 mg methylprednisolone per day followed by oral corticosteroids with subsequent tapering regimen over three months to ≤ 10 mg prednisolone per day). PLEX was performed in 75 cases (20.9%) with decreasing frequency over the entire observational period (26.4% before 2013 vs. 16.6% thereafter, p = 0.032, supplemental Table 2).
Comparing therapeutic strategies before 2013 to those within the following years, CYC was used as major remission induction therapy within both intervals, yet with a decreasing frequency from 74.8 to 57.3%. By contrast, we observed an increase in the use of RTX since 2013 for both remission induction (from 5 to 26.1%) and for maintenance (from 3.8 to 21.1%).
Remission and relapse ratesOverall, 80.9% of patients were in complete remission one year after diagnosis irrespective of GPA or MPA cases (79.7 vs. 83.8%, Table 1). Within each classification group, the distribution of remission induction therapies was similar between GPA and MPA (Table 2). For remission maintenance, we observed minor differences with AZA, RTX, and MTX being more frequently applied in GPA patients, whereas corticosteroid monotherapy for maintenance was used more often in MPA patients.
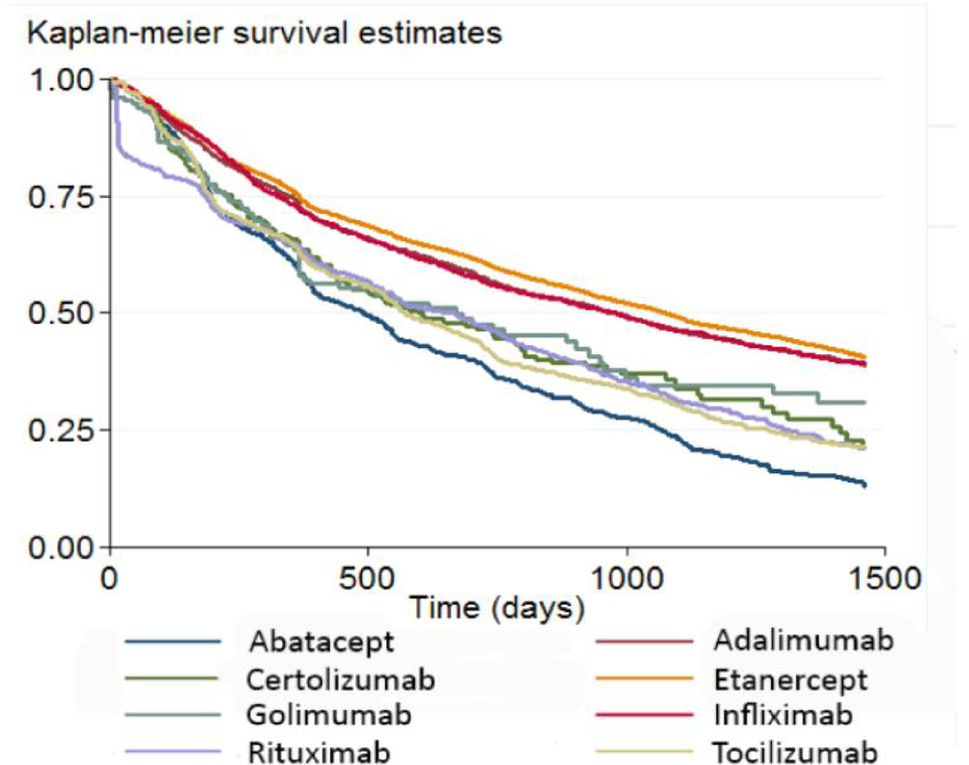
Over a median observational period of 57 months, the first relapse occurred more frequently in GPA cases (41.3% vs. 25.9% in MPA, p = 0.006). Furthermore, relapses occurred somewhat but not significant earlier in GPA patients, i.e. after a median of 28.3 months (IQR 14.1 to 57.4) vs. 35.4 months in MPA patients (IQR 8.7 to 58.2, p = 0.706) as illustrated by Kaplan–Meier plots (Fig. 2A). In the entire cohort, the chosen therapeutic regimen (CYC vs. RTX) did not impact the occurrence of relapses (Fig. 2B).
Fig. 2
Relapse events regarding classification (A) and therapy for induction (B)
Influence factors for relapseWe included several baseline factors that potentially might influence relapses such as vasculitis activity, inflammatory status as measured by CRP and organ involvement, in a Cox proportional hazard model. In this analysis, GPA classification emerged as the most significant factor (HR 1.58, 95% CI 1.06 to 2.36, p = 0.024, suppl. table 4). Additionally, high BVAS scores, male gender, and active smoking status were also associated with higher relapse rates. Among disease domains, the presence of general symptoms was significantly linked to an increased risk of relapse. Additionally, skin involvement and ENT manifestations, the latter serving as a surrogate for GPA, contributed to an increased risk for relapse, albeit to a lesser extent. Notably, general symptoms were present in 70% of GPA cases, while they were present in only 50% of MPA cases.
Renal outcomesSubsequently, we focused exclusively on patients with renal involvement according to BVAS entries (n = 264, 73.7% of the entire cohort). In this sub-cohort, renal affection was more dominant in MPA patients (84.9%) as compared to GPA cases (68.3%). Along these lines, baseline eGFR was significantly lower in MPA (37.3 ml/min/1.73 m2) vs. 59.2 ml/min/1.73 m2 in GPA (p < 0.001, Table 1). In addition, MPA patients were significantly older (65.0 years vs. 58.5 years in GPA; p < 0.001). According to induction therapy, the composite renal endpoint occurred in 20.7% upon CYC therapy and in 30.0% following RTX within five years after initial diagnosis, yet this difference did not reach statistical significance suggesting that the choice of remission induction therapy did not affect major renal outcomes (Table 3). Similar rates were found for an alternative renal endpoint that is applied in many studies comprising the combination of relapse (at any time), all-cause death and ESKD, with an event rate of 33.7% within five years (CYC 32.4% vs. RTX 42.0%; p = 0.206). Over time, when comparing outcomes between 1999 to 2012 and thereafter, irrespective of the chosen therapies in detail, we observed a decrease in the number of relapses or deaths within 5-year periods (35.8% vs. 27.1%, p = 0.273). However, there was a notable increase in composite renal endpoints (17% vs. 21.6%, p = 0.077, suppl. table 3).
Table 3 Influence of therapeutic strategies on relapse rates and occurrence of composite renal endpoints in all cases and AAV subgroups for induction by CYC or RTX or combinationRisk factors for the composite renal endpoint were examined by Cox proportional hazard analysis (Fig. 3, suppl. table 4) identifying arterial hypertension as the most important factor (HR 1.94, 95%-CI 1.18 to 3.19, p = 0.009). If GPA and MPA were examined separately, a different picture emerged and yielded no distinct risk factor in MPA patients, whereas in GPA patients, arterial hypertension and higher age conferred an elevated risk for adverse renal outcomes (Fig. 3B). Instead, in this entity, remission induction using CYC was associated with a significantly decreased risk to encounter the composite renal endpoint (HR 0.20, 95%-CI 0.09 to 0.43, p < 0.001) in comparison to RTX (HR 0.62, 95%-CI 0.26 to 1.50, p = 0.291, suppl. table 5C).
Fig. 3
Risk factors for renal events and composite endpoint analyzes in all AAV patients with renal involvement under RTX as compared to propensity matched CYC counterparts in A all cases, B GPA patients and C MPA patients
Propensity-matched analysisWe were able to confirm a potentially different treatment response by applying Kaplan-Meyer analysis with log-rank testing in all available cases with renal involvement that were induced by RTX (n = 50) in comparison to their propensity-matched CYC-induced counterparts (n = 50) considering age, sex, CRP, BVAS and eGFR at baseline (Fig. 5, suppl. table 2). We observed significantly less patients meeting the renal endpoint upon CYC in total (Fig. 3A, p = 0.003) and in MPA (Fig. 3C, p = 0.038), but not in the GPA patients (Fig. 3B, p = 0.058). Among MPA patients who received RTX as induction regimen, a substantial and further decline in renal function occurred shortly after baseline, resulting in an early accumulation of renal endpoint events (Fig. 3C), potentially related to comparably low eGFR values in this group already at baseline (44.5 ml/min/1.73m2 in RTX vs. 40.3 ml/min/1.73m2 in CYC).
Comments (0)