
Remember me
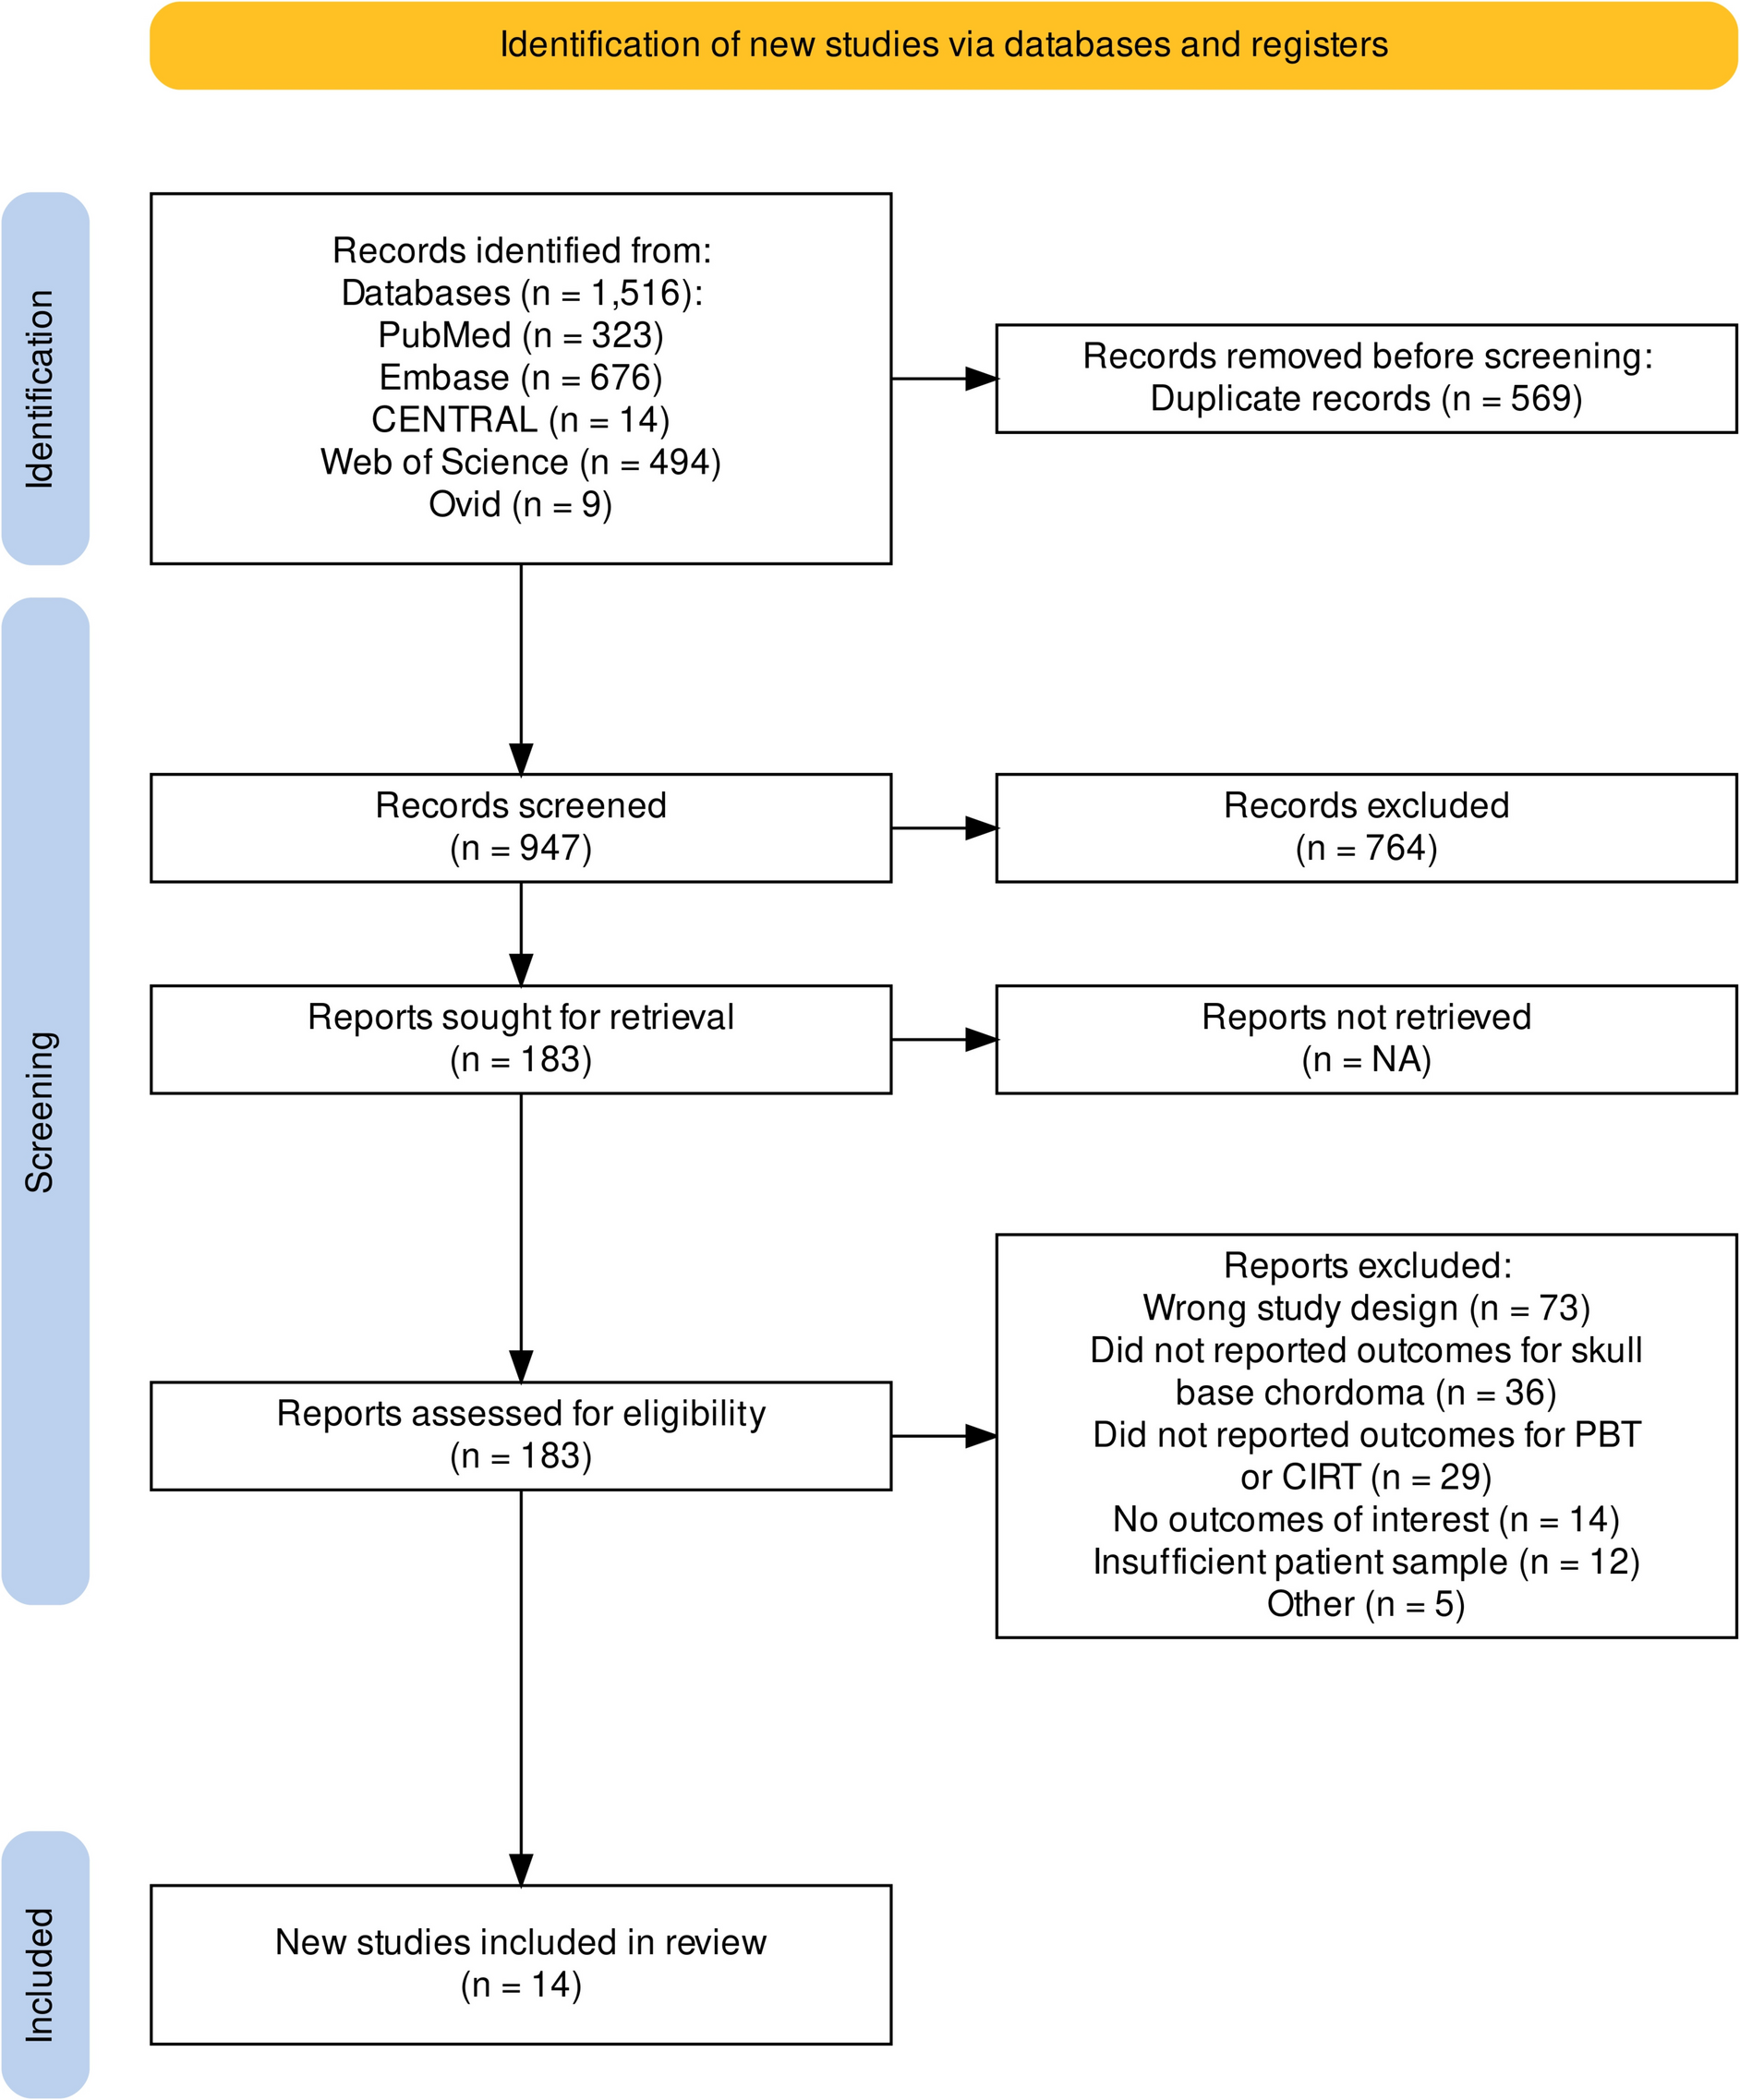
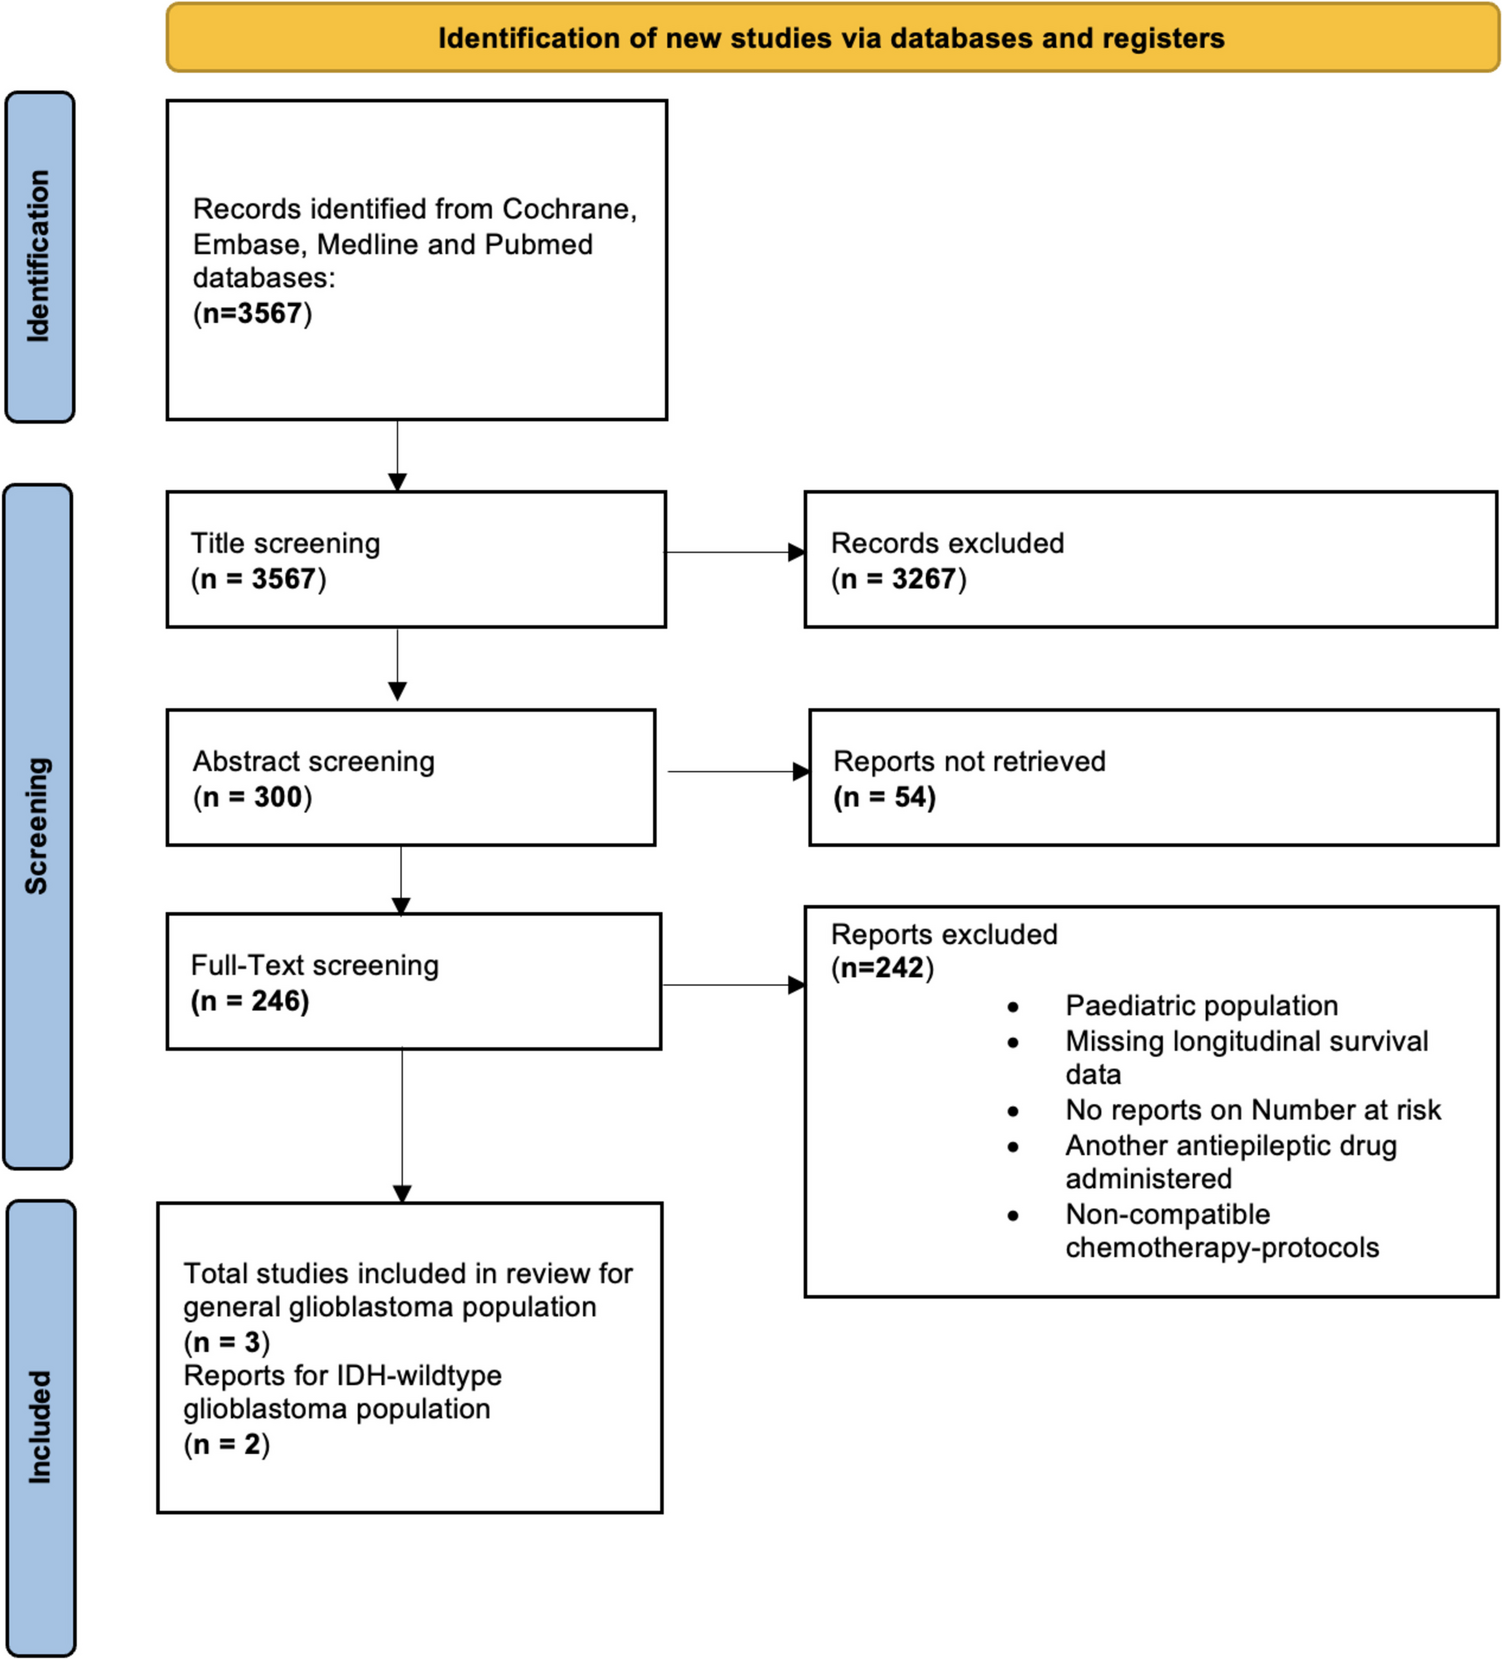
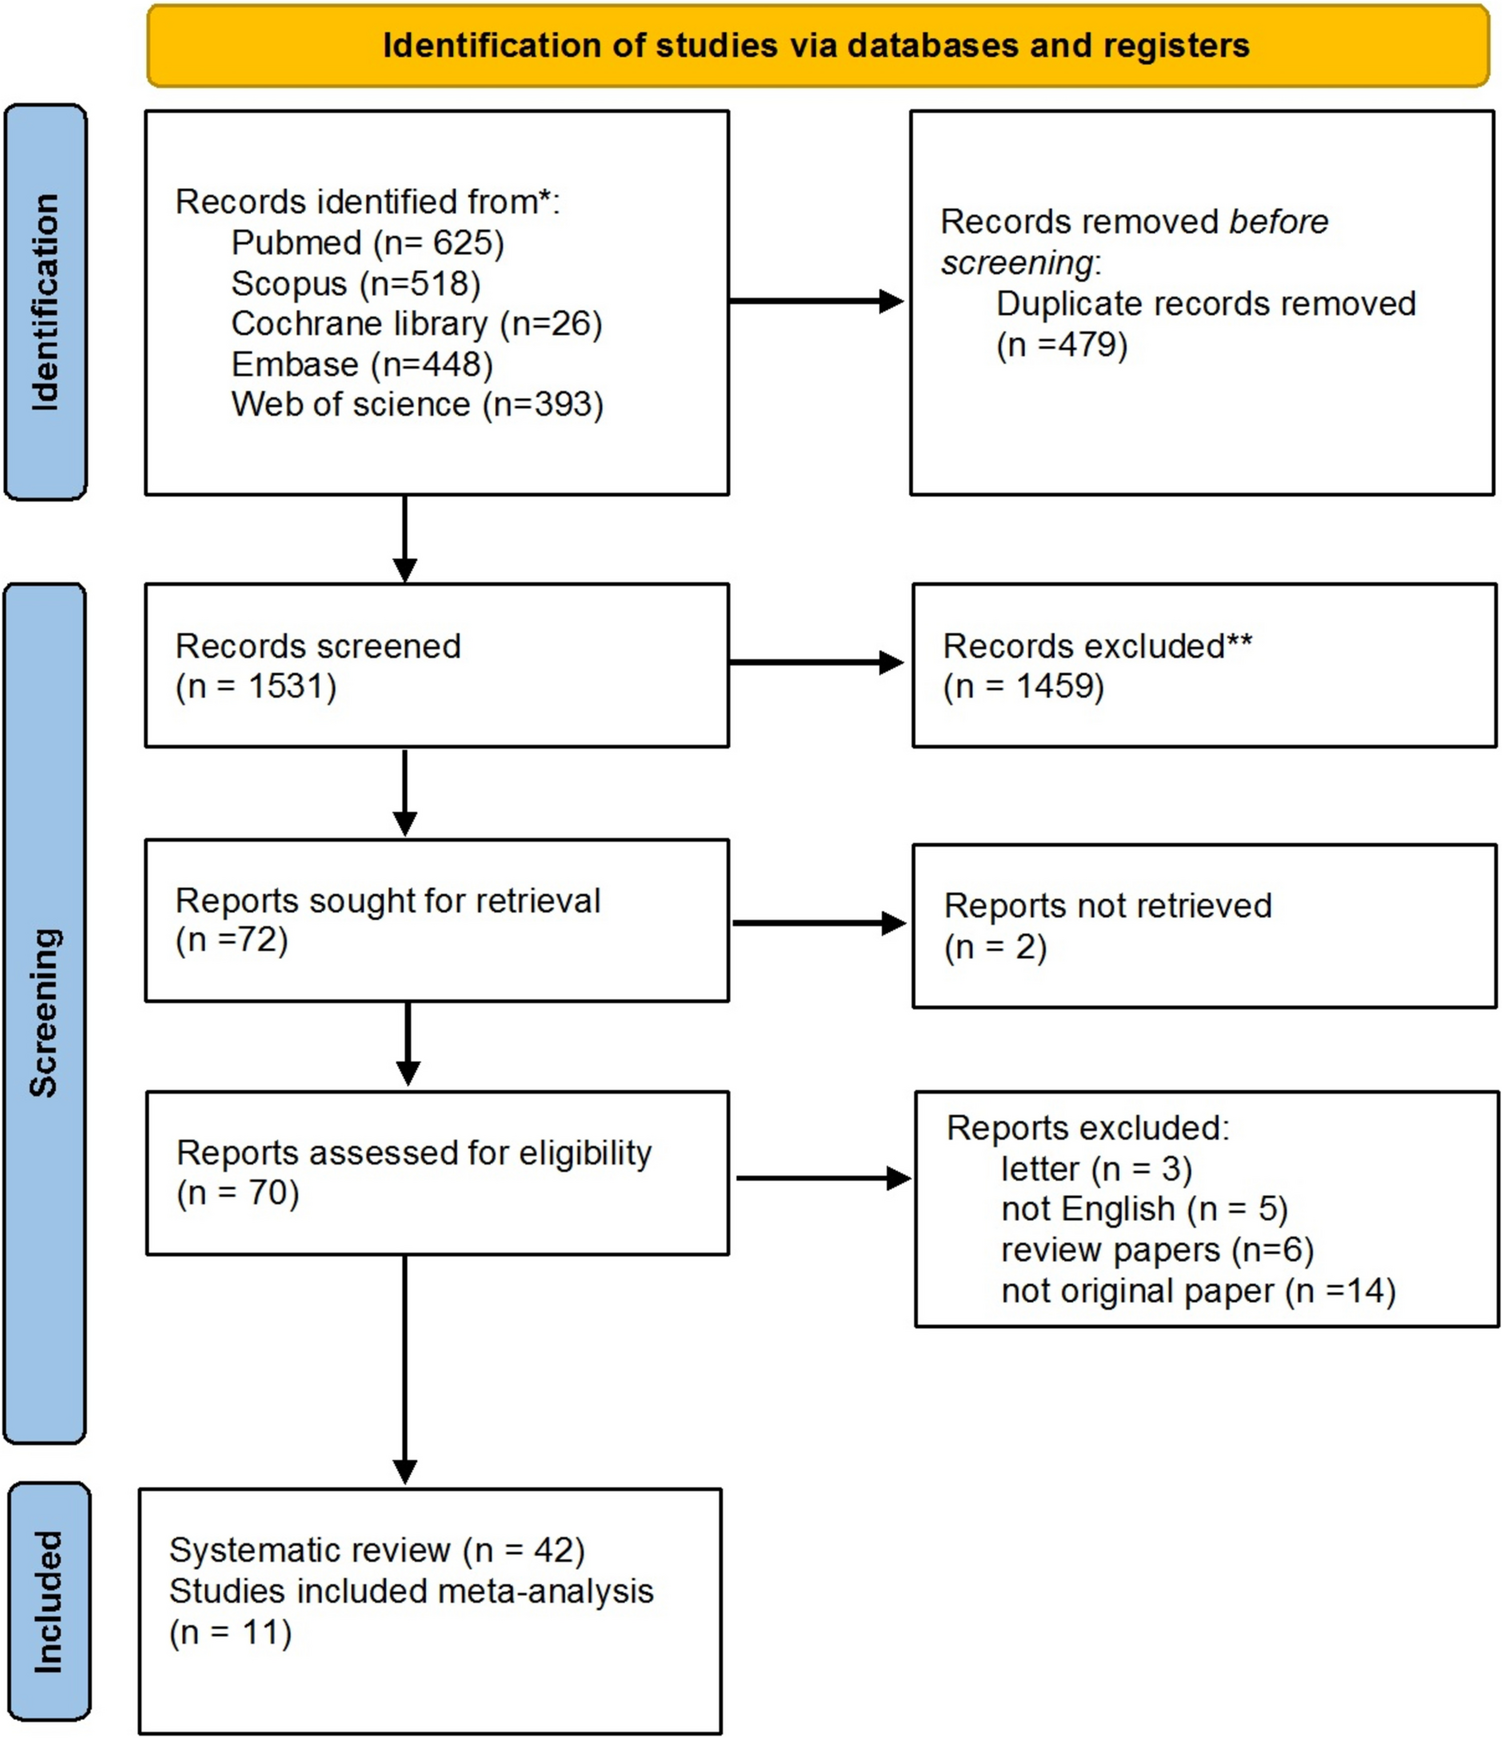
The search yielded a total of 1,516 publications. After 569 duplicate studies were detected and eliminated, we further removed 764 articles by titles and abstract screening. Subsequently, 183 articles were considered for full-text screening. Finally, 14 studies that met inclusion criteria published from 2009 to 2023 were included in this systematic review [2, 7, 18,19,20,21,22,23,24,25,26,27,28,29]. The PRISMA flow diagram (Fig. 1) illustrates the study selection process.
Fig. 1 Study and patient characteristics
Of the fourteen included studies, ten were retrospective cohorts, three were prospective cohorts, and one was a clinical trial. Patients were treated between 1981 and 2020 at a diverse array of institutions throughout the world in which four studies were conducted in North America (USA), three in Asia (Japan), and the remaining seven were conducted in Europe (Switzerland, Germany, UK, Italy).
A total of 1,145 patients with skull base chordoma were included, 671 treated with PBT (58.6%) and 474 with CIRT (41.4%). The median age ranged from 13 to 58 years (range: 11 – 92 years). Twelve studies with 907 patients specified the sex of patients; 497 patients were male (54.8%) with a ratio of male to female of 1.21. The median follow-up after radiation therapy varied from 21 to 108 months. Data including study characteristics, patient demographics, tumor features and details about radiation type and regimen for each study are presented in Table 1. A summary of both acute and late radiation-induced effects, detailing the frequency of occurrences and the corresponding toxicity grading levels based on the CTCAE, is provided in Table 2.
Table 1 Characteristics of the included studies with patient demographicTable 2 Description of toxicities according to the Common Terminology Criteria for Adverse Events (CTCAE)Local tumor control and overall survival with trial sequential analysisAll three studies that directly compare PBT with CIRT, reported 5-year LC and OS [7, 23, 27]. No significant difference between the two therapies for the 5-year LC (RR = 1.04, 95% CI = 0.86 to 1.26, p = 0.70, Fig. 2A) and the 5-year OS (RR = 1.00, 95% CI = 0.83 to 1.20, p = 0.97, Fig. 2B) was detected.
Fig. 2
A Meta-analysis and TSA results of 5-year LC, B Meta-analysis and TSA results of 5-year OS
TSA of PBT versus CIRT for 5-year LC and OS showed that the information size has not been reached, indicating a lack of evidence and the meta-analysis result is inconclusive with the cumulative Z-curve crossing neither the conventional significance threshold nor the O’Brien-Fleming boundaries (Fig. 2A, B). More studies are needed to confidently conclude on potential effects of PBT on 5-year LC and OS.
Local tumor controlThirteen studies included information about LC [2, 7, 18,19,20,21, 23,24,25,26,27,28,29]. The indirect analysis of PBT and CIRT for LC was performed at various time points (2-, 3-, 5-, 7-, and 10-year). At 3-year, PBT exhibited a LC of 90% (95% CI = 0.83 to 0.97), compared to 83% (95% CI = 0.78 to 0.88) with CIRT; the subgroup difference test was (p = 0.05) (Fig. 3B). The pooled LC rates were calculated at 2-year [PBT 94% (95% CI = 0.90 to 0.98) vs CIRT 92% (95% CI = 0.80 to 1.00), Fig. 3A], 5-year [PBT 76% (95% CI = 0.69 to 0.83) vs CIRT 74% (95% CI = 0.65 to 0.83), Fig. 3C], 7-year [PBT 71% (95% CI = 0.40 to 1.00) vs CIRT 74% (95% CI = 0.30 to 1.00), Fig. 3D], and 10-year [PBT 72% (95% CI = 0.39 to 1.00) vs CIRT 61% (95% CI = 0.00 to 1.00), Fig. 3E], respectively. The tests for subgroup differences indicated no significant variation at these time points.
Fig. 3
A Forest plot depicting meta-analysis for 2-year LC, B Forest plot depicting meta-analysis for 3-year LC, C Forest plot depicting meta-analysis for 5-year LC, D Forest plot depicting meta-analysis for 7-year LC, E Forest plot depicting meta-analysis for 10-year LC
Overall survivalAll fourteen studies evaluated OS [2, 7, 18,19,20,21,22,23,24,25,26,27,28,29]. The pooled OS rates were calculated at 2-year [PBT 90% (95% CI = 0.86 to 0.94) vs CIRT 95% (95% CI = 0.89 to 1.00), Fig. 4A], 3-year [PBT 83% (95% CI = 0.76 to 0.90) vs CIRT 89% (95% CI = 0.81 to 0.97), Fig. 4B], 5-year [PBT 83% (95% CI = 0.76 to 0.90) vs CIRT 89% (95% CI = 0.81 to 0.97), Fig. 4C], and 7-year [PBT 82% (95% CI = 0.61 to 1.00) and CIRT 88% (95% CI = 0.67 to 1.00), Fig. 4D], respectively. The tests for subgroup differences had no significant effect on the variation of these time points.
Fig. 4
A Forest plot depicting meta-analysis for 2-year OS, B Forest plot depicting meta-analysis for 3-year OS, C Forest plot depicting meta-analysis for 5-year OS, D Forest plot depicting meta-analysis for 7-year OS
Progression-free survivalFive studies analyzed PFS at 3- and 5-year [2, 22,23,24, 29]. At 3-year, PBT showed a PFS of 94% (95% CI = 0.76 to 1.00), while CIRT had 83% (95% CI = 0.26 to 1.00); the subgroup difference test was (p = 0.09) (Fig. 5A). At 5-year [PBT 84% (95% CI = 0.47 to 1.00) vs CIRT 81% (95% CI = 0.47 to 1.00), Fig. 5B] both therapies demonstrated comparable PFS with no significant subgroup differences.
Fig. 5
A Forest plot depicting meta-analysis for 3-year PFS, B Forest plot depicting meta-analysis for 5-year PFS
ToxicityA range of acute and late toxicities was observed for both PBT and CIRT. Acute toxicities, such as mild dermatitis, mucositis, and nausea, were generally low grade (mostly grades 1 and 2) across both treatments. No occurrences of higher-grade acute toxicities were reported. Late toxicities were more severe, including cases of optic neuropathy, brain necrosis, and hearing loss. Grade 3 and 4 toxicities were more frequently associated with CIRT, particularly radiation necrosis (Fig. 6).
Fig. 6
Bar plot displaying acute toxicities (grade 1–2) and late toxicities (grade 3–4) for proton beam therapy and carbon ion radiotherapy
Single survival curvesIndividual patient data (IPD) were extracted for LC from the included studies to obtain reconstructed survival curves. The pooled 1-, 3- and 5-year LC of PBT were 94.8% (95% CI = –90.2 to 99.6), 83.7% (95% CI = 69.4 to 92.4), and 78.4% (95% CI = 88.5) (Fig. 7A). The pooled 1-, 3- and 5-year LC of CIRT were 94.1% (95% CI = –90 to 98.7), 80.2% (95% CI = –72.9 to 88.3), and 71.6% (95% CI = 62.7 to 81.6) (Fig. 7B).
Fig. 7
Pooled summary local control of A proton beam therapy, B carbon ion therapy
Sensitivity analysisSensitivity analysis was conducted to see the influential studies and the heterogeneity, the plots were sorted by the effect size, I2 heterogeneity and Baujat of all the outcomes using the leave-one-out method. No single study was identified as a remarkably influential study and removing any single study altered neither outcomes nor heterogeneity remarkably (Supplementary Material 2).
Publication biasThe funnel plot distribution of scattered points in the outcomes analyzed was asymmetrical, suggesting that there was a possibility of publication bias, which could be related to the heterogeneity between studies (Supplementary Material 3).
Meta-regressionFor the 5-year LC, meta-regressions showed no impact to significantly predict outcome on covariates GTV (estimate 0.01; SE 0.01; 95% CI − 0.00 to 0.02; Z value 1.59; p = 0.11), and radiation dose (estimate 0.05; SE 0.03; 95% CI − 0.01 to 0.10; Z value − 1.63; p = 0.10) (Supplementary Material 1, Supplementary Material 4A).
At 5-year OS the covariates GTV (estimate − 0.01; SE 0.01; 95% CI − 0.01 to 0.03; Z value − 1.29; p = 0.20), and radiation dose (estimate 0.05; SE 0.04; 95% CI − 0.03 to 0.13; Z value − 1.17; p = 0.24) indicated no significant effect (Supplementary Table 2, Supplementary Material 4B).
Comments (0)