
Remember me


The cost of health care in the United States is continuing to rise, and by 2025, it is estimated to account for 19.9% of the gross domestic product.1 One of the largest portions of the healthcare industry is dedicated to caring for musculoskeletal disorders.2 As a result, there is considerable revenue generated from this sector of health care.3,4 Fracture care alone accounts for nearly $100 billion per year, with even more costs coming from other traumatic orthopaedic injuries.5,6 Specifically, hand trauma accounts for more than 12% of all trauma cases; within this 12%, the most prevalent injuries are hand/wrist fractures that occur in 179 of 100,000 trauma patients.7 With this high volume, hand trauma has the potential to create a notable stream of revenue for a hospital system.
While hand trauma programs have previously been fiscally advantageous to hospital systems,8 hand surgery service lines (not exclusively hand trauma) have demonstrated notable revenue generation for hospital systems because of the prevalence of hand surgery cases and the follow-up opportunities they create.6,8 Studies have been conducted to analyze the continued revenue generated by subsequent visits after orthopaedic trauma presentation.9 Despite the demonstrated financial advantage of orthopaedic trauma and the known volume of hand trauma, the financial benefit of a hand trauma program has not been studied directly.
Many patients presenting with traumatic injuries are new patients who have yet to have an interaction with the healthcare system. A unique opportunity is presented for a patient to establish themselves in the healthcare system after trauma presentation. It is not well-understood whether patients will continue to follow-up with the healthcare system that they initially presented to. Leakage of trauma patients to follow-up may be a challenge within many healthcare specialties, and it can account for a notable loss in revenue and loss of continuity of care for patients.9 Therefore, it is crucial for a healthcare system to be able to identify the patient factors that contribute to a decreased likelihood of following up within the system.
Currently, there is not yet a strong understanding of the patient factors that contribute to loss of follow-up and the downstream financial effect of this forfeiture of revenue. Therefore, the primary purpose of this study was to elucidate the economic effect of hand trauma care and patient loss to follow-up across the orthopaedic hand trauma service for injury/noninjury-related services after initial hand trauma presentation. The secondary purpose was to determine the patient factors that contributed to increasing the likelihood of follow-up within the healthcare system after trauma. Our primary hypothesis is that older, established male patients are more likely to follow up. Our secondary hypothesis is that the greatest revenue would be from rehabilitation services.
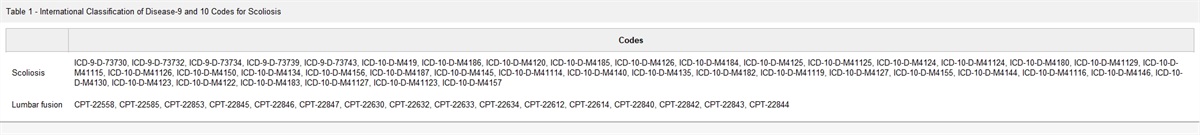
MethodsData were retrospectively collected over 4 years, from January 1, 2014, to December 31, 2018, from a large integrated multicenter academic healthcare system in the Midwest. The population included adult orthopaedic patients presenting for hand trauma evaluation. Any encounter with an ICD-10 code for adult hand trauma presenting to the emergency department was included in this study. All patients were provided with written follow-up care instructions on discharge, and a standardized discussion of follow-up was included in discharge. Interpreters were available at all times and were used during all discussions for any patient with difficulty comprehending English. Follow-up within 6 weeks of hand trauma presentation was recorded. Injury-related care was defined as subsequent care for a hand ICD-10 code. We followed patients for 2 years after the initial presentation to record all subsequent care.
Demographic information including age, sex, race, ethnicity, insurance type (Medicaid Health Maintenance Organization (HMO), Blue Shield or commercial, HAP, Medicaid, Medicare, Medicare Advantage, self-pay, Tricare, and worker's compensation), new vs. established patient status, outside-hospital transfer, hospital admission, intensive care unit admission, hand surgery consultation, and trauma designation of center presented to were analyzed. For patient status, patients whose first interaction with our healthcare system occurred at the presentation of their hand trauma were considered new patients. Established patient status refers to patients who had an interaction with our healthcare system before their hand trauma presentation.
Financial data collected included revenue, cost, and operating margin related to hand trauma presentation and subsequent care. This included both inpatient and outpatient care. Injury-related and injury-unrelated services were included in the analysis. Follow-up was within 24 months after the initial trauma presentation. Lost revenue was calculated by determining the average revenue generated per patient and using that average to extrapolate the potential loss from each patient lost to follow-up.
After these data were collected, Wilcoxon rank-sum test was used to test for differences in continuous variables, Pearson chi square test for categorical variables, and odds ratio for each variable. A follow-up model was created using logistic regression. Results with a P value of < 0.05 were considered statistically significant.
Results DemographicsWe included 56,995 patients; most of them were White (56%) and male (54%) (Table 1). The average age was 38 years. There were more established patients (69%) than new patients (31%). A small proportion of patients received formal hand consultation (4.3%), were admitted to the intensive care unit (0.1%) or hospital (2.3%), or were transferred from an outside system (2.7%). The most common insurance provider was Medicaid HMO (33%).
Table 1 - Characteristics of 56,995 Patients Variable N = 56,995a Sex Male 30,990 (54%) Female 26,004 (46%) NULL 1 Age 38 (22) 3 Race White 31,683 (56%) Black 18,555 (33%) Other 6756 (12%) NULL 1 Established status Active 39,247 (69%) New 17,748 (31%) External Referral 1527.000 (2.679%) Hospital admission 1303 (2.3%) ICU Admission 70 (0.1%) Follow-up 22,689 (40%) Ethnic group Not Hispanic, Arab or Chaldean 51,083 (90%) Arab or Chaldean 1561 (2.7%) Decline/Not known 1947 (3.4%) Hispanic or Latino 2389 (4.2%) NULL 15 Consult Flag 2429 (4.3%) Insurance Medicaid HMO 19,085 (33%) Blue Shield 10,504 (18%) Commercial 3886 (6.8%) HAP 3528 (6.2%) Medicaid 3614 (6.3%) Medicare 5741 (10%) Medicare Advantage 3926 (6.9%) Self-pay 3973 (7.0%) Tricare 203 (0.4%) Worker's comp 2535 (4.4%) Level of trauma Level I 10,259 (18%) Level II 11,380 (20%) Level III 12,736 (22%) No trauma designation 22,620 (40%)HMO = Health Maintenance Organization.
an (%); mean (SD).
We observed a 39.8% follow-up rate for any care within 6 weeks (22,689 of 56,995) and a 68% return for care within 2 years (38,720 of 56,995) (Table 2). 15.9% of patients returned specifically for subsequent care related to hand trauma.
Table 2 - All Patients Return for Follow-Up With Odds Ratios Variable N Follow-up No, N = 34,306a Yes, N = 22,689 P b OR 95% CI P Sex 56,994 <0.001 Male 19,110 (56%) 11,880 (52%) — — Female 15,195 (44%) 10,809 (48%) 0.99 0.96, 1.03 0.7 Age 56,992 34 (20) 43 (22) <0.001 1.01 1.01, 1.02 <0.001 Race 56,994 <0.001 White 18,545 (54%) 13,138 (58%) — — Black 11,201 (33%) 7354 (32%) 1.01 0.96, 1.05 0.8 Other 4559 (13%) 2197 (9.7%) 0.9 0.84, 0.96 0.001 Established status 56,995 <0.001 Active 21,334 (62%) 17,913 (79%) — — New 12,972 (38%) 4776 (21%) 0.5 0.48, 0.52 <0.001 External referral 56,995 731 (2.1%) 796 (3.5%) <0.001 1.48 1.40, 1.82 <0.001 Hospital admission 56,995 382 (1.1%) 921 (4.1%) <0.001 1.59 1.40, 1.82 <0.001 ICU admission 56,995 15 (<0.1%) 55 (0.2%) <0.001 2.08 1.14, 4.02 0.022 Ethnic group 56,980 <0.001 — — Not Hispanic, Arab or Chaldean 30,445 (89%) 20,638 (91%) — — Arab or Chaldean 1183 (3.4%) 378 (1.7%) 0.67 0.59,0.76 <0.001 Decline/Not known 1255 (3.7%) 692 (3.0%) 0.87 0.79, 0.97 0.009 Hispanic or Latino 1408 (4.1%) 981 (4.3%) 1.26 1.15, 1.38 <0.001 Consult Flag 56,995 787 (2.3%) 1642 (7.2%) <0.001 2.85 2.59, 3.15 <0.001 Insurance 56,995 <0.001 Commercial/Blue Cross 11,909 (35%) 6962 (31%) — — HAP 1757 (5.1%) 1795 (7.9%) 1.59 1.47, 1.71 <0.001 Medicaid/Medicaid HMO 12,522 (37%) 6168 (27%) 0.86 0.83, 0.90 <0.001 Medicare/Medicare Advantage 3840 (11%) 5816 (26%) 1.35 1.27, 1.44 <0.001 Self/Uninsured 2828 (8.2%) 829 (3.7%) 0.55 0.51, 0.60 <0.001 Worker's comp 1449 (4.2%) 1119 (4.9%) 1.19 1.09, 1.30 Level of trauma 56,995 Level I 5872 (17%) 4387 (19%) — — Level II 6173 (18%) 5207 (23%) 1.23 1.15, 1.31 <0.001 Level III 7534 (22%) 5202 (23%) 0.98 0.92, 1.04 0.5 No trauma designation 14,727 (43%) 7893 (35%) <0.001 0.88 0.83, 0.93 <0.001CI = confidence interval, HMO = Health Maintenance Organization, OR = odds ratio.
an (%); mean (SD).
bPearson chi square test; Wilcoxon rank-sum test.
For new and established patients (Table 3) returning for hand-related follow-up, there were two patient demographic factors that led to a greater likelihood of follow-up: increasing age (OR 1.01 per year of age, P < 0.001) and ‘Hispanic or Latino’ (OR 1.25, P < 0.001). Two visit-specific factors that conferred greater follow-up were transfer from an outside system (OR 1.73, P < 0.001) and hand surgery consultation (OR 3.66, P < 0.001). Certain payment factors (worker’s comp [OR 1.19, P < 0.001], HAP [OR 1.59, P < 0.001]) resulted in increased follow-up.
Table 3 - All Patients Return for Hand Follow-Up With Odds Ratios Variable N Hand Follow-up No, N = 47,927a Yes, N = 9,068a P b OR 95% CI P Sex 56,994 <0.001 Male 25,657 (54%) 5333 (59%) — — Female 22,269 (46%) 3735 (41%) 0.77 0.73, 0.80 <0.001 Age 56,992 37 (21) 42 (22) <0.001 1.01 1.01, 1.01 <0.001 Race 56,994 <0.001 White 26,435 (55%) 5248 (58%) — — Black 15,661 (33%) 2894 (32%) 0.95 0.90, 1.01 0.094 Other 5830 (12%) 926 (10%) 0.91 0.84, 0.99 0.029 Established status 56,995 <0.001 Active 32,437 (68%) 6810 (75%) — — New 15,490 (32%) 2258 (25%) 0.7 0.66, 0.74 <0.001 External transfer 56,995 1099 (2.3%) 428 (4.7%) <0.001 1.73 1.53, 1.95 <0.001 Hospital admission 56,995 946 (2.0%) 357 (3.9%) <0.001 0.97 0.84, 1.12 0.7 ICU admission 56,995 57 (0.1%) 13 (0.1%) 0.5 0.62 0.31, 1.13 0.14 Insurance type 56,994 <0.001 Commercial/Blue Cross 15,834 (33%) 3037 (33%) — — HAP 2732 (5.7%) 820 (9.0%) 1.49 1.37, 1.63 <0.001 Medicaid/Medicaid HMO 16,393 (34%) 2297 (25%) 0.72 0.68, 0.77 <0.001 Medicare/Medicare Advantage 7734 (16%) 1922 (21%) 0.91 0.84, 0.98 0.02 Self/Uninsured 3319 (6.9%) 338 (3.7%) 0.53 0.47, 0.60 <0.001 Worker's comp 1914 (4.0%) 654 (7.2%) 1.61 1.46, 1.78 <0.001 Hand follow-up 56,995 13,621 (28%) 9068 (100%) <0.001 Ethnic group 56,980 <0.001 Not Hispanic, Arab or Chaldean 42,884 (90%) 8199 (90%) — — Arab or Chaldean 1435 (3.0%) 126 (1.4%) 0.63 0.52, 0.75 <0.001 Decline/Not known 1626 (3.4%) 321 (3.5%) 1.05 0.92, 1.19 0.5 Hispanic or Latino 1967 (4.1%) 422 (4.7%) 1.25 1.11, 4.04 <0.001 ED Location 56,995 <0.001 — — Henry Ford Main 8286 (17%) 1973 (22%) Henry Ford Allegiance 3028 (6.3%) 908 (10%) Henry Ford Cottage 1656 (3.5%) 363 (4.0%) Henry Ford Fairlane 9116 (19%) 1396 (15%) Henry Ford Sterling Heights 3119 (6.5%) 539 (5.9%) Henry Ford Macomb 6222 (13%) 1222 (13%) Henry Ford West Bloomfield 3961 (8.3%) 738 (8.1%) Henry Ford Wyandotte 6951 (15%) 1086 (12%) Henry Ford Brownstown 5588 (12%) 843 (9.3%) Consult Flag 56,995 1429 (3.0%) 1000 (11%) <0.001 3.66 3.32, 4.04 <0.001 Location-based level of trauma 56,995 <0.001 Level I 8286 (17%) 1973 (22%) — — Level II 9250 (19%) 2130 (23%) 1.1 1.01, 1.19 0.032 Level III 10,912 (23%) 1824 (20%) 0.84 0.77, 0.91 <0.001 No trauma designation 19,479 (41%) 3141 (35%) 0.89 0.83, 0.96 0.003CI = confidence interval, HMO = Health Maintenance Organization, OR = odds ratio.
an (%); mean (SD).
bPearson chi square test; Wilcoxon rank-sum test.
Decreased likelihood of hand trauma–related follow-up for new and established patients was seen with female (OR 0.77, P < 0.001), ‘other’ race (OR 0.91, P = 0.029), Medicaid/Medicaid HMO (OR 0.86, P < 0.001), Medicare/MA (OR 0.91, P = 0.02), and self-pay (OR 0.55, P < 0.001) patients.
When examining only new patients returning for subsequent hand trauma–related care, visit factors leading to increased follow-up included hospital admission, external transfer, and hand surgery consultation (OR 1.48, P = 0.009, OR 1.94, P < 0.001, and OR 4.06, P < 0.001, respectively). Similar visit factors were associated with increased follow-up in new patients returning for hand trauma–unrelated care (Table 4). Payment factors leading to increased follow-up included only patients using worker's compensation (OR 1.76, P < 0001).
Table 4 - Analysis of New Patients Returning for Injury-Unrelated Follow-Up With Odds Ratios Variable N Follow-up No, N = 12,972a Yes, N = 4,776a P b ORc 95% CId P Sex 17,747 <0.001 Male 8035 (62%) 3145 (66%) — — Female 4936 (38%) 1631 (34%)
Comments (0)