
Remember me


A total of 136 consecutive patients with unresectable stage IIIA–C NSCLC (UICC 8th edition) received initial treatment between 2011 and 2020 and were eligible for this analysis. A summary of patient- and tumor-characteristics is shown in Table 1.
In the entire cohort, the median follow-up was 49.7 (range: 0.7–126.1) months. Seventy-eight (57%) patients were older than 65 years and the mean age was 66.9 (range 33.6–82.5) years. Table 2 shows OS, BMFS, ecDMFS and DMFS for the entire cohort and each subgroup.
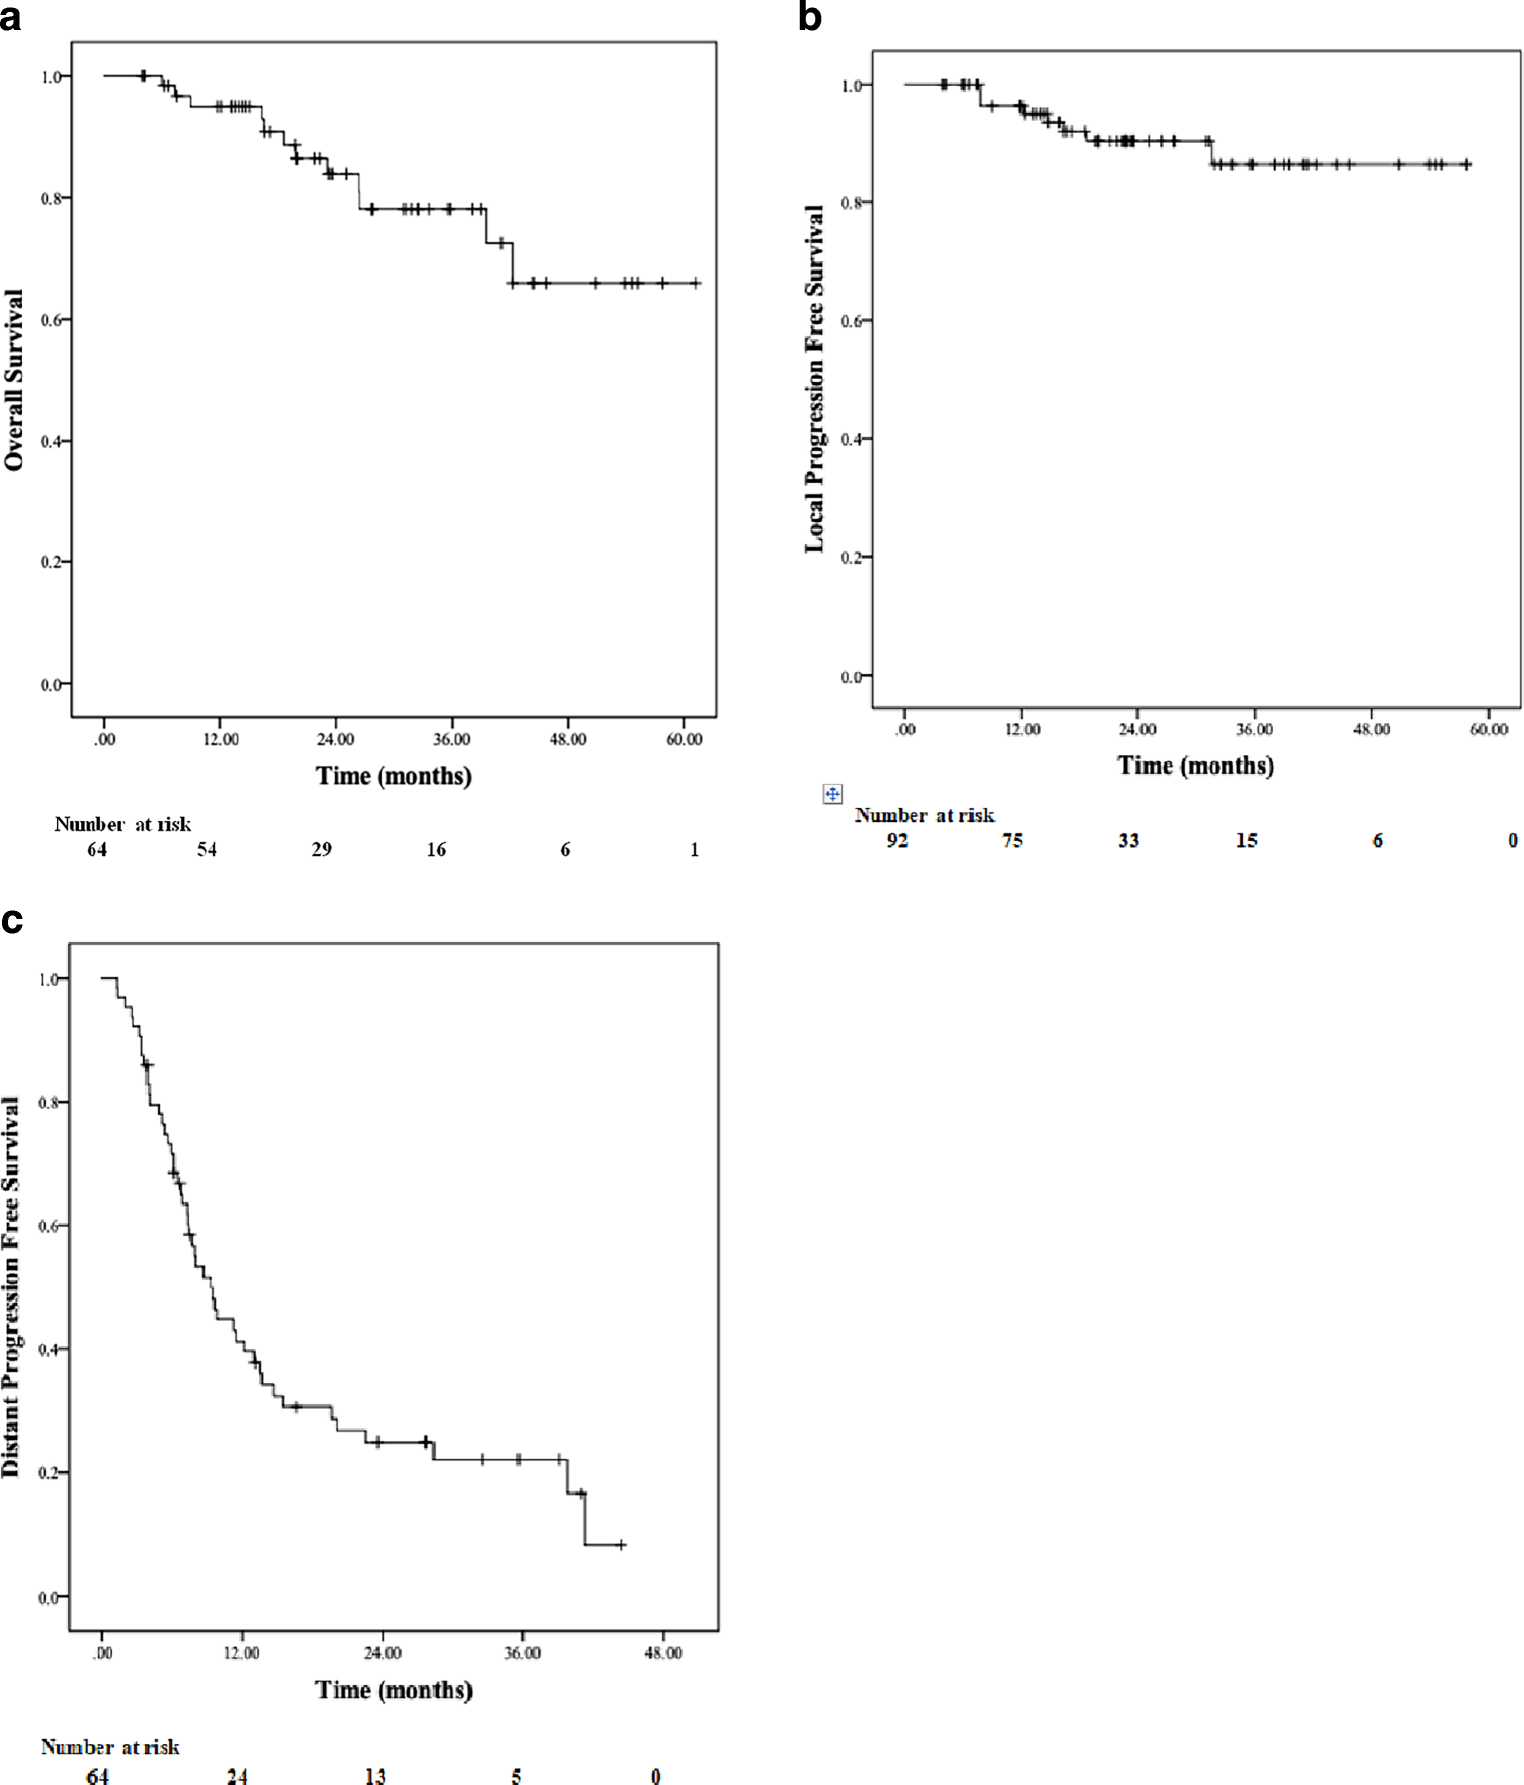
Table 2 Survival parametersThe median overall survival for patients with DM as FSMP vs. without DM was 25.5 (95% CI: 20.1–31.0) vs. 64.9 (95% CI: 34.3–95.4) months (p = 0.037). Median survival after onset of DM as FSMP was 11.9 months (range: 1.0–121). The overall survival of patients with isolated BM as FSMP was 27.4 (95% CI: 20.6–34.1) vs. 32.9 (95% CI: 11.7–54.0) months without BM (p = 0.657). Patients survived a median of 13.3 months after the diagnosis of BM (range: 1.3–121). Overall survival in patients presenting with ecDM as FSMP vs. without ecDM was 22.1 (95% CI: 14.4–29.8) vs. 40.1 (95% CI: 18.7–61.3) months (p = 0.034). These patients survived a median of 8.6 months (range: 1–98months). See also Fig. 1.
Fig. 1
Kaplan–Meier curves of overall survival for all patients with and without extracranial metastasis (ecDM) (a) vs. with and without brain metastasis (BM) (b)
In univariate analysis for the entire cohort, stratification into treatment groups A, B, and C was significantly associated with BMFS (p = 0.004), ecDMFS (p = 0.001), and DMFS (p = 0.016). Median BMFS was 14.9 (95% CI: 9.9–19.9) months in subgroup A, 20.6 (95% CI: 9.6–31.3) months in subgroup B and was not reached in subgroup C. The median ecDMFS was 16.3 (95% CI: 11.1–21.6), 12.9 (95% CI: 6.4–19.5) months and not reached, for groups A, B and C, respectively. Median DMFS for subgroups A and B was 14.7 (95% CI: 9.2–20.6) and 12.7 (95% CI: 5.6–19.9) months, and for subgroup C was 36.4 (95% CI: 21.8–51.1) months (see also supplementary figures 1–3).
Both, patients treated with simultaneous + maintenance nivolumab and patients treated with maintenance durvalumab were included in this retrospective cohort. We found no significant differences for OS (p = 0.841), PFS (p = 0.764), DMFS (p = 0.919), ecDMFS (p = 0.628) and BMFS (p = 0.668) between these subgroups. Therefore, we pooled them as an ICI cohort versus patients treated without ICI.
In patients who received ICI, median BMFS was 20.6 (95% CI: 14.4–26.9) months vs. 17.6 (95% CI: 12.9–22.3) for those without ICI (p = 0.005). Median ecDMFS was 16.9 (95% CI: 10.2–23.6) months vs. NR, respectively (p = 0.003). Median DMFS was 14.9 (95% CI 10.7–19.2) months vs. NR (p = 0.031). Median BMFS of patients over 65 was 20.1 (95% CI: 12.6–27.5) months vs. 25.6 (95% CI: 8.7–42.4) months in patients under the age of 65 (p = 0.016).
Patients who had a cMRI scan prior to treatment showed no significant difference in DMFS (p = 0.295) or BMFS (p = 0.189).
We analyzed the use of VMAT and observed significantly longer metastasis free survival in patients that received VMAT vs. patients with 3D-TRT. Median BMFS was 52.2 (95% CI: 22.1–82.3) vs. 14.9 (95% CI: 9.4–20.4) months (p = 0.001). Median ecDMFS was not reached vs. 14.9 (95% CI: 7.9–21.9) months (p = 0.001) and median DMFS was 25.6 (95% CI: 9.1–42.0) vs. 11.9 (95% CI: 6.7–17.2) months, respectively (p = 0.006).
GTV had significant impact on outcome in univariate analysis: DMFS was 26.3 (95% CI: 12.6–40.0) vs 10.8 (95% CI: 8.6–13.0) months (p = < 0.001), BMFS was 52.2 (95% CI: 20.2–84.2) vs 14.2 (95% CI: 10.5–17.8) months (p < 0.001) and ecDMFS was 64.9 (95% CI: 23.6–106.2) vs 12.7 (95% CI: 8.9–16.6) months (p < 0.001) for patients with GTV < 78 cc vs ≥ 78 cc, respectively. In the non-ICI cohort GTV had a significant negative impact on DMFS (p = 0.006), BMFS (p = 0.004) and ecDMFS (p = 0.007). In patients treated with ICI only BMFS (p = 0.030) was significantly impacted by GTV whereas DMFS (p = 0.074) and ecDMFS (p = 0.078) were not.
PTV ≥ 700 cc was significantly associated with shorter BMFS and ecDMFS. The median BMFS for patients with PTV ≥ 700 cc was 16.3 (95% CI: 11.0–21.7) compared to 50.3 (95% CI: 23.5–77.1) months for patients with PTV < 700 cc (p = 0.021). The median ecDMFS was 12.7 (95% CI: 8.6–16.8) vs. 55.2 (95% CI: 18.0–92.4) months (p = 0.008).
For the entire cohort, patients with a total lung V20 ≥ 30% had a median BMFS of 10.9 months (95% CI: 2.1–19.8) compared to 26.5 months (95% CI: 10.9–42.2) for patients with V20 < 30% (p = 0.001). The median ecDMFS was 10.6 months (95% CI: 6.2–14.9) vs. 27.2 months (95% CI: 15.1–39.3) for patients with V20 ≥ 30% and V20 < 30%, respectively (p = 0.005), and the median DMFS was 5.6 months (95% CI: 0.0–13.7) vs. 17.9 months (95% CI: 11.6–24.3) (p = 0.004).
In patients treated without ICI, stratification by year of treatment showed significant association with ecDMFS (p = 0.004) and DMFS (p = 0.047) and a trend toward longer BMFS (p = 0.061). In the non-ICI cohort, a significant association was found between the use of VMAT and BMFS (p = 0.021) and ecDMFS (0.013). For DMFS there was a trend (p = 0.054). The median BMFS was 14.1 months (95% CI: 10.1–18.3) for patients with PTV ≥ 700 cc and 24.7 months (95% CI: 12.1–37.4) for patients with PTV < 700 cc (p = 0.036). The median ecDMFS was 11.9 months (95% CI: 10.2–13.6) and 27.4 months (95% CI: 20.8–33.9), respectively (p = 0.006).
The median BMFS amounted to 11.2 months (95% CI: 4.6–17.8) for patients with SUVmax ≥ 13.75 vs. 21.1 months (95% CI: 13.9–28.3), for patients with SUVmax < 13.75 (p = 0.006). The median ecDMFS was found to be significantly longer in patients with a lower V20 (< 30) than those with a higher V20 (≥ 30). The same was observed for median DMFS and BMFS. Patients with higher SUVmax (≥ 13.75) also showed a trend towards shorter median DMFS. The p-values for these associations were 0.009 and 0.063, respectively.
V20 ≥ 30 was significantly associated with DMFS, ecDMFS and BMFS in the non-ICI cohort: Median BMFS was not reached for V20 ≥ 30 (p = 0.002) and V20 < 30. In Non-ICI patients, the median ecDMFS (p = 0.009) and the median DMFS (p = 0.020) were also significantly linked to V20 ≥ 30. The detailed results of the univariate analyses can be found in Table 3.
Table 3 Univariate analysisThe multivariate analysis for the entire cohort included use of immune checkpoint inhibitors (ICI), PD-L1-status ≥ 1%, stratification by treatment year, age over 65, T‑stage, V20 ≥ 30, GTV ≥ 78 cc PTV ≥ 700 cc and use of VMAT.
V20 ≥ 30 was significantly associated with BMFS [HR: 2.400 (95% CI: 1.396–4.126, p = 0.002)], and DMFS [HR: 1.784 (95% CI: 1.028–3.097, p = 0.040)].
GTV ≥ 78 cc had a significant negative impact on BMFS [HR: 2.100 (95% CI: 1.396–3.358, p = 0.002)], ecDMFS [HR: 1.739 (95% CI: 1.006–2.835, p = 0.027)] and DMFS [HR: 2.394 (95% CI: 1.485–3.858, p < 0.001)].
BMFS was significantly associated with Age ≥ 65 [HR: 1.629 (95% CI: 1.031–2.572, p = 0.036)].
In patients treated without ICI, a GTV ≥ 78 cc was also associated with shorter BMFS [HR: 1.976 (95% CI: 1.181–3.308, p = 0.010)] and DMFS [HR: 2.049 (95% CI: 1.181–3.554, p = 0.011)].
SUVmax ≥ 13.75 remained a predictor of short ecDMFS [HR: 2.420 (95% CI: 1.379–4.248, p = 0.002)] V20 ≥ 30 was significantly associated with shorter ecDMFS [HR: 2.883 (95% CI: 1.512–5.497, p = 0.001)] and BMFS [HR: 2.273 (95% CI: 1.301–3.970, p = 0.004)].
For detailed results of the multivariate analysis refer to Table 4.
Table 4 Multivarate analysisThe median post-progression survival in the entire cohort after onset of DM was 13.3 (95% CI: 6.0–20.6) months. Patients initially treated with ICI sowed a clear trend towards longer post-DM-survival of 20.7 (95% CI: 13.9–27.6) vs 7.8 (95% CI: 4.4–11.5) months (p = 0.052). The median survival after onset of DM in subgroup A, B and C were 7.2 (95% CI: 3.1–11.3), 7.8 (95% CI: 0.0–24.2) and 18.5 (95% CI 12.1–25.0) months, respectively (p = 0.243).
After BM patients in the entire cohort survived a median of 13.3 (95% CI: 6.4–20.2) months. Median post-BM-survival was not reached in patients who received ICI in the course of their initial treatment compared to 9.5 (95% CI: 2.0–16.9) months in those without ICI (p = 0.177). For subgroups A, B and C median post-BM-survival was 9.5 (95% CI: 0.0–22.6), 7.8 (0.0–17.9) and 13.3 (95% CI: 10.7–6.0) months, respectively (p = 0.787).
The median post-ecDM-survival was 8.6 (95% CI: 1.6–15.5) months in the entire cohort and 20.7 (96% CI: 15.4–26.1) vs 6.4 (95% CI: 3.5–9.4) months for patients initially treated with vs without ICI, respectively. In subgroup A it was 4.8 (95% CI: 1.1–8.5) months, in subgroup B it was 6.8 (95% CI: 0.0–27.7) months and in subgroup C it was 18.6 (95% CI: 2.1–35.1) months (p = 0.357).
Comments (0)