Patients included in this study
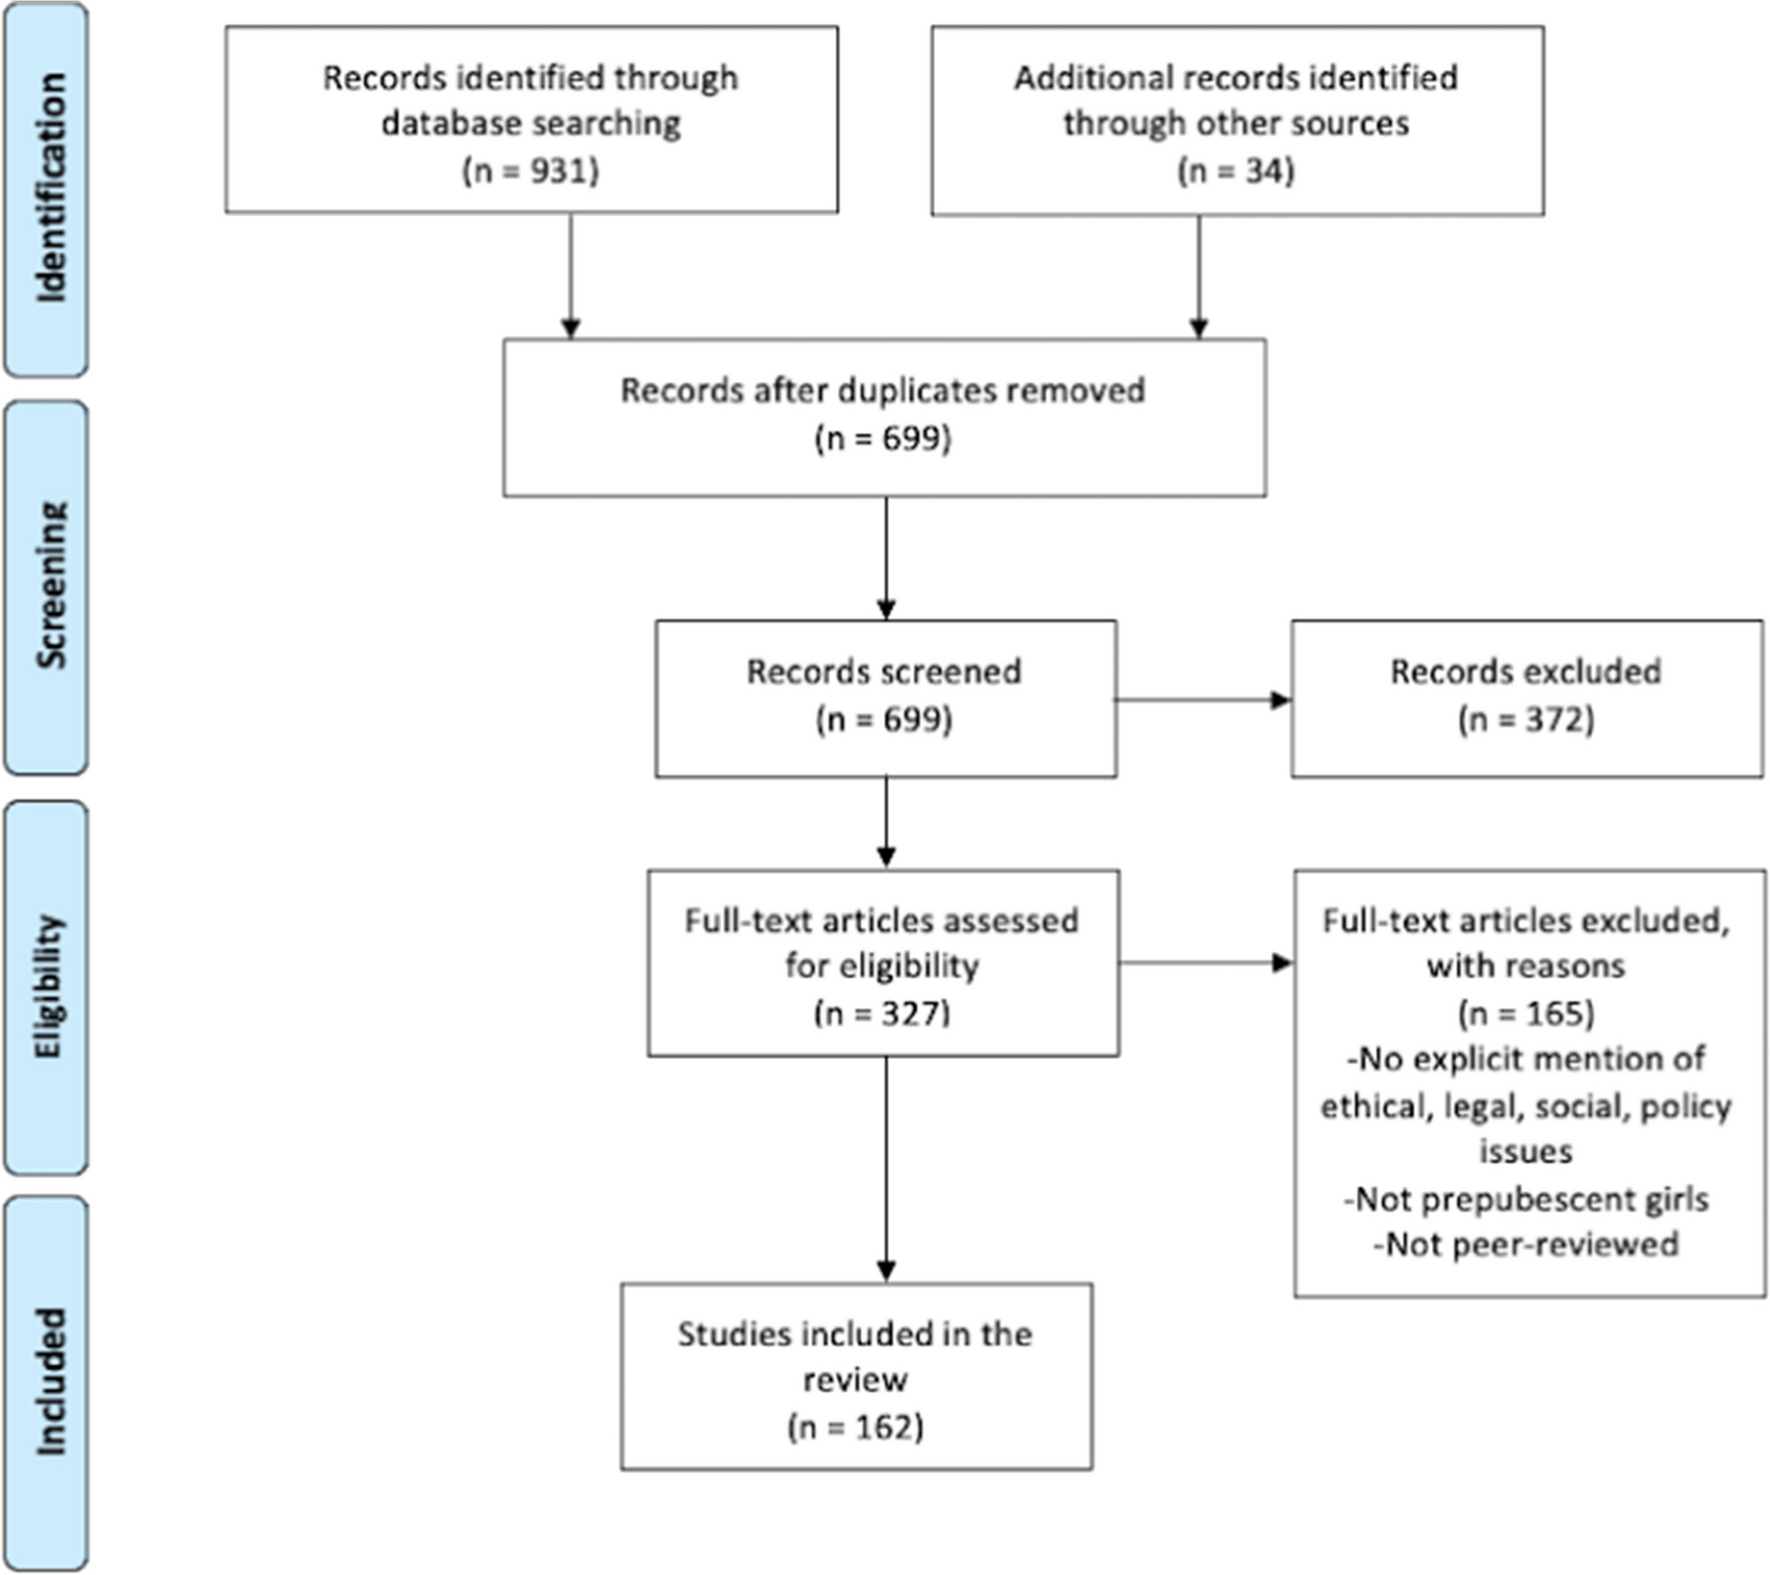
All participants underwent the initial cycle of in vitro fertilization/embryo transfer (IVF/ET) at the reproductive and genetic center of Shandong University of Traditional Chinese Medicine from January 2018 to January 2022. The calculation of the sample size was performed before the start of the study. Our study was considered a pilot, which aimed to gather at least 12–25 participants per group [21]. The participants included 31 women with PCOS (as a study group) and 31 patients with tubal factor infertility (as a control group). The diagnosis of PCOS was primarily based on the criteria established by the Rotterdam Society of Human Reproduction and Embryology/American Society of Reproductive Medicine, revised in 2003 [22]. All participants had no other endocrine system diseases, genital malformations, or chromosomal disorders and had not taken hormones or addictive drugs recently. The recruitment criteria for the PCOS group and the control group were similar, and participants in both groups had similar characteristics, including age, sex, and physical condition other than PCOS, to overcome selection bias [23].
All participants provided written informed consent, and the study was approved by the ethics committee of the Reproductive and Genetic Center of Shandong University of Traditional Chinese Medicine, approval no. SDTCM/E2110-03. All procedures performed involving human participants met the ethical standards of the institutions, national research committees, and 1964 Declaration of Helsinki and its subsequent amendments or similar ethical standards.
Ovarian stimulation and oocyte retrieval
Patients undergoing IVF/ET treatment initially received controlled ovarian hyperstimulation using medication that prevents the premature luteinization, including GnRH antagonists (ganirelix, Merck, Canada) in the follicular phase or triptorelin acetate (Synarel, Pfizer, Canada) in the luteal phase of the previous cycle to downregulate the pituitary gonadotropin-releasing hormone receptors and subsequent transduction pathways. On the second day of the menstrual cycle, appropriate human menopausal gonadotropin (hMG, Menopur, Ferring, Canada) or recombinant FSH (Puregon, Merck, Canada) were administered to stimulate follicular growth. When the diameter of the leading follicle reached > 18 mm or the diameters of at least three follicles reached > 17 mm, hCG (Pregnyl, Merck) was administered to trigger final oocyte maturation. Oocytes were retrieved under vaginal ultrasound-guiding 34–36 h after the trigger, and corresponding follicular fluid was collected.
Oocyte scoring criteria
The embryologists collected all the retrieved oocytes and evaluated the maturation of oocytes based on the following four perspectives [24]:
(1)
Cumulus size: large cumulus cells and loose arrangement (1 point); small or clustered cumulus cells and close arrangement (0 points).
(2)
Oocyte color and transparency: light and good transparency (1 point); dark and dim transparency (0 points).
(3)
Radial crown arrangement: radial crown cells arranged radially (1 point); radial crown cells did not disperse, or the radial crown was too divergent (0 points).
(4)
Oocyte visibility: the oocyte was visible under the microscope (1 point); the oocyte visibility was fuzzy and light in color (0 points).
According to the aforementioned scoring standards, oocytes with scores of 3–4 were considered of high quality.
In vitro fertilization and embryo culture
Fertilization was determined by observing the formation of the pronucleus after 17 h of insemination. When two different pronuclei containing nuclei (2 PN) were observed, successful fertilization was determined [25]. The morphology and quality of embryos were evaluated based on the cleavage of cells after 72 h. Grade I embryos included 7–9 cells with uniform germ layers and fragment rates of < 10%. The fragment rate of grade II embryos was between 11 and 25%. The cell division of grade III embryos was irregular, and the fragmentation rate exceeded 25% [26]. Grade I embryos were considered to be high-quality embryos. Grade I and II embryos were considered viable. Viable embryos were used to perform fresh embryo transfers or frozen-thawed embryo transfers.
Clinical outcomes
The oocyte maturation rate was defined as the number of oocytes that scored 3–4 divided by the total number of oocytes retrieved. The fertilization rate was defined as the number of fertilized oocytes divided by the total number of retrieved oocytes. The cleavage rate was defined as the number of cleaved embryos divided by the total number of fertilized eggs. The viable embryo rate was defined as the number of embryos available for transfer divided by the number of all cleaved embryos. The high-quality embryo rate was defined as the number of high-quality embryos divided by the number of all viable embryos. Clinical pregnancy was defined as the presence of a pregnancy sac and a fetal pole in the uterine cavity monitored by ultrasound at six weeks of gestation. The cumulative clinical pregnancy rate was defined as the number of clinical pregnancies divided by the total number of all transferred cycles. The main outcomes were measured by the high-quality oocyte rate and cumulative clinical pregnancy rate. The secondary outcomes were measured by the fertilization rate, cleavage rate, transferred embryo rate, and high-quality embryo rate.
Human ovarian granulosa cell line (KGN cells) culture
The human ovarian granulosa cell line (KGN cells) is a commonly used cell model for in vitro experiments to study ovarian functions because these cells are easy to isolate, culture, and transfect and can be analyzed by immunocytochemical methods [27, 28]. KGN cells were seeded (2–4 × 10⁵ per well) in six-well plates and were cultured at 37 ºC in 5% CO2 and 95% air. Dulbecco's Modified Eagle's Medium/Nutrient Mixture F-12 Ham (DMEM/F-12; Sigma Aldrich, USA) was used to culture the cells and was supplemented with penicillin (100 U/mL, Invitrogen, Life Technologies, USA), streptomycin sulfate (100 μG/mL, Invitrogen, Life Technologies, USA), glutamine (1x, Invitrogen, Life Technologies, USA), and 10% carbon/dextran treated fetal bovine serum (10%, HyClone, USA). The medium was changed every other day. All cells were resuspended in a serum-free medium for 24 h before the experiment. For concentration-dependent studies, cells were treated with BMP6 at different concentrations (1, 10, or 100 ng/mL) for 24 h. For time course studies, cells were treated with 100 ng/mL BMP6 for 3, 6, 12, or 24 h. Cells were harvested for reverse transcription-quantitative polymerase chain reaction (RT‒qPCR) and Western blot analysis to examine messenger RNA (mRNA) and protein levels, respectively. The PTX3 levels secreted in the culture medium were examined using an enzyme immunoassay.
Preparation and culture of primary hGL cells
The primary hGL cells used in the experiment were all isolated from the remaining follicular fluid obtained from patients undergoing IVF treatment at the reproductive and genetic center of the affiliated hospital of Shandong University of Traditional Chinese Medicine. The hGL cells were centrifuged and purified by density gradient centrifugation precipitation after collecting follicular fluid [29]. These cells were counted with a hemocytometer, and cell viability was assessed by trypan blue (0.04%) exclusion. Purified primary hGL cells were seeded (2 × 10⁵ cells per well in 12-well plates) and cultured in a humidified atmosphere of 5% CO2 and 95% air at 37 ºC. Cells were cultured in DMEM/DMEM/F-12 (Sigma-Aldrich Corp., Oakville, ON) supplemented with 10% fetal bovine serum (Hyclone, Logan, UT), 100 U/mL penicillin (Life Technologies, Inc./BRL, Grand Island, NY), 100 μg/mL streptomycin sulfate (Life Technologies), and 1 × GlutaMAX (Life Technologies). The culture medium was changed every other day. All cells were resuspended in a serum-free medium for 24 h before the experiment.
Antibodies and reagents (Table
1)
Table 1 Antibodies and reagentsReverse transcription quantitative real-time PCR (RT‒qPCR)
Cells were washed with cold phosphate buffered saline (PBS), and total RNA was extracted from hGL cells using TRIzol Reagent (Invitrogen, Life Technologies) according to the manufacturer's instructions. Typically, 2 μg of RNA was used to produce first-strand cDNA with random primers and Moloney murine leukemia virus (MMLV) reverse transcriptase (Promega, Madison, USA). Every 20-μL mixture contained 10 μL of 1X SYBR Green PCR Master Mix (Applied Biosystems, USA), 20 ng of cDNA template, and 250 nm of primer. The reverse transcription reaction conditions were as follows: 42 ºC for 40 min and 65 ºC for 10 min. After the reaction, cDNA was obtained and stored at − 80 ºC. The primer sequences used in this study are listed in Table 2. The primers used for the TaqMan gene expression assays were as follows: PTX3 (Hs00173615_m1), ACVR1 (ALK2, Hs00153836_m1), BMPR1A (ALK3, Hs01034913_g1), BMPR1B (ALK6, Hs01010965_m1), SMAD1 (Hs01077084_m1); SMAD5 (Hs00195437_m1), SMAD8 (HS001195441_m1), SMAD4 (Hs00929647_m1), and GAPDH (Hs02758991_G2) (Applied Biosystems, Foster, CA). PCR was performed using the Applied Biosystems 7300 real-time fluorescent quantitative PCR system. The RT-qPCR program and system conditions were as follows: 95 ºC for 3 min, followed by 95 ºC for 10 s and 60 ºC for 30 s, all for a total of 35 cycles. Three independent experiments were performed using different cultures, and each sample was repeated three times. Relative quantitative analysis of mRNA levels was performed using the comparative cycle threshold (CT) method, with GAPDH as a reference gene and the calculation formula 2−∆∆Ct. All primers used in this study passed the validation test.
Table 2 Primer synthesis informationWestern blot analysis
After washing with cold PBS, the cells were lysed in lysis buffer (Cell Signaling) containing a protease inhibitor cocktail (Sigma‒Aldrich). The cell lysates were centrifuged at 14,000 rpm for 15 min at 4 ℃, and the supernatants were subsequently collected. The protein concentration in the supernatant was quantitatively determined using the DC protein assay (Bio Rad Laboratories). Equal amounts of protein were separated using 10% sodium dodecyl sulfate‒polyacrylamide gel electrophoresis (SDS‒PAGE) and transferred to a polyvinylidene fluoride membrane. After 1 h of blocking with 5% nonfat dry milk in TBS buffer, the membranes were incubated overnight with relevant primary antibodies and washed three times with TBST buffer (TBS with Tween-20); the membranes were incubated for 1 h with appropriate peroxidase-conjugated secondary antibodies. The immunoreactive bands were detected by enhanced chemiluminescent substrate or SuperSignal West Femto Chemiluminescent Substrate (Pierce, Rockford, IL). The membranes were stripped with stripping buffer at 50 ºC for 30 min and reprobed with rabbit anti-SMAD1/5/8 or mouse anti-α-tubulin antibody as a loading control.
Small interfering RNA (siRNA) transfection
We used 25 nM of ON-TARGETplus SMARTpool or 25 nM ON-TARGETplus Non-Targeting Pool (Thermo Fisher Scientific; Lafayette, CO, USA) to decrease the level of ALK2, ALK3, ALK6, BMPR2, ACVR2A, ACVRR2B, SMAD1, SMAD5, SMAD8, or SMAD4 expression. Cells were cultured to 50% confluence in antibiotic-free DMEM/F12 medium containing 10% FBS and then transfected with 25 nM siRNA for 48 h using Lipofectamine RNAiMAX (13,778–150; Invitrogen, Life Technologies). SiCONTROL Non-Targeting Pool siRNA was used as the transfection control. The knockdown efficiency was confirmed by real-time quantitative RT-PCR or Western blot analysis.
Measurement of BMP6 and PTX3 by enzyme-linked immunosorbent assay
The cell culture medium was collected for the enzyme-linked immunosorbent assay. BMP6 and PTX3 protein production levels in culture medium or follicular fluid were measured by an enzyme immunoassay kit (R&D Systems) per the manufacturer's instructions. The levels of BMP6 and PTX3 were normalized to the protein concentration of each cell lysate. Each sample was measured three times.
Statistical analysis
The results were analyzed using SPSS Version 22. Comparisons between the two groups were performed by Student’s t-test or the Mann‒Whitney U test for continuous variables and the χ2 test for categorical variables. Spearman correlation analysis was applied to identify correlations between BMP6/PTX3 expression and clinical indicators. Experimental results were presented as mean ± standard error of the mean (SEM) based on at least three independent experiments. The results were analyzed by one-way analysis of variance followed by Tukey’s multiple-comparison tests using PRISM software (GraphPad Software, San Diego, CA). Data were considered significantly different if the P-value was < 0.05.


Comments (0)