
Remember me

We presented neural response patterns measured by human EEG and monkey LFP signals to descriptively demonstrate the consistency in several aspects of unique features across species at multiple levels. Here, multiple levels refer to the different levels of organization in the neural system from which neural signals can be measured, e.g., single neurons, collective neural populations, neural functional systems, major cerebral lobes. In doing so, our aim is not to quantitatively and systematically prove the consistency at a fine-grained level such as the precise timing, detailed waveshapes of the signals, neuroanatomical sources or types of neurons generating the compared signals, and specific cognitive processes involved. Rather, the aim is to demonstrate the existence of key non-trivial features across levels and facets and their consistency in different species, such as coexistence of oscillatory dynamics and evoked transient response activities, and coarse-grained structure of response waveshapes. The data were from tasks that present stimulus and generate response, but the specificity of the tasks was not particularly relevant here. Despite being coarse-grained, these cross-species consistency and cross-level and -facet coherency are sufficient to demonstrate non-triviality and place strong constraints to the model.
Figure 1 (left column) shows the key dynamic features of neural response activities measured from human scalp EEG. The time zero refers to the time point when the visual stimulus was presented. The superimposed single trials shown in Fig. 1a display a large amount of fluctuation reflecting the strong ongoing dynamic activity. Nonetheless, a systematic change of ongoing activity by stimuli in baseline shifting and oscillation suppression is clearly visible (Fig. 1a). The change of oscillation power can be more clearly seen in the band-pass filtered data. Figure 1b shows the same single trials of EEG data filtered within the bandwidth of 6–15 Hz to better show the dynamic change within alpha oscillation band (8–12 Hz) as a unique aspect of brain response. The alpha power is significantly suppressed during stimulus processing, and is restored after about 600 ms. This is a phenomenon commonly referred to as event-related desynchronization (ERD) which is associated with brain cognition and function [50–52). Figure 1c exemplifies the pattern of alpha suppression by a representative single trial EEG from Fig. 1b. To further present the temporal dynamic of alpha oscillation, we applied time–frequency wavelet analysis to the original single trial EEG data. The time–frequency representation averaged across trials reveals the detailed dynamic evolution of oscillations (Fig. 1d), from which we can see the change of alpha power (the dominant band around 10 Hz) along the time axis covering the stimulus processing. The alpha power is significantly decreased in the first few hundreds of milliseconds after stimulus onset (200 ms to 600 ms). Figure 1e and Fig. 1f show the average ERP response activity and the temporal pattern of alpha power (averaged within 8–12 Hz). The co-varying patterns of the temporal dynamics of ERP and ERD (alpha power) suggests a close relationship between these two different dynamic response activities.
Fig. 1
Key patterns of neural response activity from human scalp EEG (left column) and monkey LFP (right column). a Superimposed single trials of EEG data synchronized to stimulus onset from the occipital electrode PO9. b Same as (a) but band-pass filtered at 6–15 Hz to better visualize alpha waves. c An exemplified single trial from (b) showing clear post-stimulus alpha power suppression. d Time–frequency representation of single trial data in (a), averaged from all trials. e Average waveform of the single trials in (a), i.e., the event-related potential (ERP). f Average of the oscillation power in alpha band (8–12 Hz). g–i Same as (a–e) but for the LFP data from monkey. In (l), the curve was averaged from 10 to 15 Hz based on the alpha band observed in (j)
To show the common features of the brain response dynamics between human and monkey, in Fig. 1, right column, we presented the LFP activity from the monkey’s lateral intraparietal cortex during the brain responses to the stimuli. We showed the results of monkey LFP for various aspects in the same order as presented in human EEG (Fig. 1, left column), i.e., single trials, filtered single trials, an exemplified trial, time–frequency representation, averaged ERP response activity and alpha power.
Several unique characteristics consistently exist in the neural activities from human EEG (Fig. 1, left column) and monkey LFP (Fig. 1, right column), which are summarized below.
(1)Both show visually detectable, systematic response activities related to stimulus processing (Fig. 1a, e vs. Fig. 1g, k), within the first few hundreds of milliseconds after stimulus onset. Note that the two data types show different polarities because of the different depth of recording sites (Buzsáki et al. 2012).
(2)Both show similar patterns of alpha suppression (Fig. 1b, c, d, f vs. Figure 1h, i, j, l). Notably, the distributions of alpha bands are slightly different: in human EEG the alpha oscillation occupies 8–13 Hz (Fig. 1d) and in monkey LFP alpha occupies 10–15 Hz (Fig. 1j).
(3)The temporal patterns (including starting and ending time) of alpha suppression for human and monkey are similar (Fig. 1f vs. Figure 1l). Both are from around 200 ms to around 600 ms.
(4)Both show similar waveform patterns of trial-average response activities (ERP, Fig. 1e vs. Figure 1k): a sharp peak followed by a wide hump. For human EEG data, the peaks appear later and prolonged. This is likely due to the difference of cognition complexity between the two tasks where the one for human may involve larger scale cortical networks.
The above comparison between human EEG and monkey LFP suggests a fundamental and generic organization of neural dynamic system underlying the brain’s ongoing and response activities, which should be further rooted in the basic neuronal firing activities. To demonstrate the link between collective activity and neural firing we further compared the LFP with multiunit neuronal spike activities both recorded from the same monkey subjects.
Relationship between neuronal spikes and LFP in monkey’s cortexThe simultaneous recording of LFP and multiunit neuronal spike events allows us to examine the relationship between the spike activity and the collective activity pattern in LFP. The single trials of spike activity are plotted in Fig. 2a. It is visually apparent that the firing rate increased in response to the stimulus input, which demonstrates that the neurons were activated by the stimulation, and supports that firing rate carries information (Si and Sun 2021). The firing rate increasement is clearly visible in the firing rate curve calculated over the experimental trials shown in Fig. 2b (blue curve).
Fig. 2
Multilevel and multifaceted neural response pattern in monkey’s brain. a Single trial neuronal spikes. b The estimated temporal course of firing rate of spikes from the trials (calculated in a moving window of 5 ms) in comparison with LFP-ERP averaged over LFP trials. c Distribution of pre-stimulus inter-spike interval (ISI) from − 1000 ms to 0 ms. d Distribution of post-stimulus ISI (0–400 ms). e Characteristics of spike variability calculated by CV and FF parameters with a sliding time window of 100 ms
For comparison, we also plotted the time course of the average LFP across trials with respect to stimulus onset (Fig. 2b red curve), similar to ERP from human EEG. As shown, the response pattern of spike activity (in terms of firing rate) and the ERP from LFP (called LFP-ERP) are temporally closely associated with each other, as shown in the alignment of the starting points and covariation of the entire time course. Both firing rate and LFP-ERP curves resemble a typical ERP waveform from human brain corresponding to P1 and P3 components (Fig. 1). The temporal resemblance of firing rate and LFP-ERP provides concrete evidence on the common origin of the two signals from different levels of the underling neural circuits.
In neural coding, information may not be merely coded by neuronal firing rate (Kumar et al. 2010). It has been proposed that neural population maximizes the firing variability in resting state to best prepare for environmental uncertainty while reducing the variability in responding to the incoming signal (Friston et al. 2012; Cocchi et al. 2017). Therefore, in addition to firing rate pattern, we also examined other high order statistic features of spike activity in the aspect of variability, quantified by the coefficient of variance CV and the Fano factor FF described in the Method. The distributions of inter-spike interval (ISI) of the multiunit activities are shown in Fig. 2c, d for resting and processing states, which show that ISI is clearly reduced in the processing state. The time courses of CV and FF are shown in Fig. 2e. The CV value increased during stimulus processing whereas FF shows a clear reduction during response, indicating that the firing time of neurons becomes more irregular during the firing burst, but the rate is more reliable across trials.
These results from the empirical data clearly show close associations amongst neuronal firing rate and variability, ongoing oscillation patterns in LFP and EEG, the trial-averaged ERP and ERD (alpha suppression), and a high degree of consistency in these multifaceted dynamic features across human and monkey. The next question we want to address in this work is whether this high degree of coherency can be explained by the dynamics of a generic neural circuit network. To address this question, we studied a generic computational model of neural circuits based on the E–I balance neuronal network model described in the Method section.
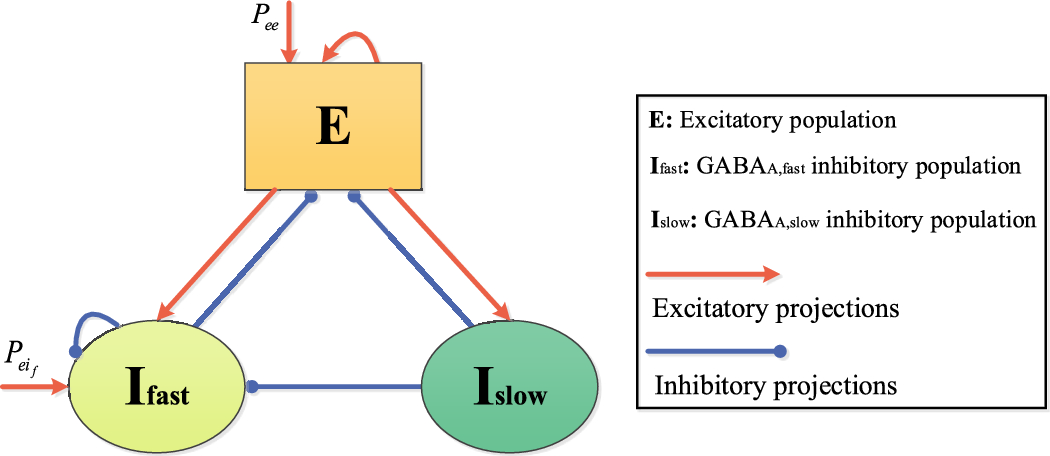
Unified explanation of neural activity in spikes, ERD and ERP based on a generic E–I balanced neuronal networkWe built the E–I balanced neuronal network model consistent with our previous work (Yang et al. 2017; Liang and Zhou 2022; Liang et al. 2020) (see Method) to understand the relationship between the microscopic and macroscopic neural activities revealed in the empirical data summarized above. We created a relatively dense network capturing the basic biological ingredients of dense connection among excitatory and inhibitory neurons in local cortical circuits, whose behavior is not a simple asynchronous state studied previously in large and sparse network (Vreeswijk and Sompolinsky 1996; Vogels and Abbott 2005, 2009), but jointly exhibits stochastic oscillations and critical avalanches in the presence of background input in a wide parameter region of coupling strength (Wang et al. 2011; Wang et al. 2016), consistent with experimental observations of oscillations and avalanches (Gireesh and Plenz 2008).
The dynamics of the network model changes with the coupling strengths \(\Delta _\) and \(\Delta _\). The network tends to be inactive if inhibitory couplings are too strong, but fires rather regularly with a high frequency if the excitatory couplings are too strong. In a broad intermediate range of the coupling strengths, the network self-organizes into effectively balanced states where neuronal spikes are irregular and weakly correlated. The critical state with low-rate irregular spiking can be obtained between the inactive and the regular states as the synchrony between neuronal spikes increases. Due to the finite size effect, the network in the critical couplings regime may also be occasionally initialized into a state exhibiting irregular activity with low synchrony and high firing rate that does not display power-law feature. We excluded these simulation realizations of low correlation and only considered the states exhibiting criticality, which is robust to the system sizes and external input (Liang and Zhou 2022). For efficient of computation, we simulated a reasonably small network size of 500 neurons.
The behavior patterns of the neural network model with 500 neurons under background input are summarized in Fig. 3. The LFP signal represented by synaptic current \(\left|_\right|+\left|_\right|\) resembles the 10 Hz oscillatory pattern (Fig. 3a) in empirical data, though the latter is smoother, likely due to larger neural population. The power spectrum of the LFP signal is presented in Fig. 3b. The alpha stochastic oscillation persists across a broad range of input rate under random weak inputs, as shown by the peak frequency and power as functions of the background input rate in Fig. 3c and d. The alpha oscillation exists under the range of 10–40 Hz background input rate for each neuron. Under weaker input (< 10 Hz), the network cannot be activated to maintain ongoing activity and keeps silent. Stronger inputs (> 40 Hz) induce fluctuating activities with higher and broader frequency band. The change of frequency in the gamma band with external input was also observed previously in the model (Liang and Zhou 2022).
Fig. 3
Dynamical patterns of E–I balanced network with background input at critical state. In a, b, e and f, the coupling parameters are \(\Delta _=5.0, \Delta _=0.4,\) and the background input rate is 20 spikes/second for each neuron. a LFP of the network. b Power spectrum of the LFP signal in (a). c, d Changes of peak frequency and peak height of the power spectrum as a function of the background input rate. e Distribution of the size of neuronal avalanches at \(\Delta _=0.2, 0.4, 1.0\). The red line is a power-law function fitted to the distribution at \(\Delta _=0.4\). The K-S test p-value is 0.37. f Deviation of avalanche size distribution from the best-fitting power-law function versus the excitatory coupling strength. To discard the cutoff, the distribution curve above \(5\times ^\) was used in the power-law fitting. g The balance of excitatory and inhibitory couplings represented by the ratio of the mean synaptic current of a neuron to its mean excitatory synaptic current. The currents are averaged over a time window of 2000 ms and the ratio is averaged over all neurons in the network. The background input rates are 20 Hz, 30 Hz, and 40 Hz for results represented by black squares, red circles, and green triangles, respectively
This model brings collective network oscillation and irregular neuronal spiking into co-existence, supported by the critical state of the network due to E–I balance. Our recent theoretical study using mean field model showed that such co-existence is related to a Hopf bifurcation from fixed point to oscillatory state in the mean field (Liang et al. 2020). The power-law distribution of neuronal avalanche size is the fingerprint of the critical state (Gireesh and Plenz 2008). For fixed inhibitory coupling \(\Delta _=5.0,\) the avalanche size distributions in Fig. 3e for various values of excitatory coupling strength \(\Delta _=0.3, 0.4, 1.0\) show a transition from subcritical to supercritical firing. We recorded the size of each avalanche (52,000 in total) in the network with ∆gex = 0.4 under the stimulus of 30 Hz. The distribution of avalanche sizes was fitted into doubly truncated discrete power law using the method of maximum-likelihood estimation to find the ranges that pass the truncation-based Kolmogorov–Smirnov (K–S) statistics test (with p values larger than 0.2). The fit range satisfying p > 0.2 was automatically detected by the NCC toolbox (Marshall et al. 2016) as between 9 and 253. With this fit range, the K-S test p-value is 0.37. Therefore, the truncated power law is an acceptable fit of the avalanche size distribution. To further quantify the transition, we calculated the deviation of the distribution from the best-fitting power-law function (Wang et al. 2011, 2016) with different excitatory coupling strength \(\Delta _\), under different background input rates. The deviation is minimized in the critical state. The curve of the deviation shows that the critical state appears at around \(\Delta _=0.4\) for a range of background input rates that generates alpha-band stochastic oscillations (Fig. 3f).
We also investigated what role the balance between excitatory and inhibitory currents in the network plays in the co-existence of the multilevel activity. The network is silent when the excitatory coupling strength \(\Delta _<0.2\). As \(\Delta _\) increases, both excitatory and inhibitory neurons are activated. Inhibition first dominates the network and is later counter-balanced by excitatory synapses, approaching zero mean (balanced) synaptic current at around \(\Delta _=0.4\) (Fig. 3g), which matches the minima of the deviation of avalanche size distribution from power-law function (Fig. 3f). At the E–I balance, the dynamics of neurons are driven by fluctuations and self-organize into critical spiking avalanches and generate collective stochastic oscillations in the alpha band due to an accumulation-and-release process (Wang et al. 2016), theoretically associated to Hopf bifurcation in the corresponding mean field model (Liang and Zhou 2022; Liang et al. 2020). The peak frequency and power of the alpha band vary as functions of the background input strength (Fig. 3c, d).
These results show that a generic neuronal network capturing the basic biological features of local densely connected neural circuit and conductance-based excitatory and inhibitory neurons with E–I balance can simultaneously produce the multilevel ongoing neural dynamics of irregular firing, critical avalanches and alpha band stochastic oscillations as typically observed in experimental data.
Next, we studied the response of the network at the critical ongoing state to model the generation of ERP and ERD in association with the changes in spiking, as observed in the experiments. The external input given to the critical-state network was simulated according to an alpha-functionFootnote 1\(r = ate^}}\) for the spike rate as illustrated in Fig. 4a, starting from t = 0. The maximal rate reached at \(t = \tau\) is \(r_ = a\tau /e\). We set \(\tau\) = 50 ms, and \(r_ = 200\) Hz.
Fig. 4
Response of the neuronal network to external input under different ongoing states. Left column a–g: critical state with \(\Delta _=0.4\) and \(\Delta _=5.0\); Middle column h–n: subcritical state with \(\Delta _=0.25\) and \(\Delta _=5.0\); Right column o–u: supercritical state with \(\Delta _=1.0\) and \(\Delta _=5.0\). a, h, o: Spike rates of the external input signal. b, i, p an exemplified single trial of LFP signal of the network. c, j, q Time frequency representation of the LFP signal, averaged over 100 trials. Warmer color represents higher power. d, k, r: Time evolution of alpha power (8–12 Hz). e, l, s LFP-ERP waveform. f, m, t Spike raster of 20 randomly selected neurons in the network. g, n, u Firing rate of the network. The alpha power, LFP-ERP and firing rate were obtained by averaging over 1000 trials
The alpha oscillation in LFP signal is suppressed due to the external input (Fig. 4b) and is recovered later when the input vanishes. The alpha suppression is also clearly presented in the time frequency plot (Fig. 4c) and in the time course of alpha power in LFP (Fig. 4d). The LFP-ERP averaged across trials (Fig. 4e) shows a small sharp peak shortly after stimulus onset, followed by another broader peak, qualitatively similar to the ERP from monkey LFP (Fig. 1).
The changes in the oscillation patterns and ERP are rooted in the neuronal spike activities in the network. The spike raster (100 trials) shows that the input stimulus increases the neuronal firing rate (Fig. 4f), which is expected to reduce alpha power according to the relationship shown in Fig. 3. To mimic the experimental measurement of multiunit spikes of the neurons close to the electrode, here 20 randomly selected neurons were used to simulate the multiunit spike activity. The average spike rate (for each neuron) across trials (Fig. 4g) also exhibits a sharp peak followed by a broad one, very similar to the ERP pattern. The ratio of the peak rate of the response to the ongoing activity is about 3, which is also similar to the monkey firing data (Fig. 3). The results above show that when the ongoing dynamics of network operates at the E–I balanced region (at critical states), the response to external stimuli can simultaneous produce the co-varying patterns of firing rate, ERP and ERD as consistently observed in human EEG and monkey LFP. The response features presented above for a given stimulus duration and strength are robust against the duration and strength of the stimuli, see S1 Fig in Supporting Information.
The behavior of the critical state neural network model persists in large modular networks built by coupling the small dense modules through sparser inter-modular connections. Starting from random initial conditions, the activities from other modules act as the background input to each module, thus the modular network can self-sustain ongoing activity without the need of adding additional background activity. In the modular network, each module is also in the critical state. The avalanche size distribution of modules and the response to external stimulus are shown in S2 Fig in Supporting Information, which are also qualitatively similar to experimental observations.
Different from the oscillatory patterns in the collective behavior of the circuits, the single neurons fire spikes irregularly, as revealed by a broad distribution of inter-spike intervals with a slightly preferred spike interval around 100 ms (Fig. 5a) due to the modulation from the collective alpha oscillations. The value of CV (1.28) from the ongoing dynamics of the model is at the same level of what was commonly found experimentally (CV ~ 1–1.5, according to Shadlen and Newsome (1998)), also quite close to the CV values of pre-stimulus stage of the monkey multiunit data in Fig. 2e. Along with the change of the firing rate, the temporal variability and the trial-to-trial variability of the firing activity are also changed (Fig. 5b), which is consistent with the results from monkey cortex (Fig. 2e).
Fig. 5
Variability of neuronal spiking from the network in critical states. a Distribution of ISI of neurons with background activity. b Temporal variability (CV) and cross-trial variability (FF) of spikes, calculated in a moving window of 100 ms. External stimulus is added at t = 0. The network parameters and the input rate are the same as the Fig. 4a–g
We emphasized that the simultaneous reproduction of the multilevel and multifaceted key features in the experiments by the same model only occurs when the network is operating around critical states. In sub-critical states, the network with weak background input has very sparse activation (Fig. 4m) and the avalanche size distribution strongly deviates from a power-law function (Fig. 3e). Before the onset of the stimulus, the background input could not generate ongoing oscillations in the single trial LFP (Fig. 4i), and the stimulus generates irregular LFP with a broad range of frequencies (Fig. 4j) due to the transient burst of firing of the neurons (Fig. 4m). The change of alpha power, waveform of ERP and average firing rates are substantially different from experimental data, though ERP and firing rate curve still display a sharp pulse followed by a lower peak. At super-critical states (Fig. 4o-u), the ongoing activity and the response of neural networks also differ from experimental data. The avalanche size distribution shows higher probability of large avalanches (Fig. 3e). The ongoing activity displays very regular oscillations (Fig. 4p). The oscillation is so regular that there are multiple peaks on the power spectrum. Such pattern is rarely seen in experimental data. The stimulus input shifts the central frequency of the ongoing oscillation instead of suppressing its power (Fig. 4q).
Comments (0)