
Remember me


Kidney stone disease is a common pathology, affecting up to 20% of men and 10% of women by age 70 years with a recurrence rate of approximately 50% at 5 years.1,2 Our understanding of the pathophysiological processes underlying kidney stone formation is incomplete, preventing effective prophylaxis in many cases.2
Observational studies indicate that general adiposity (body mass index [BMI]) and central adiposity (waist–hip ratio [WHR] and waist circumference [WC]) are associated with an increased risk of kidney stone disease.3 Metabolic syndrome includes central obesity, hypertension, dyslipidemia, and impaired glucose tolerance, all of which have been postulated to increase risk of kidney stone formation.4,5 The mechanisms linking obesity and metabolic syndrome with an increased risk of kidney stone disease are uncertain but may include hyperuricosuria and hyperoxaluria, hyperinsulinaemia resulting in hypercalciuria, insulin resistance causing impaired renal ammonium generation and hypocitraturia, hypertension altering the urinary lithogenic profile, and vascular insult modifying renal papillary circulation.3,6–8 Increasing adiposity has also been linked to alterations in serum concentrations of calcium, phosphate, vitamin D, and urate, all of which may affect risk of kidney stone disease.9,10 Furthermore, obesity increases serum markers of systemic inflammation, and inflammation has been postulated to increase risk of kidney stone disease.11
Conventional epidemiologic studies may be subject to bias, particularly from reverse causality and confounding.12 Mendelian randomization (MR) is a genetic epidemiological technique that aims to overcome these problems, using genetic variants associated with an exposure to reduce bias in identifying causal effects and their magnitude and allow direction of effect to be established.12,13 Furthermore, multivariable and mediation MR facilitate the identification of independent causal effects and estimation of the relative importance of multiple exposures.12,13 Recent studies have used MR techniques to increase understanding of the pathogenesis of kidney stone disease and its relation to adiposity and metabolic syndrome14,15; however, the relative contributions of central and general adiposity have not been assessed using multivariable techniques, nor have mediators of effects of adiposity on risk of kidney stone disease been identified. In this study, we use both conventional and genetic epidemiological approaches to demonstrate that increased central adiposity is causally associated with kidney stone disease, independent of general adiposity, and that the influence of central adiposity on kidney stone risk is due, in part, to increasing serum calcium concentrations. In contrast to previous smaller studies, we find no evidence that other components of the metabolic syndrome, serum uric acid levels, or biochemical markers of inflammation are causally associated with nephrolithiasis.14,15
Methods Study ParticipantsThe UK Biobank recruited 502,000 individuals aged 40–69 years from 2006 to 2010. Participants provided health-related questionnaires, physical measurements, and blood samples and consented to linkage of data to medical records.16 UK Biobank is approved by the National Information Governance Board for Health and Social Care and the National Health Service North West Centre for Research Ethics Committee (Ref: 11/NW/0382). Kidney stone cases were identified using International Classification of Diseases (ICD) revisions 9 and 10, Office of Population Censuses and Surveys Classification of Surgical Operations and Procedures (OPCS) revisions 3 and 4, and self-report codes (Supplementary Tables 1 and 2).
FinnGen (https://www.finngen.fi/en) is a prospective study combining data from Finnish biobanks and digital health record data from Finnish health registries using personal identification numbers. The Coordinating Ethics Committee of the Helsinki and Uusimaa Hospital District has evaluated the project.17 FinnGen release R8 comprises genetic data for 342,499 individuals (190,879 female participants and 151,620 male participants), 20,175,454 genetic variants, and 2202 disease end points in individuals of Finnish ancestry.17 Kidney stone cases were identified using ICD-8, -9, and -10 codes for calculus of kidney and ureter.18
Observational AnalysesObservational analyses were undertaken in the UK Biobank, excluding participants with missing or extreme (top/bottom 0.001%) values of anthropometric measurements, prevalent kidney stone disease, or conditions predisposing to kidney stone formation (Supplementary Table 3). Participants were censored at earliest diagnosis of kidney stone disease, death, loss to follow-up, or February 28, 2018 (Wales) or March 31, 2021 (England and Scotland).
Hazard ratios (HRs) for associations of general adiposity (BMI) and central adiposity (WHR and WC) with incident kidney stone disease were estimated using Cox proportional hazards regression models (Figure 1). Models were stratified by age at risk (in 5-year groups) and ethnicity (White, Other). Given the association of deprivation with obesity and kidney stone disease,19,20 we adjusted models for the Townsend Deprivation Index (quintiles) as well as smoking (never, former, current), alcohol drinking (never, former, occasional, at least weekly), and, where appropriate, sex. Associations were corrected for regression dilution using correlations between resurvey and baseline measurements (i.e. to estimate associations with long-term average levels); hence, the values reported in the observational analysis represent the association with the average usual levels of the anthropometric measure.21
 Figure 1:
 Study design. Analyses undertaken to explore associations of adiposity and kidney stone disease. (A) depicts observational analyses in the UK Biobank using Cox proportional hazards regression models to address question 1 (Q1): Does adiposity associate with increased risk of kidney stones? (B) depicts genetic epidemiological analyses using univariable and multivariable Mendelian randomization techniques to address questions 2 (Q2): Does adiposity affect kidney stone risk? and 3 (Q3): Do potential mediators of effects of adiposity on kidney stone risk influence risk of kidney stone disease? Where a potential mediator (X) of effects of adiposity on kidney stone risk was found have effects on kidney stone disease, genetic analyses were undertaken to answer question 4 (Q4): Does adiposity have effects on X? Kidney stone outcomes were based on kidney stone genome-wide association studies (GWAS) summary statistics from the UK Biobank, FinnGen, and a meta-analysis of these two GWAS datasets.
Anthropometric measures were categorized into fifths separately in men and women, with HRs reported relative to the lowest category. Confidence intervals (CIs) were calculated using variance of the log risk.22 Linear associations (reported per 5 kg/m2, 0.05, and 10 cm higher BMI, WHR, and WC, respectively) were used to facilitate comparison of estimates between male and female subsets. To assess the relative independence of anthropometric measures, associations with BMI were adjusted for WHR and WC and associations with WHR and WC by BMI. χ2 values were derived from likelihood ratio statistics.23 This statistic provides a significance test for the improvement in fit from including the main adiposity term and a quantitative measure of the extent to which the adiposity term improves risk prediction in different models (e.g. with and without adjustment of other adiposity terms).
The effect of WHR on albumin-adjusted serum calcium concentrations in male participants and female participants was evaluated in a linear regression model adjusted for age. Analyses were performed using Rv4.1.1.
Genome-wide Association Studies and Meta-analysisGenome-wide association studies (GWAS) were performed in the UK Biobank, excluding participants with conditions predisposing to kidney stone disease (Supplementary Table 3). Genotyping was undertaken using UK-BiLEVE and UK-Biobank Axiom Arrays and called using array intensity data and a custom genotype-calling pipeline.24 PLINKv1.9 and Rv3.6.1 were used for quality control (QC). Sample-, individual-, and SNP-level QC exclusions are shown in Supplementary Methods.
UK Biobank phasing on autosomes was performed with SHAPEIT3 using the 1000 Genomes phase 3 dataset as a reference panel. The Haplotype Reference Consortium reference panel and a merged UK10K/1000 Genomes Phase 3 panel were used in imputation. The resultant dataset comprised 92,693,895 autosomal SNPs, short indels, and large structural variants.24
A total of 547,011 genotyped and 8,397,548 imputed autosomal SNPs and 733,758 genotyped and 2,635,881 X-chromosome SNPs with MAF ≥0.01 and Info Score ≥0.9 were used at GWAS, using a linear mixed noninfinitesimal model implemented in BOLT-LMMv2.3.25 BOLT-LMM accounts for genetic relationships between individuals. The hg19 reference genetic map and reference linkage disequilibrium (LD) score file for European ancestry were used. Genotyping platform and sex were incorporated as covariates. In X-chromosome analyses, multiallelic SNPs, SNPs of differential missingness between male participants and female participants (P<5×10⁻⁷), or Hardy–Weinberg equilibrium P<1×10⁻⁶ in female participants were excluded. Male genotype was specified as 0/2 and female genotype as 0/1/2 corresponding to a model of random X inactivation. Pseudoautosomal and nonpseudoautosomal SNPs were merged.25 Quantile–quantile and Manhattan plots were generated in FUMA.26 Conditional analyses were performed using QCTOOLv2.
A fixed-effects meta-analysis of kidney stone disease was undertaken using UK Biobank and FinnGen kidney stone GWAS summary statistics for autosomes and the X-chromosome.17,18 FinnGen r8 GWAS data are publicly available for the phenotype N14 calculus of kidney and ureter comprising 8597 cases and 333,128 controls.17,18 Information on sample phenotyping, genotyping, and GWAS in the FinnGen sample has been previously described.17 SNPs with MAF <0.01 were omitted from FinnGen summary statistics. The FinnGen study GWAS summary statistics do not report sex-specific datasets, precluding sex-stratified analyses. Meta-analysis was undertaken in METAL using inverse-weighting of log odds ratios.27 SNPs with a high level of heterogeneity between studies (I2 statistic >75%) were excluded. The resultant summary statistics were used to perform MR analyses.
Multiple Association Signals at Kidney Stone Disease Risk Loci (Genome-Wide Complex Trait Analysis)A GWAS locus was defined as a chromosomal region with adjacent pairs of kidney stone disease-associated SNPs <1 Mb apart.28,29 To identify the presence of distinct association signals at genome-wide significant loci, Genome-Wide Complex Trait Analysis (GCTA) software version 1.94.1 was used to perform step-wise approximate conditional and joint analysis with the same UK Biobank LD reference panel as was used in the UK Biobank kidney stone disease GWAS.28,30 Where there was a single signal of association at a locus, we defined the index SNP as the lead SNP from unconditional meta-analysis. For loci with multiple association signals, we defined the index SNP as that with the lowest P value in conditional approximate analysis.
Heritability of Kidney Stone Disease, Polygenicity, and Population StratificationEstimates of genomic inflation and the heritability of kidney stone disease in each cohort and subsequent meta-analysis were obtained using LD score regression (LDSC) v1.0.1.27,28 Analyses were restricted to variants present in HapMap3 (https://www.sanger.ac.uk/resources/downloads/human/hapmap3.html) and LD Scores computed using 1000 Genomes European data (https://data.broadinstitute.org/alkesgroup/LDSCORE/eur_w_ld_chr.tar.bz2).29 For liability transformations, a population prevalence approximation of 10% was used. To assess similarity of genetic effects between cohorts, the cross-trait LD Score Regression (LDSC) v1.0.1 was used to calculate pairwise genetic correlations (rg) on the basis of summary statistics from each cohort for variants present in HapMap3.27,28
Gene and Gene Set-Based AnalysesTo identify genes and gene sets associated with kidney stone disease on the basis of effect estimates from meta-analysis, MAGMA v1.1031 was used. MAGMA summarizes variant-level P-values according to gene positions and LD structure. Variants were mapped to 18,143 genes based on rsID. For each gene, associations with kidney stone disease were determined using a SNP-wise mean model, where LD patterns were calculated using ancestry appropriate 1 KGP reference genotypes. Statistical significance of associations with kidney stone disease was defined using a Bonferroni-corrected threshold of P=0.05/18,143=2.76×10−6. To identify biological pathways or cell types implicated in kidney stone disease, gene-based test statistics were used to perform a competitive set-based analysis of 15,685 Human Phenotype Ontology (HPO) GO term-based gene sets downloaded from the Molecular Signature Database v2022.1 (https://www.gsea-msigdb.org/gsea/msigdb/collections.jsp).31–33 Bonferroni-corrected P-value thresholds were used to identify HPO gene sets and genes within each gene set showing significant overlap with kidney stone meta-analysis summary statistics (P=0.05/18,685=2.68×10-6 and P=0.05/number of genes in gene set, respectively). Functional Mapping and Annotation of genetic associations (FUMA) v1.3.0 (https://fuma.ctglab.nl/) Gene2Func module was used to identify differential gene expression in GTEx v8 kidney cortex tissue.26
Mendelian RandomizationMR analyses use genetic instrumental variables (IVs) to interrogate causal effects of an exposure on an outcome.34 Three key assumptions underlie the principles of MR: that IVs are associated with the risk factor of interest (relevance), that IVs only affect the outcome through their effect on the exposure variable (exclusion restriction); and that there are no unmeasured confounders of the associations between IVs and the outcome (independence).34,35
MR analyses were performed for IVW, MR-Egger, weighted median, contamination mixture, and multivariable analyses using MendelianRandomization and TwoSampleMR in R.12,36,37 SNPs with independent, GWAS-significant (P<5×10⁻⁸) associations with phenotypes of interest in individuals of European ancestry were selected as IVs from relevant studies for summary statistic Mendelian randomization (Supplementary Table 4). For increased stringency, and to minimize risk of type-1 error from IVs being in linkage disequilibrium, further pruning of IVs was undertaken using the clump_data() function with clump-r2 set at 0.01 using a European population reference panel. Genetically proxied measures of adiposity (BMI,38 WHR,38 WC,38 and visceral, abdominal subcutaneous, and gluteofemoral fat depots39) were identified from relevant studies to facilitate MR studies to ascertain whether adiposity increases kidney stone risk (Figure 1).
To investigate the mechanisms by which general and central adiposity influence risk of kidney stone disease, investigations were undertaken in two steps: First, MR was used to determine whether risk factors for kidney stone disease identified by conventional epidemiologic studies had causal associations with kidney stone disease; subsequently, where causal effects on kidney stones were identified, MR was used to assess the effects of adiposity on these kidney stone risk factors (Figure 1). Genetic proxies of risk factors for kidney stone disease that were considered included features of the metabolic syndrome (type 2 diabetes,40 2-hour glucose tolerance,41 fasting glucose,41 fasting insulin,41 HbA1c,41 HDL cholesterol,42 LDL cholesterol,42 triglyceride concentrations,42 and systolic and diastolic bloods pressure43), serum and urinary biochemical phenotypes (24-hour urinary calcium [personal communication with G. Curhan], serum 25-hydroxy vitamin D, albumin-adjusted calcium,44 phosphate,44 and urate concentrations45), heel bone mineral density,46 and markers of inflammation (serum apolipoprotein-B42 and C-reactive protein concentrations47) (Supplementary Tables 4 and 5). Outcome IVs for kidney stone disease were derived from summary statistics generated by UK Biobank and FinnGen GWAS for kidney stone disease, and meta-analysis, described above. Mean and SD of IV R2 were reported to evaluate the proportion of variability explained by the IVs (Supplementary Table 4).
Exposure and outcome data were harmonized for exposure phenotypes with three or more associated, significant, independent SNPs, and allele frequencies were used to infer positive strand alleles for palindromic IVs. Where harmonization was not possible and the positive strand alleles remained ambiguous, IVs were omitted from analysis. MR-Egger and inverse-variance weighted (IVW) analyses were undertaken for all exposure–outcome pairs. Where MR-Egger regression intercept estimate was zero (P>0.05), IVW was interpreted as estimate of best fit. Where MR-Egger intercept estimate suggested potential horizontal pleiotropy (P<0.05), MR-Egger regression was interpreted as estimate of best fit.48 In instances where there was ambiguity surrounding results, further estimates were considered, including weighted median and contamination mix methods. All IVW P-values were adjusted for multiple testing using the Benjamini–Hochberg false discovery rate method, controlled at 5%, to account for exploring the relationships of numerous obesity and metabolic traits with kidney stone disease.49 To investigate reverse causality, bidirectional MR analyses were performed. Where significant exposure–outcome relationships were identified on univariable MR or where the Steiger test for directionality demonstrated that IVs explained greater variance in the exposure than the outcome, Steiger filtering was undertaken as a sensitivity analysis.50 Mediation analyses were performed to identify direct and indirect effects as previously reported.12 In brief, the direct effect of an exposure on an outcome (c′) and on a mediating variable (A) are estimated, as is the effect of a mediating variable on the outcome (B). The indirect effect of a mediating variable on the outcome is the product of the effect of the exposure on the mediator and the mediator on the outcome (A × B). The proportion mediated effect is the quotient of the indirect and the total effect (Supplementary Figure 1).
To assess the plausibility of the core IV assumptions, mean F statistics and total R2 across SNPs used as exposure IVs were calculated using the following formulas where the genetic association with the risk factor (â) is in standard deviation units, MAF is the minor allele frequency, N is the sample size for the IV–outcome association, and K is the number of IVs (Supplementary Table 4)51–53:R2=2â2x MAF x (1−MAF)F=R2(N−1−K)(1−R2)K
F statistics ranged from 0.01 (serum phosphate concentration) to 62.41 (systolic blood pressure), and mean R2 ranged from 2.76×10⁻⁶, SD=9.69×10⁻⁷ (serum phosphate and UK Biobank kidney stone disease), to 0.035, SD=0.034 (systolic blood pressure) (Supplementary Table 4). Probability of weak instrument bias and type 1 error from participant overlap between study cohorts for BMI, WHR, and kidney stone disease in UK Biobank were calculated as 0.001 and 0.05, respectively, using https://sb452.shinyapps.io/overlap/.51 Multivariable MR was performed to control for the effect of IVs on possible confounding variables; the Cochrane Q test was used to identify heterogeneity in causal estimates. Analyses omitting one IV, leave-one-out analyses, were undertaken where significant effects were identified from univariable MR estimates. Our study is reported in accordance with the STROBE-MR guidelines.54,55
Ethical ApprovalThis research was conducted using the UK Biobank Resource under application number 885. UK Biobank is approved by the National Information Governance Board for Health and Social Care and the National Health Service North West Centre for Research Ethics Committee (Ref:11/NW/0382). The Coordinating Ethics Committee of the Helsinki and Uusimaa Hospital District has evaluated the FinnGen study.
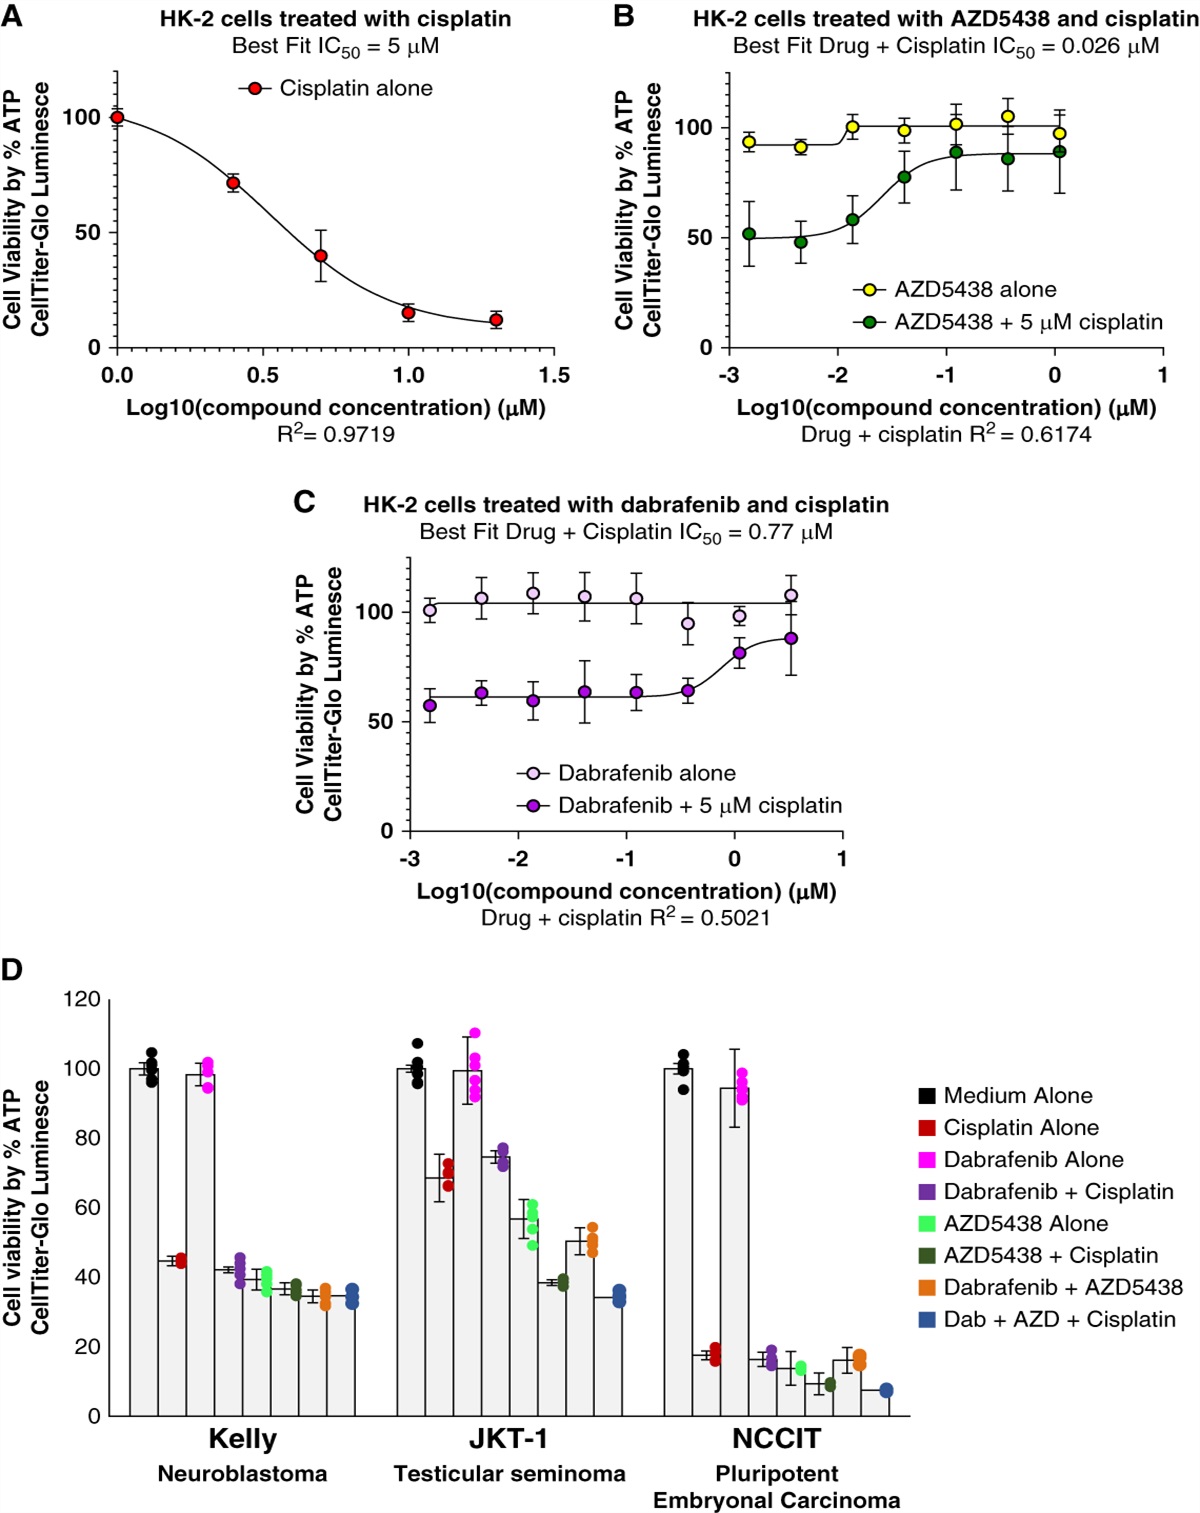
Results Associations of Adiposity and Kidney Stone DiseaseAmong 479,405 participants included in observational analyses, mean age at baseline was 56.5 years (SD=8.1); 55% were female (Table 1, Supplementary Figure 2).
Table 1 - Baseline characteristics of the participants in observational studies of UK Biobank Characteristic Men (n=216,157) Women (n=263,248) Overall (n=479,405) Demographic and lifestyle factors Age, mean (SD) 56.7 (8.2) 56.3 (8.0) 56.5 (8.1) White, n (%) 204,727 (94.7) 249,298 (94.7) 454,025 (94.7) Current smoker, n (%) 26,863 (12.4) 23,288 (8.8) 50,151 (10.5) Alcohol drinker (at least weekly), n (%) 168,274 (77.8) 165,048 (62.7) 333,322 (69.5) Townsend Deprivation Index, mean (SD) −1.3 (3.1) −1.4 (3.0) −1.3 (3.1) Anthropometric measures, mean (SD) Body mass index, kg/m2 27.8 (4.2) 27.1 (5.1) 27.4 (4.8) Waist circumference (cm) 96.8 (11.2) 84.6 (12.4) 90.1 (13.4) Waist-to-hip ratio 0.94 (0.06) 0.82 (0.07) 0.87 (0.09) Kidney stone disease status Case, n (%) 3146 (1.5) 1830 (0.7) 4976 (1.0)Participants were mainly of White ethnicity (95%) and from less-deprived areas than the national average (mean Townsend Deprivation Index score −1.33, SD=3.1). At baseline, mean BMI, WHR, and WC were 27.8 kg/m2 (SD=4.8), 0.94 (SD=0.06), and 96.8 cm (SD=11.2), respectively, among men, and 27.1 kg/m2 (SD=5.1), 0.82 (SD=0.07), and 84.6 cm (SD=12.4), respectively, among women. Self-correlations between baseline and resurvey measurements were 0.93 for BMI, 0.67 for WHR, and 0.82 for WC in men and 0.92 for BMI, 0.66 for WHR, and 0.83 for WC in women.
During 5.6 million person-years of follow-up (mean 11.6 years/person), 4976 individuals developed incident kidney stone disease. In both sexes, each adiposity measure was strongly positively associated with incident kidney stone disease, with overlapping 95% CIs, and no evidence of a threshold effect (Figure 2). In analyses combining both sexes, a 5 kg/m2 higher BMI was associated with an approximately 30% higher risk of incident kidney stone disease (hazard ratio [HR]=1.31, 95% CI=1.27–1.35), as was a 0.05 higher WHR (HR=1.34, 95% CI=1.30–1.38) and a 10 cm larger WC (HR=1.29, 95% CI=1.26–1.32) (Figure 2, Table 2). In sex-stratified analyses, measures of central adiposity (WHR and WC) conferred a higher risk of incident kidney stone disease than measures of general adiposity (BMI); however, there was overlap of 95% CIs (Supplementary Figure 3).
 Figure 2:
 Incident kidney stones versus anthropometric measures in observational analyses in the UK Biobank. Hazard ratios (HR) stratified by age at risk and ethnicity for incident kidney stones versus (A) body mass index (BMI), (B) waist-to-hip ratio (WHR), and (C) waist circumference (WC) among 479,405 participants. (D) HR of anthropometric measures with additional adjustment for each other in combined-sex analyses. Analyses are adjusted for Townsend Deprivation Index, smoking, and alcohol drinking and exclude participants with preexisting kidney stones (or conditions known to predispose to kidney stones) at baseline and those with missing or outlying values in anthropometric variables or key covariates. The variance of the category−specific log risk determines the confidence interval (CI).
Table 2 - Incident kidney stones versus anthropometric measures in UK Biobank (quintile analysis) Men Women Exposure Quintile N HR (95% CI) Exposure N Quintile HR (95% CI) BMI Q1 449/42,910 REF BMI 248/53,833 Q1 REF Q2 519/44,051 1.13 (1.00 to 1.29) 322/51,261 Q2 1.36 (1.15 to 1.60) Q3 603/43,154 1.34 (1.18 to 1.51) 320/52,273 Q3 1.28 (1.09 to 1.52) Q4 662/41,252 1.53 (1.35 to 1.72) 414/52,868 Q4 1.58 (1.35 to 1.85) Q5 913/41,644 2.03 (1.81 to 2.28) 526/51,183 Q5 1.97 (1.69 to 2.30) WHR Q1 420/42,575 REF WHR 234/52,856 Q1 REF Q2 522/43,410 1.22 (1.07 to 1.39) 259/51,980 Q2 1.10 (0.92 to 1.31) Q3 628/41,857 1.51 (1.33 to 1.71) 341/52,014 Q3 1.40 (1.18 to 1.65) Q4 724/42,684 1.70 (1.51 to 1.92) 428/52,878 Q4 1.67 (1.42 to 1.97) Q5 852/42,485 1.98 (1.76 to 2.23) 568/51,690 Q5 2.16 (1.85 to 2.53) WC Q1 479/48,430 REF WC 252/57,631 Q1 REF Q2 487/38,497 1.28 (1.13 to 1.46) 282/52,281 Q2 1.22 (1.03 to 1.44) Q3 562/41,494 1.37 (1.21 to 1.54) 321/49,870 Q3 1.41 (1.19 to 1.66) Q4 747/43,231 1.73 (1.54 to 1.94) 442/53,817 Q4 1.74 (1.49 to 2.03) Q5 871/41,359 2.05 (1.84 to 2.30) 533/47,819 Q5 2.22 (1.91 to 2.59)Models stratified by age at risk and ethnicity and adjusted for Townsend Deprivation Index, smoking, and alcohol drinking. 95% CI, 95% confidence interval; BMI, body mass index; HR, hazard ratio; Q, quintile; REF, reference quintile; WC, waist circumference; WHR, waist–hip ratio.
In combined and sex-stratified analyses, the association of BMI with incident kidney stone disease was attenuated after adjustment for WC, whereas BMI remained positively associated with kidney stone disease after adjustment for WHR (Figure 2, Supplementary Figure 3). WC and WHR remained positively associated with kidney stone disease after adjustment for BMI (Figure 2, Supplementary Figure 3).
Genome-Wide Association Study of Kidney Stone Disease in UK BiobankTo facilitate MR analyses, we extended our previous genome-wide association study (GWAS) of kidney stone disease in the UK Biobank, using a greater number of inclusion codes to optimize ascertainment (Supplementary Tables 2–3)2; GWAS were performed in combined-sex, male, and female populations (Supplementary Tables 6–9, Supplementary Figures 4–6). In addition, we undertook a meta-analysis (combined-sex outcomes) using data from UK Biobank (8504 cases and 388,819 controls) and FinnGen r8 (8597 cases and 333,128 controls).2 Meta-analysis revealed 55 independent signals at 47 genetic loci that are associated with kidney stone disease; of these, 23 loci are novel (candidate genes in proximity to association signals: PTGS2, SLC41A1, SLC3
Comments (0)