
Remember me


In addition to the bulk transcriptome profiling of the SRRSH-ICC cohort (n = 65) collected from our center (Sir Run Run Shaw Hospital, School of Medicine, Zhejiang University), other datasets including FU-ICC (n = 255), GSE26566 (n = 104) and E-MTAB-6389 (n = 78) were obtained from published articles or the Gene Expression Omnibus (GEO) website (https://www.ncbi.nlm.nih.gov/geo/) or the European Molecular Biology Laboratory-European Bioinformatics Institute (EMBL-EBI) website (https://www.ebi.ac.uk/biostudies/arrayexpress/studies/E-MTAB-6389#o1) [16,17,18]. The single-cell transcriptome profiling of the ICC patients (GSE151530) (n = 14) was obtained from the GEO website [19, 20]. And relevant information information was presented in Tables 1 and 2. As shown in Fig. 1, our study design was briefly described in the flow chart. This study performed FU-ICC as the training dataset, and SRRSH-ICC, GSE26566, E-MTAB-6389, and scRNA-seq as the validation datasets.
Table 1 Basic information of datasets included in the study.Table 2 Clinical characteristics of the included cohorts.Fig. 1: Flow chart of the study design.
ICC Intrahepatic cholangiocarcinoma, ssGSEA single sample gene set enrichment analysis, WGCNA Weighted correlation network analysis, SVM-REF Support vector machine-recursive feature elimination, RF Random forest, LASSO Least absolute shrinkage and selection operator.
Data processing and normalizationWe first used the ComBat algorithm to remove the apparent batch effect in the training and validation datasets, then the normal-exponential convolution model was performed for background correction, and the background-corrected expression matrix of the training and validation datasets was quantile normalized, adopting the normalizeBetweenArrays algorithm, respectively.
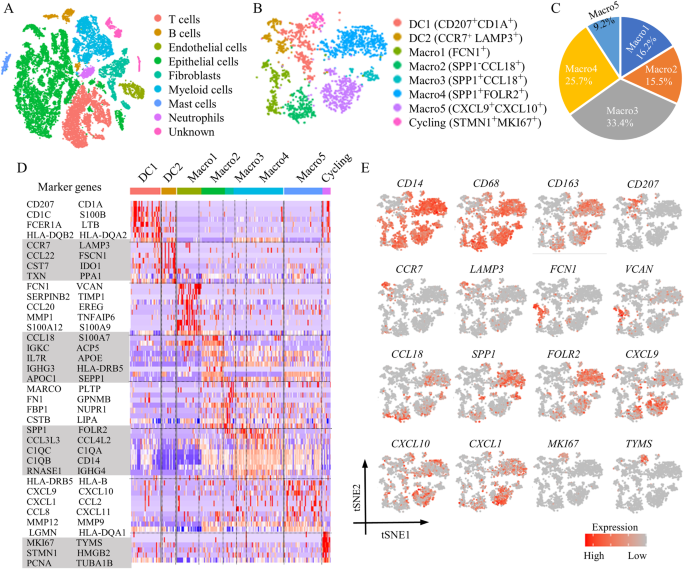
We performed the Seurat analysis package for the clustering operation of the single-cell transcriptome profiling (GSE151530) [21]. After the included data were normalized, the top 2000 variable genes were sought out for principal component analysis (PCA) dimensionality reduction. Afterwards, the cell nearest neighbor network was established using the FindNeighbors function, and community-based cell clustering was done using the FindClusters function. Ultimately, t-Distributed Stochastic Neighbor Embedding (TSNE) was performed for the visualization of cell distribution. The cell types of each cluster were annotated in combination with the automatic annotation of R package (celltypist) and the previous article [19, 20].
Screening of hub gene in ICC patients prone to cuproptosisThe two authors of this study independently collected the gene sets of PCD from the Gene Set Enrichment Analysis (GSEA) website (http://www.gsea-msigdb.org/gsea/msigdb/index.jsp) (including APOPTOSIS, AUTOPHAGY, FERROPOSIS, PYROPTOSIS, REGULATED_NECROSIS) and collected the gene set of CUPROPTOSIS from the reference article and ultimately summarized the gene set containing six kinds of PCD pathways (pan-PCD gene set) [13], as shown in Table S1.
Single sample gene set enrichment analysis (ssGSEA) in the training dataset was conducted based on the pan-PCD gene set. Then unsupervised cluster analysis was performed based on the ssGSEA analysis results, using ConsensusClusterPlus [22], agglomerative km clustering with a euclidean distance, and resampling 80% of the samples for ten repetitions. The optimal number of clusters was determined using the empirical cumulative distribution function plot, and the effect of cluster analysis was verified by PCA. Only when the following three conditions were met simultaneously could the prediction model of ICC patients prone to cuproptosis constructed subsequently meet the requirements of this study: ①The higher expression of cuproptosis and the not higher expression (lower expression or no difference in expression) of other PCD (based on the GSEA website) should be used as the feature to distinguish the cuproptosis subtype; ②There was a significant difference in long-term prognosis between ICC patients prone and not prone to cuproptosis; ③ cuproptosis subtype affected the clinical chemotherapy response of ICC patients. To screen out the genes which could distinguish the ICC patients prone to cuproptosis, the bulk transcriptome sequencing matrix of the training dataset was first processed by Weighted Gene Co-expression Network Analysis (WGCNA). WGCNA is a computational method used in bioinformatics to describe the correlation patterns among genes across multiple samples. It clusters genes into modules based on their co-expression similarities, which can help identify groups of genes that might be involved in similar biological processes or share similar functions; Then, the co-expression modules derived from WGCNA with the most obvious differences were intersected with the differential genes among subtypes; Eventually, three machine learning classification algorithms (Support vector machine-recursive feature elimination, SVM-REF; Random forest, RF; Least absolute shrinkage and selection operator, LASSO) were adopted to screen the hub genes in ICC patients prone to cuproptosis from the intersection genes above.
Construction and validation of nomogram model for predicting ICC patients prone to cuproptosisConstructed using the hub genes obtained from the screening strategy above, the logistic nomogram model for predicting ICC patients prone to cuproptosis was verified internally and externally using the training and validation datasets. Specifically, the procedures were as follows: The receiver operating characteristic (ROC) curve of the training dataset was adopted to calculate the area under the curve (AUC) and obtain the best cutoff value of the nomogram score for distinguishing ICC patients prone to cuproptosis in the training dataset; The calibration curve of the model applied to the training dataset was drew to evaluate the disparity between the predicted and actual outcome; The decision curve analysis (DCA) was used to evaluate whether the nomogram model is beneficial to clinical application of the training dataset; According to the best cutoff value of the nomogram score of the training dataset, the validation dataset was divided into ICC patients prone to and not prone to cuproptosis. Then the drug sensitivity analysis (pRRophic package), immune infiltration analysis, and survival analysis of different groups in the validation dataset were performed.
Cell transfections, cell viability and proliferation assaysObtained from the American Type Culture Collection and tested negative for mycoplasma contamination, at 37 °C in 5% CO2 condition, the ICC cell lines (RBE and HuCCT1) were maintained in Dulbecco modified Eagle medium (DMEM) containing 10% fetal bovine serum, other cell lines (THP-1, macrophages; Jurkat, T cells; HL-60, neutrophils) were maintained in 1640 medium containing 10% fetal bovine serum. The transfection of siRNA (Ribobio, China) and plasmids was performed using Lipofectamine 3000 Reagents (Thermo Fisher Scientific, Waltham, USA) according to the manufacturer’s instructions.
The siRNA target sequences were listed as follows.
siCASP1: CACCACTGAAAGAGTGACT; siCD274: GCTGTCTTTATATTCATGA; siGZMB: ACGCCATTATTACGACAGT; siDAPP1: GGAATGAACTGAAATACTT; siEPSTI1: CCGCTGAGTTCTTGAGCAA
The day before the siRNA transfection, the cells were plated with 20–30% density in a 12-well plate (1 ml medium per well). After incubation in the incubator for one night, siRNA was transfected. After siRNA transfection for 48 h, the Elesclomol-CuCl2 complex was added. 10−6, 10−7, 10−8, 10−9 M of CuCl2 solution was added to the media 30 min prior to the addition of Elesclomol solution (n (Elesclomol): n(CuCl2) = 1:1), as described in the published article [13]. At 24 h after medication, we measured the OD value using a microplate reader at a wavelength of 450 nm with the cck8 reagent (Yeasen, China), which reflected the cell viability of each well, and the number of replicates was three.
qRT-PCR and western blot analysisFollowing the manufacturer’s instructions, TRIzol reagent (Ambion, USA) was used to extract total RNAs from ICC cells, Hifair® II 1st Strand cDNA Synthesis SuperMix (Yeasen, China) was applied to synthesize cDNA, and Hieff UNICON® qPCR SYBR Green Master Mix (Yeasen, China) was adopted to conduct qPCR. Three independent replicates were conducted for each experiment. Actin beta (ACTB) was used as the internal control in this study, and primer sequences used in this study were listed as follows.
CASP1-F:GCTGAGGTTGACATCACAGGCA; CASP1-R: TGCTGTCAGAGGTCTTGTGCTC; CD274-F:TGCCGACTACAAGCGAATTACTG;CD274-R: CTGCTTGTCCAGATGACTTCGG; GZMB-F:CGACAGTACCATTGAGTTGTGCG;GZMB-R:TTCGTCCATAGGAGACAATGCCC; DAPP1-F:AGCAGATCCGATGGAGAGGCTG;DAPP1-R:TTGCTGTCCCTCAGAAGGTAGC; EPSTI1-F:ACTGAAACGGCAGCAGCAAGAG;EPSTI1-R:TCCAACAGCCTCCAGATTGCTC FDX1-F:CTGGCTTGTTCAACCTGTCACC;FDX1-R:GATTTGGCAGCCCAACCGTGAT; ACTB-F:GAGAAAATCTGGCACCACACC; ACTB-R:GGATAGCACAGCCTGGATAGCAA
The RIPA lysis buffer (Added protease inhibitor and phosphatase inhibitor) was used to extract total proteins. SDS-PAGE was utilized to separate extracted proteins. Afterward, the PVDF membrane was used for protein transmembrane. After incubating the transferred membrane with the corresponding primary antibody overnight at 4 °C and appropriately washing with 10% TBST solution, the membrane was incubated with the corresponding secondary antibody for 1 h at room temperature. Ultimately, after appropriate washing with 10% TBST, the enhanced chemiluminescence reagent (Fdbio Science, China) was adopted to test the antigen-antibody complex on the membrane. The antibodies used in this study were listed as follows: Anti-PD-L1, ab282458, Abcam; Anti-FDX1, ab108257, Abcam; Anti-beta Actin, ab8226, Abcam.
Exploration of immune microenvironment of ICC patients prone to cuproptosisSince cuproptosis and immunity are intimately linked [23], and the disease progression of ICC is tightly associated with peripheral immune infiltrating cells [24], further exploration of the immune microenvironment is of great significance for the characterization of ICC patients prone to cuproptosis. This study explored the commonness of the immune microenvironment of ICC patients prone to cuproptosis from the aspects of bulk and single-cell transcription profiling.
This study used Microenvironment Cell Populations-counter (MCPcounter) to identify the cell types of bulk transcription profiling in training and validation datasets. According to the gene expression matrix, MCPcounter generates the absolute abundance fractions of immune cells and stromal cells (including CD8 + T Cells, B Lineage, NK Cells, Monocytic Lineage, Myeloid Dendritic Cells, Neutrophils, Endothelial Cells, Fibroblasts) for each sample [25].
Since bulk transcriptome profiling is affected by the immune microenvironment, thus we utilized single-cell transcriptome profiling to assist the study of the immune microenvironment of ICC. Adopting the “AverageExpression” function in Seurat, the average gene expression level for each patient in the single-cell transcriptome profiling study (GSE151530) was determined. According to the best cutoff value of the nomogram score of the training dataset, the ICC patients in GSE151530 could be divided into ICC patients prone to (C1 cohort) and not prone to cuproptosis (C2 cohort). We homogenized the cell number of the two cohorts and then applied the homogenized single-cell transcriptome profiling to conduct the subsequent cell crosstalk analysis.
As a database containing ligands, receptors and their interactions, CellPhoneDB can comprehensively and systematically analyze the communication molecules and thus explore the mutual communication network between different cell types [26, 27]. Here, CellPhoneDB was used to investigate the interaction between different cell types in ICC, and the total mean and the number of interactions were adopted to illustrate the corresponding correlation.
Animal experiments and immunohistochemistryThe patient-derived xenograft (PDX), the tumor tissue of a 59-year-old male ICC patient hospitalized at Sir Run-Run Shaw Hospital, Zhejiang University (The patient signed informed consent, and the Ethics Committee of SRRSH approved this study), was first implanted into the subcutaneous region of NOD/SCID mice (male, 4-week) (Shanghai SLAC Laboratory Animal Co., Ltd, China). Three months later, the NOD/SCID mice with tumors were euthanized, and the tumors were transplanted into the subcutaneous part of nude mice (male, 4-week) (Shanghai SLAC Laboratory Animal Co., Ltd, China). The specific steps were as follows: After cleaning tumor tissue with pre-cooling PBS, we used sterilized tissue scissors to trim the tumor tissue to a size of 1*1*1 mm3. After anesthesia, a small incision of approximately 2–3 mm was made near the back skin under the armpit of BALB/c nude mice, and a small pocket-like space was passively separated. Then, the trimmed tumor tissue was implanted subcutaneously. The skin incision was finally sutured and disinfected with iodophor to prevent infection.
When the tumors grew to 0.4 cm in length (about 4 weeks), the nude mice were randomized into four groups (5 mice in each group) to receive the following treatment measures every 4 days:①lenti-shNC+DMSO; ②lenti-shCD274 (The target sequence of shCD274 was identical to siCD274)+DMSO; ③lenti-shNC+Elesclomol-CuCl2; ④lenti-shCD274+Elesclomol-CuCl2 (Administering lentivirus (lenti-shNC and lenti-shCD274) at 5 × 10⁷ TU (accounting for 50 ul) per dose by subcutaneous injection; Administering Elesclomol-CuCl2 at 3.625 mg/kg per dose by subcutaneous injection referring to the published article [28]). The length L (mm), width W (mm), and height H (mm) of the subcutaneously transplanted tumor were measured with a vernier caliper every 3 days to calculate the tumors’ volume change. And the volume calculation formula in this study was V = L × W × H(mm3). Nude mice were euthanized after 16-day treatment, and the tumor was immediately soaked in 4% paraformaldehyde for subsequent immunohistochemistry experiments. All animal experiments were carried out according to the regulations proposed by the Association for the Assessment and Accreditation of Laboratory Animal Care and the Institutional Animal Care and Use Committee Guidelines and approved by the Ethics Review Committee for Animal Welfare in Experiments of Sir Run Run Shaw Hospital, School of Medicine, Zhejiang University (SRRSH202302296).
The above tumors fixed by 4% paraformaldehyde and embedded in paraffin were cut into 3-μm-thick sections and immunohistochemical staining with the corresponding specific primary antibodies. Subsequently, sections were incubated with primary antibodies at 4 °C overnight. After appropriate washing with PBS, the sections were treated with the GTvision immunohistochemistry kit according to the manufacturer’s instructions. The quantitative analysis of immunohistochemistry was performed by two authors using the Fiji-ImageJ software. And the total staining intensity was defined as the multiplying of the mean staining intensity and staining area, which the Fiji-ImageJ software could calculate.
Statistical analysisAll the analyses were performed by R 4.1.2 and GraphPad Prism 8 software. The measurement data of normal distribution was represented as mean ± standard error of the mean, the measurement data of skew distribution was represented by median (range), and the count data was represented by the number of cases (percentage). For the measurement data of two independent samples, if the data obeyed the normal distribution and the variance was homogeneous, the unpaired t-test should be used for analysis; if the variance was uneven, the Welch’s corrected unpaired t-test should be used; If the data did not obey the normal distribution, Mann–Whitney rank sum test or Kolmogorov–Smirnov test should be adopted. The analysis of variance should be used for comparing multiple samples. The counting data of two independent samples should be analyzed by the Chi-square test. Kaplan–Meier method and Log-rank test or Gehan–Breslow–Wilcoxon test were adopted to compare the overall survival of different groups, and corresponding survival curves were subsequently plotted. p < 0.05 was deemed to be statistically significant. Three independent replicates were conducted for each experiment.
Comments (0)