
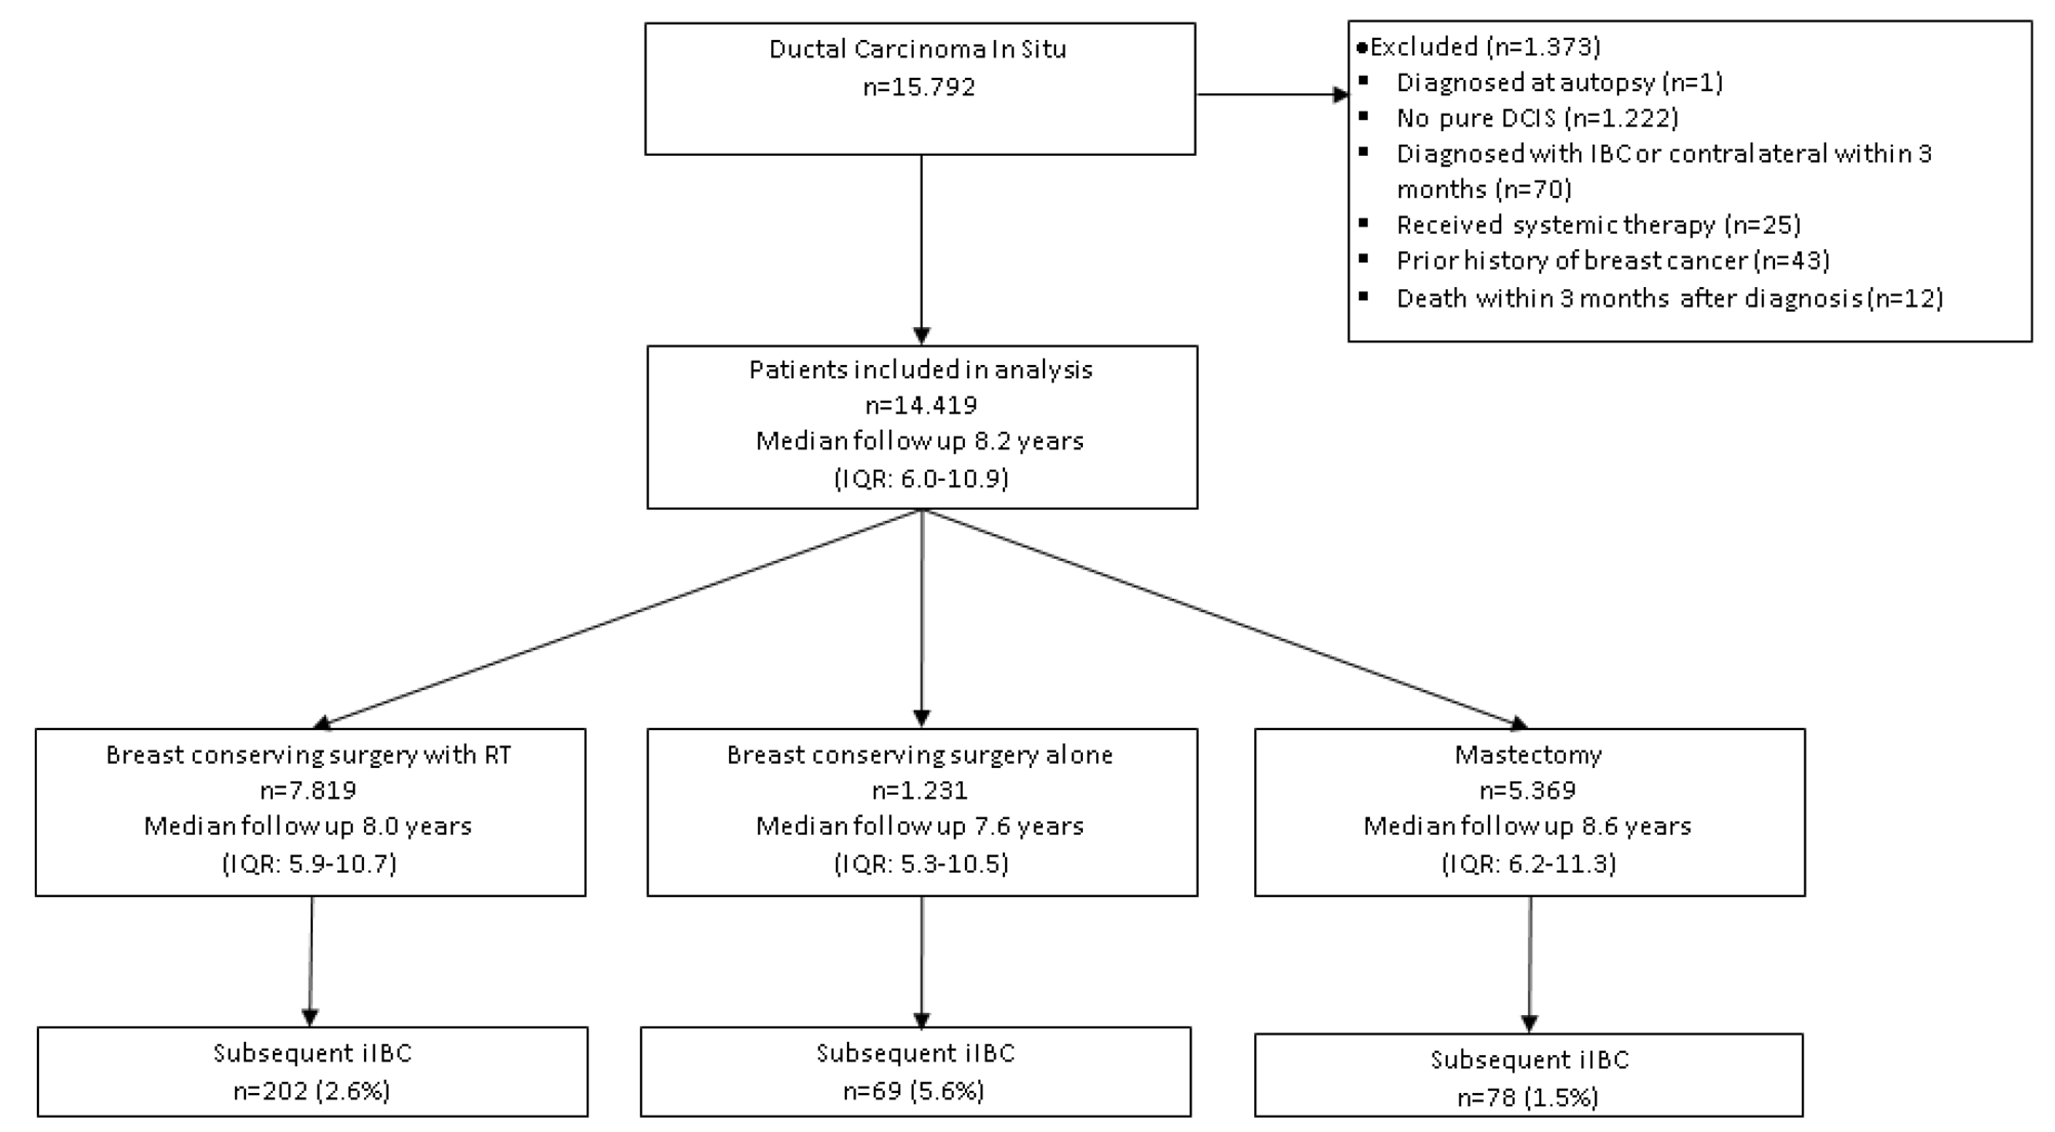
Remember me


A total of 215 early BC patients were enrolled and underwent the baseline dietary and physical activity assessment one week before starting chemotherapy (baseline, T0). Among them, 169 patients met all the following visits up to the last assessment, 12 months after the end of chemotherapy (from T1 to T6). The remaining 46 women abandoned the study during the follow-up and did not attend the final visit (T6), and therefore, were excluded from the analysis.
The physiological and clinical characteristics of the BC patients at baseline are shown in Table 1. The mean age was 54 years (range 25–80 years). The majority of them had a normal weight or underweight, were postmenopausal, had no lymph node involvement, high grade tumors and were positive for estrogen and progesterone receptors. The sequential regimen with anthracyclines and taxanes was the most used treatment, and the majority received also hormone therapy. All premenopausal patients reported chemotherapy-induced amenorrhea at the end of the adjuvant treatment. The baseline physiological and clinical characteristics of the 46 BC patients who did not undergo the last assessment are shown in Table 1 of the supplementary material. No statistically significant difference was found in physiological and clinical characteristics between the compliant (see Table 1) and the non-compliant BC patients for each variable.
Table 1 Clinical characteristics at baseline (1 week before starting chemotherapy) (n = 169)The mean consumption of foods, beverages, and condiments at baseline and last assessment, 12 months after the end of chemotherapy (T6), in grams or milliliters per week, is reported in Table 2. A statistically significant change was observed in the mean week intake of most foods and beverages, with an increased intake of fruit, vegetables, fish, and legumes and a decreased intake of pasta or rice, bread, potatoes, breadsticks/crackers, white and red meat, lean and fat salami, aged cheese, milk and yogurt, added sugar, icecreams and sweet snacks, soft drinks and fruit juices and alcoholic beverages, particularly wine, and butter. No significant changes were observed for the other items. The proportion of women reporting a daily alcohol consumption declined from 59.8% to 48.5%.
Table 2 Food, beverages, and condiments consumption 1 week before starting chemotherapy (T0) and 12 months after the end of chemotherapy (T6)The baseline consumption of foods, beverages, and condiments in the BC patients who did not undergo the last assessment is shown in Table 2 of supplementary material. A comparison with the BC patients who participated in the whole study (see Table 2) did not show significant differences for each variable. A significant decrease in daily calorie intake, of about 350 kcal (95% CI: from 277 to 424 kcal), was observed from baseline to last assessment, due to a reduction of macronutrients intake (proteins, carbohydrates, and fat), as shown in Table 3. An increase in fiber intake was also seen. The mean MDS improved of 0.6 in a 9 points scale, in agreement with the changes shown in single foods and beverages intake (see Table 2). The time trend of the mean kcal daily intake, from baseline to 12 months after the end of chemotherapy (18 months of observation time) is reported in Fig. 1. Fitting a regression model with a quadratic term, a deep decline of kcal daily intake was apparent from baseline to 9th month (about 3 months after ending chemotherapy), with a flattening of the curve thereafter. A significant increase in the MDS was observed in the same time, with no clear trend at the end of the period (Fig. 2). The proportion of women who practiced physical activity increased from baseline (49.1%) to last assessment (73.4%), with an increase of the proportion who reported physical activity for 3–7 days a week, from 33.7% to 49.1% (data not shown in tables). Most women had an employment at both baseline and last assessment (70.4% and 61.5%, respectively).
Table 3 Calorie intake, macronutrients, and Mediterranean Diet Score 1 week before starting chemotherapy (T0), and 12 months after the end of chemotherapy (T6)Fig. 1
Time trend of the mean daily kcal intake, from baseline (1 week before start of chemotherapy) to 18 months (12 months after the end of chemotherapy). The line was fitted including a quadratic term in the regression model
Fig. 2
Time trend of the mean Mediterranean Diet Score (MDS) from baseline (1 week before start of chemotherapy) to 18 months (12 months after the end of chemotherapy). The line was fitted including a quadratic term in the regression model
From baseline to last assessment, weight loss (≥5% the baseline value), stable weight and weight gain (≥5% baseline value) were observed in 23.1%, 58%, and 18.9% women, respectively. Overall, a 0.68 kg mean decrease in women’ s weight (−1.1% of baseline) was observed (95% CI: −0.07; −1.30; p = 0.05 by Wilcoxon test), with a wide variability, from −13 kg to +10.5 kg. The decline of the mean weight was linear from the end of chemotherapy, 6th month after baseline, to 15th month, and remained stable thereafter (Fig. 3). The weight gain was more frequent among younger than older women, and among those with normal weight/underweight than overweight and obese women (Table 4). About one third of overweight and obese women lost weight in the study period (39.0% and 30.8%, respectively), whereas very few of them gained weight (4.9% and 3.9%, respectively). No clinical characteristic was associated with weight change, apart from presence of progesterone receptors: 25.3% and 10% of women had weight gain among those positive and negative for progesterone receptors, respectively. The proportion with weight gain was also higher in women who received hormone therapy than in those who did not (23% and 10.7%, respectively). No association was found between weight change and calorie intake, whereas weight gain was observed in a higher proportion of women with MDS worsening (44.4%) than in those with no MDS change or improvement (14.4% and 18.5%, respectively). Similarly, a higher proportion of subjects with weight gain was found among women who reduced physical activity (38.5%) than those who maintained or increased physical activity (16.7% and 14.1%, respectively). As regard to hormone therapy, no difference was found between 113 women receiving and 56 not receiving hormone therapy, for foods, beverages and condiments mean consumption, total energy intake, and MDS, at both baseline and last assessment, as shown in Table 3 of the supplementary material. Women who received hormone therapy and those who did not receive it had similar mean calorie intakes, from baseline to last assessment: they reduced calorie intake of 304 and 442 kcal/day (difference: −137, 95% CI: −293, 17), increased MDS of 0.5 and 0.8 points (difference: −0.3, 95% CI: −0.9, 0.2) and lost 0.3 and 1.4 kg of weight (difference: −1.1, 95% CI: −2.4, 0.2), on the average, respectively. According to BMI categories, some women had an improvement and few a worsening, from baseline to last assessment: 9/102 (8.8%) of those with normal weight or underweight at baseline passed to overweight, and 2/41 (4.9%) women with overweight at baseline advanced to obesity. On the contrary, 12/41 (29.3%) overweight women at baseline passed to normal weight and 8/26 (30.8%) obese women at baseline passed to overweight. Finally, the associations between physiological and clinical characteristics and dietary and physical activity habits and weight gain were assessed using univariate and multivariable methods. To this end, body weight gain was dichotomized as yes/no, collapsing the categories of “stable weight” and “weight loss” into the “no gain” category. The proportion of women gaining weight was significantly higher among those aged less than 59 years, with normal weight at baseline, with progesterone receptors, who received hormone treatment, with worsening MDS and with reducing physical activity (Table 4, supplementary material). The results of multivariable analysis of the associations between weight gain and investigated variables using logistic regression analysis, with weight gain as dichotomous dependent variable, and the odds ratios (ORs) and their 95% CIs as measures of associations, are shown in Table 5. The risk of gaining weight (≥5% baseline) decreased with increasing age, and increased in women who received hormone therapy, had a normal weight/underweight at baseline, had MDS worsening and a physical activity decrease from baseline to last assessment. The OR estimates were particularly high but imprecise, as shown by large CIs, due to the relatively small number of women in some categories. Type of chemotherapy was not associated with weight gain and no differences in the OR estimates were observed when the analysis was restricted to women treated with aromatase inhibitors (data not shown in Tables). When restricting the analysis to BC patients with hormone therapy, similar results were observed, though the OR estimates were less preciese due to the smaller number of observations (n = 113): the ORs for weight gain for age, normal weight at baseline, MDS worsening, and physical activity decrease were 0.96 (95% CI: 0.0.91, 1.01), 8.63 (2.09, 35.65), 7.58 (1.78, 32.31), and 3.62 (1.07, 12.26), respectively (data not shown in tables).
Fig. 3
Time trend of the mean weight from baseline (1 week before starting chemotherapy) to 18 months (12 months after the end of chemotherapy). The line was fitted including a quadratic term in the regression model
Table 4 Characteristics of the patients, dietary kcal intake, Mediterranean Diet Score (MDS), and physical activity frequency according to body weight change from the start of chemotherapy to 12 months after the end of chemotherapyTable 5 Characteristics associated with weight gain (≥5% baseline value), from baseline to 12 months after chemotherapy, fitting a logistic regression model: odds ratios (ORs) and corresponding 95% confidence intervals (CIs)
Comments (0)