
Remember me


Osteoarthritis (OA) is a major clinical problem with an estimated prevalence of 3754 per 100,000,53 and the prevalence is expected to increase in the future.11,13,22Osteoarthritis Research Society International (OARSI) provides recommendations for the treatment of pain in OA9,66 with (1) surgical, (2) pharmaceutical therapy, and (3) exercise-based therapy in combination with patient education being the most common. In addition, total knee arthroplasty (TKA), topical and oral nonsteroidal anti-inflammatory drugs (NSAIDs), and exercise-based therapy in combination with patient education is considered the standard pain therapies for the treatment of pain in OA, and more recently, duloxetine have been conditionally recommended as a treatment option for a subset of patients with OA pain.10 It is well described that these treatments provide patients with pain relief but that a subpopulation of patients does not obtain substantial effects of the treatments.12,17,57 Methods to identify patients in risk of a poor response before these treatments could improve health care and potentially lead to personalized pain medicine.
Quantitative sensory testing (QST) has been suggested as surrogate measure for peripheral and central pain mechanisms.7 In particular, pressure pain thresholds (PPT), temporal summation of pain (TSP), and conditioned pain modulation (CPM) are often used to profile patients with OA.2 Lower PPTs assessed over a painful area (eg, a painful OA knee) mainly reflect localized hyperalgesia, whereas lower PPTs assessed outside of a painful area reflect widespread pressure hyperalgesia, which, based on animal studies, is considered a sign of central pain sensitization.1 Temporal summation of pain is considered a proxy for the phenomenon of wind-up in dorsal horn neurons where the same stimulus is applied several times at fixed intervals and intensities yielding increased pain perception.25 Conditioned pain modulation is assumed to be the human surrogate model for diffuse noxious inhibitory controls assessed in animals,36 reflecting the balance of descending pain inhibitory and facilitatory mechanisms.62 In general, patients with severe OA exhibit lower PPTs (locally and widespread), facilitated TSP, and impaired CPM when compared with healthy asymptomatic subjects,4 and emerging evidence suggest that QST might be a predictive tool for standard pain treatments.49 Studies indicate that some patients are more pain sensitive than others,3,23,31 and the new pain descriptor “nociplastic” may apply to these pain sensitive patients.33
Parades et al.42 reviewed the literature on the predictive role of QST on acute and chronic pain after TKA and identified 9 studies in which preoperative QST predicted chronic postoperative pain, but the field has grown since the Parades et al.42 review, and it is currently unknown if these predictions can be applied to other standard pain therapies for OA as recommended by the OARSI.9 The current paper aims to provide an up-to-date systematic review and meta-analysis on the possible role of specific QST parameters to predict outcome after surgical, pharmacological, and exercise-based therapies in OA.
2. MethodsIn accordance with the Preferred Reporting Items for Systematic Reviews and Meta-Analyses (PRISMA) statement, this systematic review investigated the predictive role of QST on standard pain therapies for knee OA. The systematic review followed the PRISMA guidelines and was registered on the Open Science Framework website (OSF.IO, registration link: https://osf.io/4FETK/, study identifier: DOI: 10.17605/OSF.IO/4FETK). Studies from year 2000 to 2022 were included.
2.1. Search strategy and selection of studiesA systematic literature search was performed in February 2023 in the databases MEDLINE and EMBASE by 2 reviewers (K.K.P. and D.B.L.).
An example of the MeSH terms and text words used in each database is provided in Supplementary table 1 and 2 (available at https://links.lww.com/PR9/A194). The reference manager Mendeley was used to export the citations, and all the duplicates were excluded.
2.2. Eligibility criteriaStudies were included if they investigated one or more preoperative QST measures, including thermal, pressure, electrical, mechanical pain detection, tolerance, and suprathreshold stimuli, TSP, CPM, or exercise-induced hypoalgesia before standard pain treatment for OA. Furthermore, studies had to investigate associations between preoperative QST measures and the pain-related outcome after surgery, pharmaceutical therapies, or nonsurgical and nonpharmaceutical therapies by means of correlations (Spearman and Pearson correlations), regression models, or other predictive models.
A minimum of 6 months postoperative follow-up was chosen for surgical studies to assess chronic pain, as earlier research has reported the largest pain improvement 3 to 6 months after, eg, total knee arthroplasty surgery.61 Pharmacological and exercise-based studies were included if they investigated long-term effects of therapy (weeks/months), whereas studies focused on the acute effects of pharmacological or exercise-based therapies were excluded. In addition, the exclusion criteria consisted of languages other than English, conference abstracts, and animal studies.
Pain outcomes were reported through pain intensity, postoperative pain relief, presence of moderate-to-severe postoperative pain, or validated questionnaires on pain and disability including the Western Ontario and McMaster Universities Osteoarthritis Index (WOMAC), Visual Analogue Scale (VAS), and Numerical Rating Scale (NRS).
2.3. Data extraction and synthesis of included literatureThe title of publications identified in the databases was reviewed by 2 reviewers (K.K.P. and D.B.L.) in a blinded fashion before meeting. After removing duplicates, abstracts of the articles were screened for potential eligibility and posterior full-read text by the same 2 reviewers (K.K.P. and D.B.L.) independently. The data were independently extracted by 2 investigators (K.K.P. and D.B.L.). For each study, the recorded data were on the total number of subjects, the pretreatment predictors (including QST paradigms), the follow-up time, the dependent outcome of the predictive model, and type of the predictive model. In case of discrepancies in data extraction and synthesis, a third investigator (LAN) was available to make the final decisions.
2.4. Quality assessmentQuality In Prognostic Studies (QUIPS) tool was independently used by 2 authors (K.K.P. and D.B.L.) to assess the quality and the methods of the included articles, more specifically to assess the overall risk of bias in each study focusing on 6 bias domains: study participation, study attrition, prognostic factor measurement, outcome measurement, study confounding, and statistical analysis and reporting. If consensus was not reached, a third independent reviewer (LAN) was consulted for the final decision.
2.5. Meta-analysisThe studies identified for the systematic review displayed a large degree of heterogeneity in the reporting outcomes, which complicated a traditional meta-analysis. To overcome this, studies reporting only compound R2 values (predictive models) or odds ratios were transformed to Pearson correlation coefficients (r) for the meta-analysis. This was performed to ensure the same association statistic was used for an overall correlation coefficient, at the expense of limiting the ability to infer whether the correlation is mainly driven by the QST measure or other preintervention factors in the case of compound statistics. Where possible, single correlations between preoperative QST measures and pain outcome(s) were preferred and included in the overall meta-analysis instead of compound correlations. Here, it is important to delineate the extent to which pain sensitive QST profiles were considered with respect to pain outcome. The meta-analysis was performed to investigate if signs of pain sensitization, as reflected by QST proxies, were associated with treatment outcomes. The reverse sign correlation was used for PPT and CPM data34,35,41 so that a positive correlation indicated a pain sensitive profile. Correlations based on compound predictive models would be expected to have positive correlations (as the R2 cannot be negative). Forest plots were generated to exhibit the correlational strengths between preoperative QST measures and treatment outcomes and further highlight if studies reported correlations based on compound models or singular association statistics. A higher value on the forest plot indicates a stronger association between a pretreatment QST, whereas positive values indicate that pain sensitive (pronociceptive) subjects are more likely for a poor pain-relieving outcome after therapy, and a negative value indicate that a less pain sensitive (antinociceptive) subject is more likely for a poor pain-relieving outcome after therapy.
The meta-analysis was conducted using MedCalc (v. 20.103; MedCalc Software Ltd, Ostend, Belgium), applying the Fisher z transformation of correlation coefficients and Hedges–Olkin method for weighted summary correlation coefficients under a fixed effect model. As the meta-analysis is conducted on the Fisher z transformed values, data were pooled independent if correlations were based on relative6,45,58 or absolute14,16,21,34,35,38,44,46,50,52,59 pain outcomes. Studies with multiple QST outcomes with an eligible correlation to treatment outcome6,34,41,58 were still included with both QST parameters, but halved in population per the Cochrane guidelines, to avoid double counting.29 Since heterogeneity is assumed for the included studies due to, eg, methodological differences, the summed correlation coefficient between the QST measures and pain outcome after surgery, analgesic treatment, or exercise, was estimated and plotted by both the fixed-effects and the random-effects model. Heterogeneity was assessed using the χ2 test and I2 statistics, where a χ2 test P < 0.1 suggests significant heterogeneity with I2 > 60% reflecting substantial heterogeneity.29
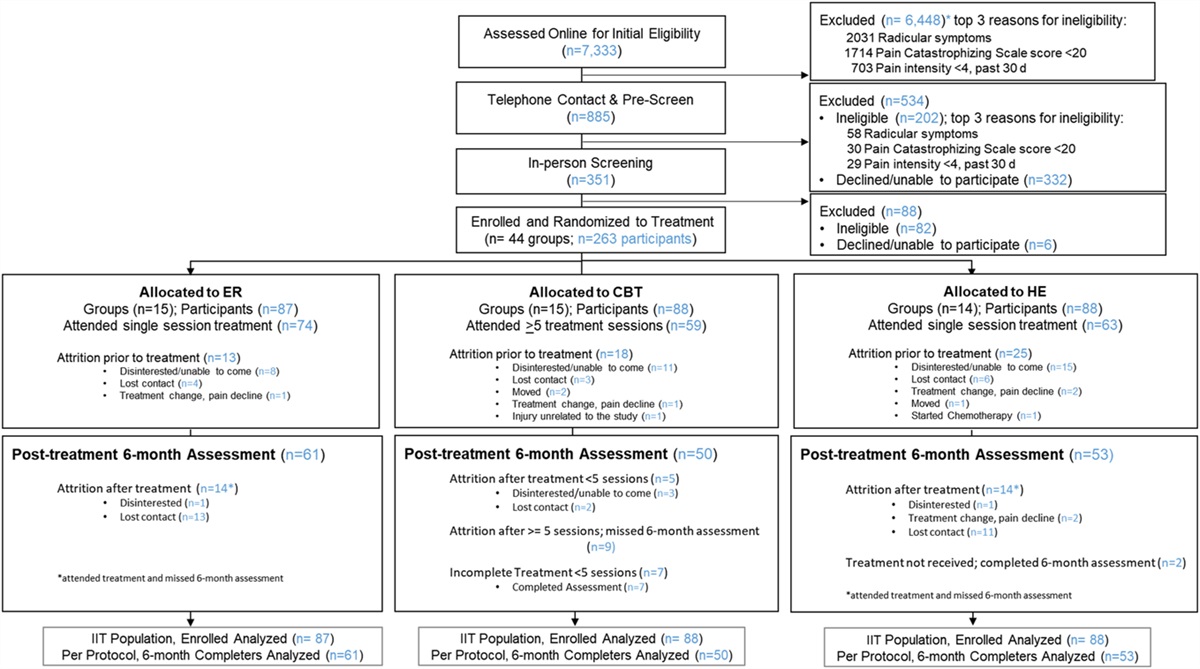
3. ResultsTwo independent investigators (K.K.P. and D.B.L.) screened 1933 publications by title and abstract to exclude articles that did not meet the inclusion criteria. By consensus between D.B.L. and K.K.P., the initial included articles were decided for 90% of records. One senior investigator (L.A.N.) was consulted for final decisions on the remaining articles, and consensus was reached for all articles. The PRISMA flow diagram (Fig. 1) illustrates the search process, where 25 eligible publications were identified through the systematic literature search.
 Figure 1.:
 The Preferred Reporting Items for Systematic Reviews and Meta-Analyses (PRISMA) flow diagram. Reason(s) for exclusion: *Not postoperative period/pain (n = 9), not total knee arthroplasty (n = 1), no QST measure (n = 4), no prediction for postoperative pain (n = 2), abstract (n = 2), review or commentary (n = 7), protocol (n = 2), and duplicate not caught by automated duplicate procedure (n = 1); **Not postoperative period/pain (n = 3), not osteoarthritis population (n = 3), no QST measure (n = 2), no prediction for analgesic effect (n = 14), abstract (n = 2), review or commentary (n = 8), protocol (n = 2), duplicate not caught by automated duplicate procedure (n = 1), and not standard treatment (n = 1); ***no pain sensory profiling measure (n = 15), no prediction for exercise effect on pain (n = 5), abstract (n = 3), review or commentary (n = 2), protocol (n = 1), only acute effects (n = 1), no prediction for postexercise pain (n = 2), and secondary analysis of data already included (n = 1). QST, quantitative sensory testing.
A total of 25 studies were identified where 16 studies focused on surgery (all on total knee arthroplasty, Table 1), 5 studies on pharmacological treatments (Table 2), and 4 studies investigated exercise-based therapy or exercise-based therapy in combination with patient education (Table 2). Sample sizes ranged from 14 to 288 with a total of 2238 patients (1967 patients in the surgical studies, 271 patients in the pharmacological studies, and 232 patients in the nonsurgical and nonpharmacological studies).
Table 1 - Studies assessing preoperative quantitative sensory testing (QST) as a predictor for chronic postoperative pain 3 months or longer in patients undergoing total knee arthroplasty. Reference Year Patients (N) QST Follow-up (mo) POP outcome Preoperative findings Lundblad et al.38 2008 69 EDT and EPT 18 VAS Regression (M):*Not reported in the original paper but calculated for this review.
ALL, allodynia; AUC, area under the receiver operating characteristic curve; CDT, cold detection threshold; CPM, conditioned pain modulation; CPT, cold pain threshold; CRPS, complex regional pain syndrome; CSS, CRPS severity score; EDT, electrical detection threshold; EIH, exercise-induced hypoalgesia; EPT, electrical pain threshold; HPT, heat pain threshold; lin-reg, linear regression; M, multivariate analysis; MB-lin-reg ana, multiple backward linear regression analysis; MPT, mechanical pain threshold; NRS, numeric rating scale; OR, odds ratio; P, probability value; POP, postoperative pain; PPT, pressure pain threshold; PTT, pain tolerance threshold; r, correlation coefficient; TSP, temporal summation of pain; U, univariate analysis; VAS, Visual Analog Scale; WDT, warm detection threshold; WOMAC, Western Ontario and McMaster Universities Osteoarthritis Index.
BPI, Brief Pain Inventory; CPM, conditioned pain modulation; EIH, exercise-induced hypoalgesia; M, multivariate analysis; MDT, mechanical detection threshold; NRS, numeric rating scale; OR, odds ratio; P, probability value; PDQ, PainDetect Questionnaire; PPT, pressure pain threshold; PTT, pain tolerance threshold; r, correlation coefficient; TSP, temporal summation of pain; U, univariate analysis; VAS, Visual Analog Scale; VDT, vibration detection threshold; WDT, warm detection threshold; WOMAC, Western Ontario and McMaster Universities Osteoarthritis Index.
A total of 25 eligible publications were identified through the systematic literature search with 16 surgical, 5 pharmacological therapy, and 4 exercise-based therapy studies.
3.2. Surgical studies 3.2.1. Electrical stimuliElectrical stimuli were reported 1/15 studies (6%)38 as electrical detection and electrical pain thresholds (EPTs). Lundblad et al.38 demonstrated that lower preoperative EPTs in combination with higher preoperative pain intensity were predictive of the 18-month postoperative pain intensity.
3.2.2. Pressure stimuliPressure stimuli were reported in 11/16 studies (69%),6,21,34,35,40,44,45,52,58–60 as assessed by pressure pain thresholds using cuff algometry (cPPT),21,34,35,45,58 handheld algometer (PPT),6,21,34,40,44,52,58–60 and pain tolerance thresholds using cuff algometry (cPTT).34,35,45,58 Pressure stimuli were predictive in 4/11 (36%) studies using cPDT,45 PPT,6,59 and cPTT.34
Wylde et al., 20159 found that preoperative lower PPTs assessed at the forearm were associated with the 1-year postoperative WOMAC score. Petersen et al.,45 found that lower preoperative cPPTs assessed at the lower leg were associated with lower levels of 12 months postoperative pain relief. Arendt-Nielsen et al.,6 found that lower preoperative PPTs assessed at the affected and nonaffected limb was associated with pain intensity after walking change from baseline to 12 months. Kurien et al., 2018 found that lower preoperative cPTT was associated with postoperative pain intensity at 6 months.
3.2.3. Thermal stimuliThermal stimuli were reported in 4/16 studies (25%)40,46,59 and found predictive of chronic postoperative pain in one study (25%).46 Cold detection threshold (CDT),46 and warm detection threshold (WDT)46 were assessed in one study, cold pain threshold (CPT)21,39,46 were assessed in 3 studies, whereas heat pain threshold (HPT) was assessed in 3 studies.40,46,59 Petersen et al.,46 found that lower HPT and lower WDT in combination with higher TSP and lower Kellgren and Lawrence scores were predictive for chronic postoperative pain intensity.
3.2.4. Temporal summation of painTemporal summation of pain was reported as the QST parameter in 8/16 (50%) studies14,16,21,34,44–46,52 as assessed using cuff algometry (TSPcuff)34,45 or monofilaments (mTSP).14,16,21,34,44,46,52 TSP was predictive in 6/8 (75%) studies.16,21,34,44,46,52
Petersen et al.,44 demonstrated that high levels of preoperative mTSP assessed in combination with preoperative pain intensity were predictive of 12 months postoperative pain intensity (assessed as the worst pain within the past 24 hours). Petersen et al.,46 demonstrated that high levels of mTSP assessed in combination with lower levels of HPT, WDT, and lower Kellgren and Lawrence scores were predictive of 12 months postoperative pain scores (assessed as the worst pain within the past 24 hours). Rice et al.,52 reported that preoperative pain intensity, mTSP, trait anxiety, and expected pain predicted 6 months postoperative WOMAC with a specificity of 64% and a sensitivity of 72%. Of note, the Rice et al., study52 did not find any significant preoperative predictors for 12 months postoperative WOMAC scores. Kurien et al.,34 assessed preoperative TSPcuff and mTSP and found that higher levels of mTSP was associated with the 6-month postoperative pain intensity. Bruehl et al.,16 demonstrated that high levels of preoperative mTSP were correlated with higher 6-month postoperative complex regional pain syndrome severity scores (CSS). Edwards et al.,21 demonstrated that higher preoperative mTSP, in combination with agreeableness, was predictive of higher 6-month postoperative brief pain inventory (BPI) and WOMAC scores.
3.2.5. Conditioned pain modulationConditioned pain modulation was reported as a QST parameter in 9/16 studies (56%).14,18,21,34,35,44,45,52,58
A wide variety of different test and conditioning protocols was identified, including the use of PPT as the test stimulus with cold water immersion being the conditioning stimulus (CPMPPT + cold),21,44,52 PPT and cuff algometry as the test stimulus and cold water immersion as the conditioning stimulus (CPMcuff + cold),58 PPT and interdigital pinching as test and conditioning stimulus, respectively (CPMPPT + i.dig.pincing),14 cuff algometry as test and conditioning stimulus (CPMcuff + cuff),15,34,45 and contact heat as test stimulus with conditioning stimulus hot water (CPMheat + hot water).18 Conditioned pain modulation predicted postoperative pain in 3/9 (33%) studies.18,35,58
Vaegter et al.,58 assessed preoperative CPMPPT + cold and found that an impaired CPM-effect was associated with 6-month postoperative pain intensities. Larsen et al.,35 assessed preoperative CPMcuff + cuff and found that impaired CPM was associated with 12 months postoperative pain scores. Dürstler et al., 2021 assessed preoperative CPMheat + hot water and found that lower preoperative impaired CPM predicted the presence of 6 months postoperative pain.
3.2.6. Exercise-induced hypoalgesiaExercise-induced hypoalgesia (EIH) was reported in 1/16 studies (6%),58 and an impaired EIH-effect was associated with 6 months postoperative pain relief.
3.3. Pharmacological therapy studies 3.3.1. Pressure stimuliPressure stimuli were reported in 4/5 studies (80%),5,20,47,50 and one study (25%)50 found pressure stimuli to be predictive for an analgesic response. Two studies reported on handheld pressure algometry,5,20 and one study reported on cuff pressure pain and tolerance thresholds.47
Petersen et al.,50 found that lower pretreatment PTTs were predictive of a higher analgesic effect of 18-week oral duloxetine treatment.
3.3.2. Temporal summation of painTemporal summation of pain was reported in 4/5 studies (80%)5,20,47,50 and found predictive of the analgesic effect in 3/4 studies (75%). Arendt-Nielsen et al.,5 found that high TSP predicted the nonresponse of 4 weeks of oral COX-2 treatment. Petersen et al.,47 found that higher TSPcuff predicted a nonresponse to 3 weeks of oral nonselective NSAIDs and paracetamol. Edwards et al.,20 reported that mTSP did not predict the analgesic response of 4 weeks of topical NSAID treatment. Petersen et al.,50 demonstrated that higher pretreatment TSPcuff predicted a higher analgesic effect of 18 weeks of oral duloxetine treatment.
3.3.3. Conditioned pain modulationConditioned pain modulation was reported in 3/5 studies (60%)20,48,50 and found predictive of the analgesic effect in 2/3 studies (67%). Edwards et al.,20 found that an impaired CPMPPT + cold effect predicted poor response to 4 weeks of topical nonselective NSAIDs. Petersen et al.,48 found that an impaired CPMcuff + cuff effect predicted a poor response to 3 weeks of oral nonselective NSAID and paracetamol.
3.3.4. Offset analgesiaOffset analgesia was assessed in 1/5 studies (20%),48 and no studies found offset analgesia to be predictive of an analgesic response.
3.4. Exercise-based therapy studies 3.4.1. Thermal stimuliThermal stimuli were reported in 1/4 studies (25%),41 and no studies (0%) found thermal stimuli to be predictive for treatment response.
3.4.2. Pressure stimuliPressure stimuli were reported in 4/4 studies (100%), and 2 studies (50%) found pressure stimuli to be predictive for treatment response. O'Leary et al.,41 found that a combination of lower PPTs assessed at the knee, the tibia, and the contralateral arm predicted a nonresponse to 6 to 8 sessions of exercise-based therapy with an odds ratio (OR) of 0.48 (95% confidence interval [CI]: 0.29–0.81). Hansen et al.,27 found that lower PPTs assessed at the knee in combination with lower EIH and higher PainDetect score were associated with less pain relief after 12 sessions of exercise-based therapy. Of note, Henriksen et al.,28 did find that a change in cuff PPT from baseline to follow-up was associated (R2 = 0.35) with a change in KOOS from baseline to follow-up.
3.4.3. Temporal summation of painTemporal summation of pain was assessed in 3/4 studies (75%), and one study (33%) found TSP to predict treatment outcome. O'Leary et al.,41 found that a combination of increased mTSP assessed at the knee, the tibia, and the contralateral arm was associated with a nonresponse to 6 to 8 sessions of exercise-based therapy with a an OR of 2.00 (95% CI: 1.23–3.27).
3.4.4. Mechanical and vibration detection thresholdO'Leary et al.,41 assessed mechanical and vibration detection thresholds and did not find these associated with a nonresponse to 6 to 8 sessions of exercise-based therapy.
3.4.5. Conditioned pain modulationO'Leary et al.,41 assessed CPM and found no association with a nonresponse to 6 to 8 sessions of exercise-based therapy.
3.4.6. Exercise-induced h
Comments (0)