
Remember me
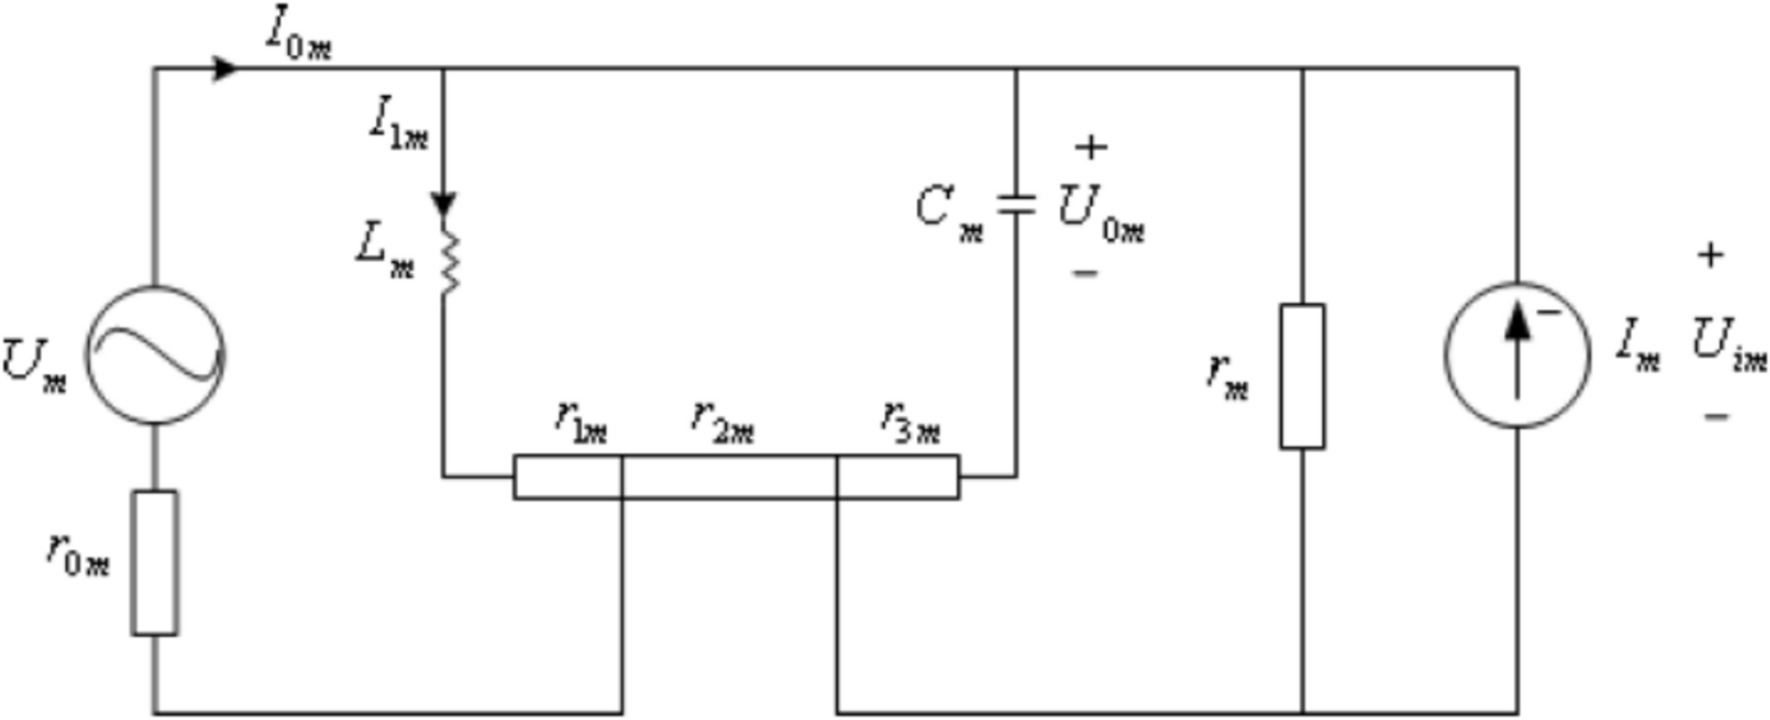


In Eq. (14), the node dynamic function \(f(V_ )\) incorporates core equations from the neuron model (W-Z or HH model). W-Z model substitutes Eqs. (9)–(11) (membrane potential, inductance, resistance-related equations), while the HH model uses classic sodium, potassium, and leak current equations. Network calculation steps are given as follows. (1) Obtain skin deformation-induced input current \(I(r)\) via the contact mechanics model (Eqs. (1)–(8)). (2) Input \(I(r)\) as external stimulation into the W-Z or HH model to generate individual node membrane potential \(U_ (t)\). (3) Calculate inter-node coupling currents using the star-like network adjacency matrix (Eq. (15)) and coupling strength. (4) Substitute into Eq. (14) and perform numerical iteration (step size: 0.01 ms) to obtain the network’s dynamic response, then compute energy consumption using energy formulas.
To investigate energy coding in a stimulated neuron network, bidirectionally asymmetric coupling strengths are considered. Namely neuron 1 is coupled to neuron 2 with coupling strength \(\omega_\), and neuron 2 to neuron 1 with \(\omega_\)(\(\omega_ \ne \omega_\)). we assume that asynaptic coupling strengths between neurons are statistically uniformly distributed (Rubinov et al. 2011). In the contact mechanics model, MCNC (Merkel cell-neurite complex) is considered, while the firing rates of MCNCs belonged to SA1 mechanoreceptors(Johansson et al.1982).Consequently, in the simulations, SA1 receptors are focused on.
For simplicity, a star-like neuron network with 9 nodes is considered (Fig. 3). In this star-like neuron network, the first neuron is taken as the hub and other neurons are peripheral nodes. And then, the first neuron is coupled with all peripheral neurons while all peripheral neurons are not coupled with each other. Suppose \(w_\) denotes the coupling between the \(i}\) neuron and the \(j}\) neuron in the star-like neuron network, the coupling matrix can be described as.
$$ W = \left[ c} 0 & } & } & \cdots & } \\ } & 0 & 0 & \cdots & 0 \\ } & 0 & 0 & \cdots & 0 \\ \vdots & \vdots & \vdots & \vdots & \vdots \\ } & 0 & 0 & \cdots & 0 \\ \end } \right] $$
(16)
Fig. 3 The alternative text for this image may have been generated using AI.
A star-like neuron network with 9 nodes
Skin displacement vs. distance from force application pointAccording to the research about SAI receptor (Johansson et al.1982), the density of SAI input receptors under the fingertip skin is about 60–80 per square centimeter (Peters et al. 2017; Moujahid et al.2011). SAI input has good spatial interpretation ability for stimuli within a range of 0.5 mm. This is much smaller than SAI’s own receptive field of 2-3 mm. Therefore, SAI receptors located at different distances from the point of force application are more sensitive to external stimuli. Results in (Phillips and Johnson KO 1981a) predicted that non-zero skin displacement at all distances from the force application point theoretically, but afferent responses are unaffected by forces acting at \(r_ > 3\) mm from the receptor.
To isolate the core effects of network topology (star-like structure) and external pressure on neural synchronization and energy encoding, the skin is assumed homogeneous, isotropic, infinite, and linearly elastic. This simplification allows us to establish a clear baseline for understanding how pressure-induced skin deformation translates to neural activity, without confounding variables from skin heterogeneity. Additionally, this assumption aligns with previous computational studies on tactile sensing (Sripati et al. 2006; Yao and Wang 2019), enabling direct comparison with existing literature and facilitating the validation of our model’s fundamental mechanisms.
Based on above, we assume the force is applied at the center of the fingertip skin. According to the contact mechanics model (formula (1)-(7)), effect of indentation depth on the displacement of skin can be calculated and depicted in Fig. 4, which suggests that the shallower the indentation depth is, the smaller the skin displacement along the normal direction is. It suggests that with change of the force acting on the sphere, skin deformation shows different. When the force is fixed, the farther away from the contact center, the smaller the skin deformation is. When the distance from the force application is fixed, the greater the pressure becomes, the deeper the deformation is. Namely, deeper indentation can cause greater strain on the fingertip skin, while strain is closely related to the spiking and energy of neuron.
Fig. 4 The alternative text for this image may have been generated using AI.
Displacement of skin dependent on the indentation depth (sphere radius is 5 mm)
A comparison between W-Z model and HH modelIn reference (Yao and Wang 2019), the authors constructed a network consisting of 20 HH neurons by dividing the fingertip into 20 equal-area subregions (Fig. 5). It was supposed that the connection strength between nodes is randomly distributed in the range of [0.1, 0.3] and the force application point is located at the center of the area. When a sphere with 5 mm radius is squeezed into the skin of the fingertip with an extrusion of depth 3 mm, considering the schematic diagram in Fig. 5, the nodes are taken as HH model and W-Z model, respectively, and the energy consumption of the neurons can be calculated (shown in Fig. 6). Figure 6 indicates that, compared to the HH model, W-Z model requires less energy consumption. In Fig. 6, it can also be found that energy fluctuations stem from neuron position. The neurons near the contact center (e.g., Nos. 8, 13) experience stronger compression, leading to more active firing and higher energy consumption, while peripheral neurons have weaker stimulation and lower consumption, resulting in position-dependent fluctuations.
Fig. 5 The alternative text for this image may have been generated using AI.
Schematic diagram of a structural network of the MCNC of glabrous skin(Yao and Wang 2019)
Fig. 6 The alternative text for this image may have been generated using AI.
Energy consumption of neurons in networks (Yao and Wang 2019) comprising HH and W-Z models, respectively. The upper is with HH model as nodes, which is derived from integrating the power of ion channel currents (sodium, potassium, leak currents). The lower is with W-Z model as nodes using membrane potential, inductance, and resistance-based formulas
Nextly, the star-like neuron network with the structure shown in Fig. 3 is consider, where the nodes are selected as HH model and W-Z model, respectively. A sphere with 5 mm radius is used. The indentation depth is chosen as \(d=4mm\). This choice is well-founded that human fingertip skin is 2–5 mm thick (Gerling and Thomas 2008; Kim et al. 2010), and 4 mm indentation depth can activate deep dermal SAI mechanoreceptors without tissue damage. It aligns with the result (Sripati et al. 2006; Yao and Wang 2019) using 3–5 mm depths for meaningful tactile interactions. The star-like consisting one hub node and eight peripheral nodes, coupling strength \(_\) are uniformly distributed in [0.1, 0.3]. The energy consumption is depicted in Fig. 7. Figure 7 also verifies that W-Z model requires less energy consumption than HH model, which is the same as the result of Fig. 6. Figure 6 and Fig. 7 validate W-Z model’s efficiency in tactile network energy research, and comparisons with the Yao-Wang model’s firing characteristics further confirm its physiological rationality.
Fig. 7 The alternative text for this image may have been generated using AI.
Energy consumption of neurons in star-like networks comprising HH and W-Z models, respectively. The upper is with HH model as node. The lower is with W-Z model as node
In Fig. 7, it is also found that the hub node accounts for much of the energy consumption due to three factors: (1) As a signal integration center, it receives input from all peripheral nodes, involving frequent synaptic transmission and active ion transmembrane transport. (2) Directly subjected to external compression, it consumes more energy to resist deformation and maintain membrane potential stability. In addition, Johansson et al. (Johansson et al. 1982) confirmed that neurons in the fingertip’s core region exhibit significantly higher firing rates and metabolic activity than peripheral neurons, which is consistent with the hub node’s characteristics in our study.
Furthermore, the energy consumption and the average firing rate of each sensory neuron when the fingertip is under pressure is given in Table 1. Table 1 demonstrates the correlation between firing rate and energy consumption observed in the star-like neuron network. The central neuron, due to the integration of multiple input signals, experiences a significantly stronger depolarization of membrane potential compared to the surrounding neurons. Its firing rate reaches 27 Hz and energy consumption is 806.24 × 10⁻12 J, both of which are the highest in the network. The firing rate of the surrounding neurons remains stable at 25-26 Hz, with relatively consistent energy consumption levels, and overall lower than that of the central neurons.
Table 1 Energy consumption and average firing rate of each neuronAfter fingertip squeezing stimulation, in the star-shaped neuronal network, the central neuron, due to the integration of multiple input signals, experiences a significantly stronger depolarization of membrane potential compared to the surrounding neurons. Its firing rate reaches 27 Hz and energy consumption is 806.24 × 10⁻12 J, both of which are the highest in the network. The firing rate of the surrounding neurons remains stable at 25-26 Hz, with relatively consistent energy consumption levels, and overall lower than that of the central neurons.
In light of the above discussion, it is known that W-Z model is inherently designed for energy calculation, which directly aligns with our focus on the “stimulation-synchronization-energy metabolism” in tactile cognition. Therefore, in following investigation, W-Z model is chosen as the network nodes and a sphere with 5 mm radius is used.
Synchronization of the star-like neuron networkTo discuss the dynamics of the star-like neuron network, two measures are mentioned, the mean-max correlation coefficient (Zhu et al. 2018) and Kuramoto order parameter (Bergner et al. 2012). Suppose the indentation depth \(d=4\text\), and the star-like is adopted the structure in Fig. 3. Coupling strengths are uniformly distributed in [0.01, 0.03], [0.03,0.05], [0.05, 0.08], [0.08, 0.5], [0.5, 0.8], [0.8, 1], respectively. The mean-max correlation coefficient and Kuramoto order parameters are calculated and listed in Table 2. From Table 2, the mean-max correlation coefficient is close to 1, which means that the network’s behavior approaches a state of multi-cluster synchronous coexistence. The membrane potentials of the neurons are depicted in Fig. 8, which suggests that other neurons achieve synchronization as time going except for neuron 1. It verified the result in Table 2. Furthermore, from Table 2, it’s obvious that, the greater the coupling strength is, the larger the mean-max correlation coefficient is. Namely, the synchronization between peripheral nodes can be achieved easily with coupling strength increasing.
Table 2 Mean-max correlation coefficient and Kuramoto order parametersFig. 8 The alternative text for this image may have been generated using AI.
The membrane potentials of the neurons in the star-like network shown in Fig. 3 with coupling strength distributed in (0.5,0.8)
To calculate the Kuramoto order parameters of the above-mentioned star-like network composed W-Z models, the phase space reconstruction theory is used. Because the W-Z neuron model discharge state has multiple rotation centers, to calculate the phase, the attractor should be projected onto a plane with only one rotation center. In our work, the \(V(t) - V(t - \tau )\) plane is discussed, where delay is \(\tau = 1\), and the rotation center becomes(0, 0).Therefore, the instantaneous phase of W-Z neuron can be defined as.
$$ \theta (t) = \arctan (V(t - \tau )/V(t)) $$
(17)
According to mutual information method (Kantz 2001), \(\tau = 1\) is determined. And then, instantaneous phase angle(Li et al. 2008) on the \(V(t) - V(t - \tau )\) plane is depicted as
$$ \varphi (t) = \left\c} c} & c} & c} & \\ \end V(t) > 0,V(t - \tau ) > 0} \\ \end } \\ \end } \\ c} & c} & c} & \\ \end V(t) = 0,V(t - \tau ) > 0} \\ \end } \\ \end } \\ c} & c} & \\ \end V(t) < 0,V(t - \tau ) > 0} \\ \end } \\ c} & c} & \\ \end V(t) < 0,V(t - \tau ) < 0} \\ \end } \\ c} & c} & \\ \end V(t) = 0,V(t - \tau ) < 0} \\ \end } \\ c} & c} & \\ \end V(t) > 0,V(t - \tau ) < 0} \\ \end } \\ \end } \right. $$
(18)
where the value of \(k\) follows the principles.
$$ k = \left\c} c} & \begin Vt\tau } \hfill \\ Vt} \hfill \\ \end \\ \end } \\ c} & c} c} c} c} & & \\ \end } & & & \\ \end } & & & \\ \end } & & & \\ \end } \\ \end } \\ \end } \right. $$
(19)
And then, phase difference between the neurons is calculated and depicted in Fig. 9, which suggests that the phase synchronization between the hub and peripheral neurons can be achieved (Fig. 9(a)). From Fig. 9 (b) (c) (d), we can see that phase synchronization has also been reached between peripheral neurons. It suggests that there are synchronous clusters in the network depicted in Fig. 3, which is consistent with the results in Table 2. By calculating the phase angle of the neurons, Kuramoto order parameters can be obtained as \(r_\) and \(r_\)(see Table 2). From Table 2, the remote synchronization between the hub neuron and peripheral neurons can be realized.
Fig. 9 The alternative text for this image may have been generated using AI.
Phase difference between different neurons. In a, \(\Delta_ (j = 2,3, \cdots ,9)\) denotes the phase difference between the hub and the \(j}\) \((j = 2,3, \cdots ,9)\) neuron. In b, \(\Delta_ (j = 3,4, \cdots ,9)\) means the phase difference between the second neuron and the \(j}\) \((j = 3,4, \cdots ,9)\) neuron. In c, \(\Delta_ (j = 4,5, \cdots ,9)\) is the phase difference between the third neuron and the \(j}\) \((j = 4,5, \cdots ,9)\) neuron. In (d), \(\Delta_ (j = 5,6, \cdots ,9)\) means the phase difference between the fourth neuron and the \(j}\) \((j = 5,6, \cdots ,9)\) neuron
As we all know, during the process of neuron’s synchronization, many neurons are active simultaneously, which will induce a sharp increase in energy demand. Therefore, when the synchronization is achieved between the hub and peripheral neuron, corresponding change will occur for the energy consumed. The power consumed is given in Fig. 10 and Fig. 11. Figure 10 gives the energy consumed by neuron 1 and neuron 2, which indicates that the energy consumed by the hub neuron is much more than that of the peripheral neuron. It is mainly due to the fact that the hub neuron consumed much energy to resist the external pressure and dominate remote synchronization by adjusting its firing pattern to match peripheral nodes, increasing metabolic costs. The energy consumed by the peripheral neuron to synchronize the hub neuron is much less than that of the hub neuron. Furthermore, the total energy consumed by all peripheral neurons is calculated and depicted in Fig. 11, which indicates that the energy consumed by all peripheral neurons is also less than the energy consumed by hub neuron. Figure 10 and Fig. 11 demonstrate the pivotal role of the hub neuron in the star-like neuron network of the fingertip skin when compressed by external force. More simulation suggests that the same result can be obtained for indentation depth \(d = 1}\),\(d = 2}\),\(d = 3}\) and \(d = 5}\).
Fig. 10 The alternative text for this image may have been generated using AI.
Comparison of energy consumption by the hub neuron and one peripheral neuron with unit 10–12 J
Fig. 11 The alternative text for this image may have been generated using AI.
Energy consumption: hub neuron vs. peripheral neurons with unit 10–12 J
Relationship between pressure and energy consumption of the networkIn this section, we analyze the change of energy consumption in a multi-layer star-like neural network with 8 neurons per layer(see Fig. 12). First, we also assume synaptic coupling strengths between neurons are uniformly distributed in [0.1, 0.3]. Neuron energy consumption is calculated and plotted in Fig. 13.
Fig. 12 The alternative text for this image may have been generated using AI.
The topological structure of a multi-layer star-like neuron network
Fig. 13 The alternative text for this image may have been generated using AI.
The energy consumption (10⁻⁸ J) of the neurons with a different distance from the force application
From Fig. 13, following results are obtained. Neuron need to consume energy to counter external pressure when the fingertip skin is compressed by a sphere. The neuron energy consumption is spatially distributed with a “high center, low on both sides” pattern centered around the point of force application, and the indentation depth (pressure) significantly regulates the peak value, distribution range, and secondary fluctuations of energy consumption. Under low pressure (d = 1 mm), the peak value of energy consumption is low and the distribution is the narrowest, accompanied by secondary energy peaks due to skin elastic rebound, reflecting energy conservation under weak stimulation but accompanied by additional energy expenditure. Under moderate pressure (d = 3 mm), the peak value of energy consumption reaches its highest level, with a moderate distribution and no secondary fluctuations, representing the optimal state of energy utilization efficiency in the tactile system, enabling precise pressure localization and signal encoding. Under high pressure (d = 4 ~ 5 mm), the peak value of energy consumption decreases, the distribution range significantly widens, and secondary fluctuations disappear. This spatial dispersion of energy consumption avoids excessive activation and damage to local neurons, but it is accompanied by a slight decrease in tactile localization accuracy. These results reveal the dynamic trade-off strategy between energy consumption and perceptual function in the fingertip tactile system, providing experimental evidence for the neuron energy encoding mechanism of skin pressure signals.
The relation between the layer of the star-like network and the energy consumptionWhen the skin of the fingertip is subjected to external compression, the neuron population in the contacting center can receive stimulus. Consider the indentation depth \(d = 4}\), the average energy consumption of the star-like neuron network with different layers can be calculated and illustrated in Fig. 14. Figure 14 illustrates how the average energy consumption of the neuron network changes with its layer count \(_\). It is obvious that the energy consumption follows a single-peak trend: it rises as layers increase from 0 to 100, peaking at \(_\) ≈ 100 when the network achieves the optimal balance between energy use and computational efficiency. Beyond 100 layers, energy consumption decreases due to redundancy or gradient vanishing, where deeper layers fail to contribute effectively. Namely, when the neuron network is within the contact radius, the neurons consum much energy to counter the external compression and transmit nerve impulses to peripheral neurons. As the network size increases, the neuron of the outer layer tends resting state, the energy of the network gradually decreases. It reveals a dynamic trade-off between energy expenditure and functional performance, highlighting an optimal layer count for both biological and artificial neural network design.
Fig. 14 The alternative text for this image may have been generated using AI.
Relation between the layer and the energy consumption of the star-like network for indentation depth \(d = 4}\), where \(k_\) is the number of layers of the star-like network
The relation between the indentation depth and the energy consumption of a star -like networkConsider the star-like networks with 2, 10, 100, 150 layers, simulation results for indentation depths from 1 to 5 mm are shown in Fig. 15. From Fig. 15, it can be known that networks with different layers exhibit distinct energy response patterns to pressure, and there exists an optimal number of layers (k₁ = 100) that strikes a balance between energy consumption and pressure encoding efficiency. For this network, energy consumption initially increases with the depth of indentation, reaches a peak at a moderate pressure (2 ~ 3), and then slowly decreases.This is consistent with the previous unimodal pattern, meaning that the network with this number of layers has the highest energy utilization efficiency under moderate pressure and can accurately encode pressure signals. When the indentation depth is small (< 2), energy consumption rapidly climbs to a peak and then slowly decreases. It means that the small network is very sensitive to initial pressure changes, but when the pressure continues to increase, energy consumption is difficult to maintain at a high level due to the limited network capacity. For a deep network(k₁ = 150), energy consumption continues to rise with indentation depth increasing and tends to stabilize under high pressure. This is due to deep network requires more energy to process complex pressure signals, and there is no energy decay under high pressure, indicating that its redundant structure can maintain continuous activation.
Fig. 15 The alternative text for this image may have been generated using AI.
The total energy consumption of networks under different indentation depths
Comments (0)