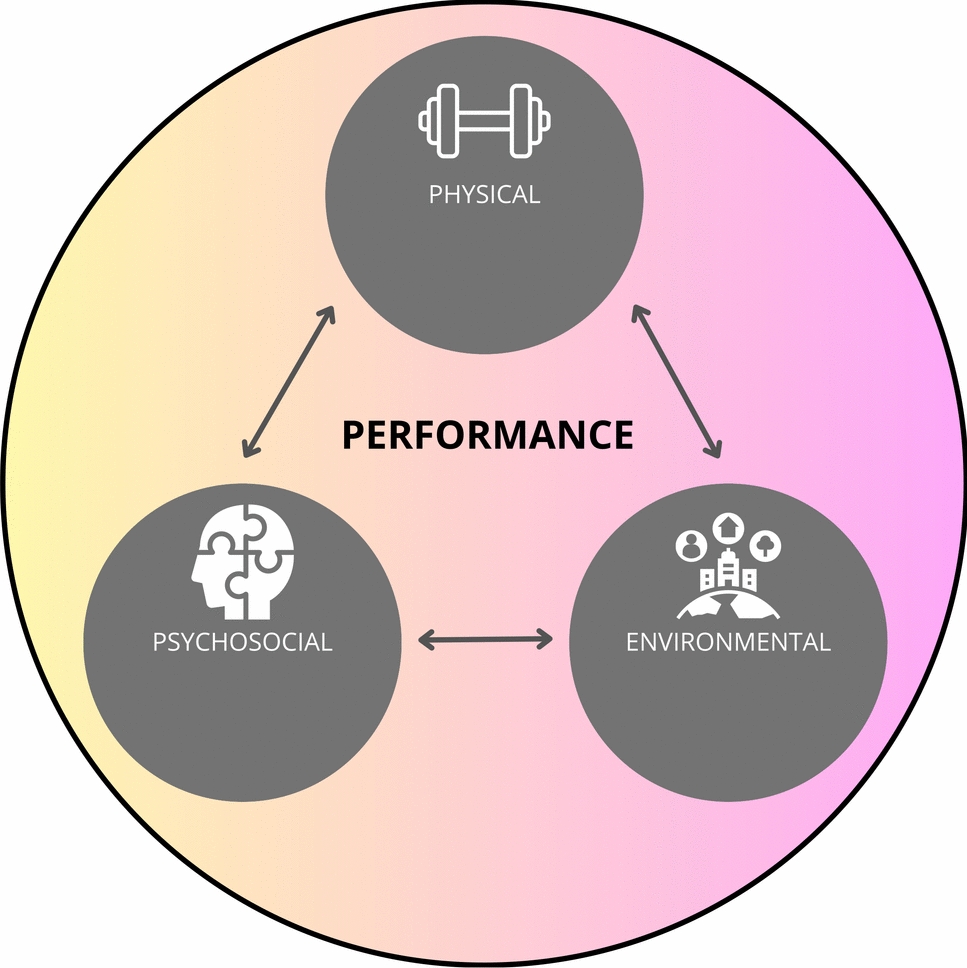
This section summarizes the tools and metrics commonly used to monitor training load, athlete state and training response in applied sport settings. In line with the conceptual framework presented in Fig. 1, tools are organized according to the primary construct they inform, acknowledging that some measures may contribute to multiple constructs depending on measurement timing and context. The focus is placed on practical applicability, measurement considerations, and interpretive scope rather than exhaustive methodological detail.
3.1 Monitoring Training Load
Within the monitoring framework (Fig. 1), training load represents the imposed stimulus of training and competition and constitutes the primary input to the athlete monitoring system. Training load refers to the total amount of stress imposed on an athlete through structured physical activity and is a central concept in both performance development and injury prevention [37]. It is commonly divided into two main components: external load and internal load [38]. External load encompasses the objective work completed by the athlete, such as distance covered, weight lifted, speed, number of jumps, or accelerations performed [38]. These measures are typically derived from tracking devices, gym-based data, or training plans, and are specific to the type of activity performed. In contrast, internal load represents the immediate physiological and perceptual response of the athlete to that external work, commonly quantified using measures such as HR or session rating of perceived exertion (sRPE) [38]. While internal load reflects the acute cost of training, it should be distinguished from athlete state indicators (e.g., fatigue or readiness), which describe the athlete’s current functional status. Both internal and external loads provide complementary insights: the external load reflects the dose of training, while the internal load captures the individual response to that dose. Importantly, neither dimension has a universally accepted gold-standard metric. The selection of appropriate indicators depends heavily on the training context and sport demands. For example, HR may be highly valid for monitoring internal load during aerobic conditioning but less effective for short-duration, high-intensity efforts like sprinting or strength training. Accordingly, training load metrics are primarily used to describe what was prescribed and completed, providing important context for interpreting subsequent changes in athlete state and training response.
3.2 Monitoring Athlete State3.2.1 Neuromuscular and Performance-Based Indicators
Within the monitoring framework (Fig. 1), neuromuscular and performance-based indicators primarily inform the athlete state by reflecting short-term fatigue expression and readiness to train or compete. These tests are most informative when performed in close temporal proximity to training (e.g., pre-session or post-session) and interpreted relative to individual baselines.
Velocity-based training (VBT) offers a practical and objective approach to assess neuromuscular readiness without requiring maximal testing [39]. Because bar speed at a given load correlates with fatigue and performance capacity [40], tracking barbell velocity can help detect day-to-day fluctuations in readiness due to factors like sleep [41], nutrition [42], or psychological stress [43]. Mean propulsive velocity at moderate to heavy loads [40–80% 1RM (repetition maximum)] demonstrates similar sensitivity to fatigue as CMJ height, particularly at 40% and 80% 1RM where post-exercise changes showed moderate agreement (ICC = 0.71 and 0.58, respectively; CV = 5.1–8.5%) [44]. Additionally, velocity loss thresholds can be applied to regulate training volume and intensity. When bar speed drops beyond a set threshold, practitioners can adjust training in real time to prevent excessive fatigue [39]. Linear position transducers are among the most usable devices for measuring bar velocity, with high validity (r = 0.96–0.98) and acceptable reliability (ICC ≈ 0.67; CV = 6.6%) [45]. However, newer, low-cost options (e.g., smartphone apps) are emerging [46]. While effective, these metrics are not immune to external factors like motivation or technique variability and should be interpreted in conjunction with contextual indicators (e.g., perceived exertion) [39].
Isometric strength testing, involving muscle contractions without joint movement, offers an alternative for assessing neuromuscular readiness, particularly when maximal dynamic efforts are not feasible [47]. These assessments are useful in both rehabilitation and performance settings due to their safety, simplicity and objectivity. Among the most reliable indicators is net peak force, which has demonstrated high test–retest reliability (ICC ≥ 0.80, often up to 0.99) [48], making it suitable for tracking fatigue or performance impairments. However, implementation challenges exist, especially in large teams. Standardizing joint angles (e.g., knee, hip) across athletes requires time, equipment and trained personnel, reducing feasibility in time-constrained environments. Additionally, while rate of force development is sometimes used, it is more sensitive to testing inconsistencies and thus less reliable [49]. Practitioners are encouraged to prioritize robust metrics, such as peak force, when integrating isometric testing into readiness monitoring protocols.
The CMJ is one of the most widely used tests for monitoring short-term neuromuscular fatigue and pre-session performance readiness in elite athletes [50] due to its simplicity [51], efficiency [52], and non-invasive nature [51]. While jump height and peak power are traditionally used [50], they may lack sensitivity to short-term fatigue, as athletes can maintain jump height by altering their jump strategy [53]. Instead, time-based and strategy-related variables, such as time to take-off and countermovement depth, offer greater sensitivity to fatigue-related changes [53]. For instance, after intensive training, both metrics have shown large reductions (effect sizes ≥ 0.8) with CV values typically < 10%, indicating acceptable reliability [54]. These shifts reflect subtle neuromuscular impairments, as fatigued athletes often prolong the force application phase to compensate for reduced output. In terms of feasibility, CMJ testing, especially using force plates, is time-efficient, easily integrated into warm-ups, and scalable to large teams. Portable systems and user-friendly software further enhance its accessibility, although cost and expertise may limit use in some settings [54].
Short-duration cycle ergometer tests, such as the peak power protocol on a Wattbike, offer a reliable, non-weight-bearing alternative for assessing neuromuscular fatigue in team sport athletes [55, 56]. The protocol, consisting of two 6-s sprints and minimal warm-up, requires just 2–3 min per athlete, making it highly feasible for moderate to large groups. However, the limited warm-up may increase variability in performance and elevate the risk of Type I errors, particularly if the warm-up is not standardized across sessions. To improve repeatability, practitioners are advised to implement a consistent short warm-up protocol before testing. It can be administered by a single staff member with minimal disruption, and its reliability is excellent (ICC = 0.96, CV = 3.0%) [56].
3.2.2 Subjective Indicators of Fatigue and Readiness
Psychological and social factors significantly influence athlete readiness, especially in high-pressure environments where personal, competitive and interpersonal demands intersect. Monitoring these domains offers a low-cost and scalable means to detect accumulating stress, motivation changes, or early signs of burnout. Validated tools like the Recovery-Stress Questionnaire for Athletes (RESTQ-Sport) [57] and the Daily Analysis of Life Demands for Athletes (DALDA) [58] help quantify emotional states and identify stress sources across sport and everyday life. These tools support proactive management of readiness by enabling early intervention when athletes report increasing strain, irritability, or reduced recovery. Their feasibility, requiring less than 5 min and no equipment, makes them well suited for regular monitoring in elite and team settings. However, interpretation should emphasize trends over time and consider subscale variability [59]. Composite factor scores, such as overall stress or recovery, tend to show greater reliability than individual items [60]. Ultimately, fostering a culture of trust is essential for accurate self-reporting and effective psychological monitoring. Athletes must feel confident that their responses will be used to support their well-being and performance, rather than being viewed as a reason for reduced playing time or exclusion from selection.
Athletes frequently experience physical discomfort that may not be detectable through objective assessments, making subjective self-reports a valuable tool for monitoring readiness [59]. Commonly tracked sensations include muscle soreness, pain and fatigue, which directly affect an athlete’s ability to train, compete and recover [61]. Muscle soreness, a natural response to physical exertion, can indicate either adaptive training responses or incomplete recovery depending on its intensity and duration [62]. Self-reported scales help identify patterns of excessive soreness, supporting tailored recovery protocols. Similarly, perceived fatigue, often assessed through brief questionnaires like the Hooper Index, can highlight accumulated load and insufficient recovery [63]. Pain requires more nuanced interpretation, as it may stem from structural injury or non-structural sources such as stress or fear of movement. The Oslo Sports Trauma Research Center (OSTRC) Questionnaire enables athletes to report pain and its impact on participation, helping staff respond appropriately through medical evaluation or training modifications [64]. These self-reported tools are highly feasible (although their utility ultimately depends on the quality and honesty of athlete responses), requiring minimal time (< 1 min), no equipment, and easy integration into digital platforms. Their low cost and scalability make them ideal for large squads or low-resource environments. While test–retest reliability varies, consistent implementation and individual baseline tracking enhance their value in detecting meaningful trends [65].
Despite their practical advantages, the effectiveness of subjective monitoring tools is highly contingent on data quality and athlete engagement. Recent qualitative research has shown that self-reported data may be intentionally or unintentionally distorted when athletes perceive a lack of trust, unclear purpose or potential negative consequences associated with their responses [66, 67]. Coventry et al. [66] reported that elite athletes may under-report fatigue or soreness when they fear repercussions related to selection, training modification, or staff judgement. Similarly, McCall et al. [67] demonstrated that athletes’ willingness to report honestly is strongly influenced by interpersonal factors, including transparency, perceived empathy, and the extent to which feedback leads to visible and meaningful action. These findings highlight that subjective monitoring should not be viewed solely as a measurement issue, but as a socially mediated process embedded within coach–athlete and practitioner–athlete relationships. When athletes understand why information is collected and observe consistent, supportive responses to their input, subjective measures can provide sensitive and ecologically valid insights into fatigue and readiness. Conversely, poor implementation may compromise data quality, limiting interpretability regardless of the tool’s psychometric properties.
3.2.3 Physiological Markers of Fatigue and Readiness
Physiological markers provide valuable insight into an athlete’s current functional state and are particularly useful for assessing short-term fatigue and readiness within the athlete state component of the monitoring framework (Fig. 1) [68]. These measures are most informative when collected at standardized time points close to training or competition and interpreted relative to individual baselines. Recent integrative frameworks have similarly emphasized the strategic use of physiological markers to monitor fatigue and recovery, advocating the selective combination of high-precision methods for research contexts with more feasible tools (e.g., HR, HRV and neuromuscular tests) for day-to-day practice [69].
Autonomic and cardiovascular markers are among the most commonly used physiological indicators of readiness [70]. Resting HR and HRV, particularly the natural logarithm of the root mean square of successive differences (Ln rMSSD), are typically collected in the morning or during sleep to capture parasympathetic activity while minimizing external confounders [70,71,72]. These measures are sensitive to acute stress and recovery fluctuations over the previous 12–24 h and are therefore well suited to informing day-to-day readiness decisions. However, their utility can be limited by substantial day-to-day variability, which necessitates careful standardization of measurement conditions and interpretation against individual reference values. Weekly rolling averages based on at least three to four measurements per week provide more stable insights into short-term trends and help distinguish true physiological changes from normal biological noise [73].
Beyond resting measures, submaximal exercise heart rate (HRex) recorded during standardized aerobic tests reflects the athlete’s acute physiological state and tolerance to training load. When assessed under consistent conditions, HRex can inform readiness to train and, in some contexts, indicate emerging fatigue. For example, reductions in 4-min HRex strongly correlate with improvements in Yo-Yo IR1 performance (r = − 0.57) [74] and higher HRex has been linked to injury risk in underloaded athletes [75]. A systematic review reported HRex reliability as high (ICC = 0.88; TE = 1.6% HRmax) [76]. Given its low cost, practicality and acceptable reliability, HRex represents a feasible physiological marker for regular readiness monitoring in applied settings.
Biochemical markers of muscle damage, particularly creatine kinase (CK), can also contribute to the assessment of fatigue and recovery status when interpreted within an appropriate temporal window. CK primarily reflects cumulative muscle stress and recovery processes when measured 24–72 h following exercise and is therefore not well suited for same-day readiness decisions [77]. Instead, elevated CK values within this time frame may indicate unresolved muscle damage or incomplete recovery, particularly in sports characterized by repeated eccentric loading [78]. Due to large inter-individual variability (CV = 20%) [79], CK should be interpreted using individualized baselines rather than absolute thresholds, with deviations of approximately 1.5–2 standard deviations (SDs) from an athlete’s typical range often used to flag atypical responses [7]. While CK can support fatigue and recovery assessment, its moderate reliability (ICC = 0.49–0.64) and logistical demands limit its usefulness for frequent monitoring, especially in large team environments [80].
Taken together, autonomic, cardiovascular and selected biochemical markers primarily inform the athlete state by reflecting the current balance between fatigue and recovery. Their value lies in supporting short-term decisions related to training readiness, particularly when measurements are standardized, interpreted longitudinally, and integrated with subjective and performance-based indicators.
3.3 Monitoring Training Response
In contrast to markers of athlete state, indicators of training response are used to evaluate how athletes adapt to training over longer time scales. These measures are less informative for daily decision making and instead support the identification of positive adaptation, stagnation or maladaptive responses when interpreted longitudinally across training cycles.
Markers of inflammation and immune function provide insight into systemic responses to prolonged or excessive training loads [81]. Cytokines such as interleukin-6 (IL-6), tumour necrosis factor-alpha (TNF-α), and interleukin-10 (IL-10), along with C-reactive protein, reflect inflammatory and immune processes associated with training stress and recovery [78]. Elevated concentrations of these markers often occur following periods of intensified training or congested competition schedules and may indicate an increased risk of illness or impaired recovery capacity [82]. However, due to their invasive nature, cost and limited feasibility for frequent sampling, these markers are best suited for periodic assessment or targeted investigations rather than routine monitoring. Importantly, they are often considered lagging indicators, meaning that physiological disruption may already be established by the time changes are detected.
Endocrine and metabolic markers further contribute to the assessment of longer-term training response and stress balance. Blood urea nitrogen reflects protein metabolism and overall training load exposure, with chronically elevated values potentially indicating excessive workload or insufficient recovery [78]. Similarly, the testosterone-to-cortisol (T:C) ratio is commonly used as an index of anabolic–catabolic balance [83]. Sustained reductions in this ratio over time may signal maladaptation or non-functional over-reaching, particularly during periods of high training volume or insufficient recovery [84]. As with other biochemical markers, endocrine measures should not be interpreted in isolation or based on single time points. Their primary value lies in longitudinal trend analysis, where persistent deviations from an athlete’s normal range can inform evaluations of training effectiveness and recovery adequacy.
While some markers discussed in the previous section, such as HRV or CK, may also contribute to the interpretation of training response when tracked over extended periods, their role within this context depends on measurement frequency and analytical time frame. When interpreted longitudinally, these markers can help distinguish between expected fatigue associated with planned overload and maladaptive responses that compromise adaptation. Overall, indicators of training response support the evaluation of whether imposed training loads are producing the intended adaptations or leading toward maladaptation. Although their practical application is often constrained by cost and feasibility, these measures provide valuable physiological context when used selectively and integrated with load data, performance trends, and athlete-reported outcomes.
3.4 Sleep and Recovery-Related Processes
Within the monitoring framework presented in Fig. 1, sleep is not treated as a standalone outcome but as a central recovery-related process that modulates both athlete state (fatigue and readiness) and longer-term training response. Acute disturbances in sleep primarily influence next-day readiness and perceived fatigue, whereas chronic sleep restriction or consistently poor sleep quality may impair recovery capacity and contribute to maladaptive training responses over time. Accordingly, the interpretation of sleep metrics depends strongly on the timing and frequency of assessment. Sleep is a fundamental component of recovery, influencing cognitive function, physical restoration, immune health, and emotional regulation [85]. However, athletes often experience disrupted or insufficient sleep, particularly during congested schedules, travel or heightened psychological stress. Irregular training times, late-night matches, early sessions, and pre-competition anxiety can all impair sleep quality, while excessive screen time may delay sleep onset and reduce overall sleep efficiency [85]. To monitor sleep, both subjective and objective tools are used. Self-report methods, such as sleep diaries, the Pittsburgh Sleep Quality Index (PSQI) [86], or the Athlete Sleep Screening Questionnaire (ASSQ) [87], are highly feasible and low-cost. However, they are susceptible to recall bias and limited in detecting nuanced changes. In elite athletes, the PSQI has shown only poor-to-moderate reliability (ICC = 0.45–0.55) and a minimum detectable change (MDC) of 3 points [88]. Objective tools like actigraphy, which use wrist-worn accelerometers, provide more reliable and continuous assessments of sleep duration and movement patterns [89]. Although actigraphy cannot accurately differentiate sleep stages or detect all wake episodes [90], it is a practical tool for team sports, especially when combined with sleep diaries. In contrast, polysomnography offers high accuracy but poor feasibility due to cost and logistical demands [91]. Poor sleep patterns, such as short sleep duration, prolonged sleep latency, or frequent awakenings, can impair cognitive performance, increase fatigue, and reduce decision-making ability, all of which impact sport performance [85]. Monitoring short-term changes in sleep allows practitioners to identify declines in next-day readiness and increased fatigue, particularly when assessed in close temporal proximity to training or competition [91]. Given its importance across multiple recovery systems, sleep is arguably the most impactful, modifiable, and cost-effective recovery tool available to high-performance athletes. When interpreted contextually and tracked longitudinally, sleep data can guide individualized interventions that support short-term readiness and inform evaluations of longer-term training response and adaptation.
To enhance conceptual clarity and practical applicability, Table 2 summarizes the monitoring tools discussed in this section and maps each metric to its primary role within the monitoring framework (Fig. 1), namely training load, athlete state (fatigue and readiness), or training response. Where relevant, tools that may inform multiple constructs are identified, with interpretation contingent on measurement timing and longitudinal context. This structured overview is intended to support practitioners in selecting and interpreting monitoring tools in a manner consistent with the proposed framework.
Table 2 Summary of common athlete-monitoring tools: theoretical rationale, feasibility, and

Comments (0)