
Remember me
This retrospective observational study included 273 consecutive patients with AS with a small annulus who underwent TAVR from June 2020 to December 2021 at five high-volume centers. Furthermore, an external validation cohort of 118 equally treated patients was provided by 2 centers (enrolled from July 2020 to December 2021). A small annulus was defined as a computed tomography image showing an annular circumference < 72 mm or an area < 400 mm2. As recommended by the guidelines, the final decision on whether to proceed with TAVR was made by the local cardiac team [10, 11]. In addition, 23 patients with missing TTE or LHC measurements at discharge and 15 patients with poor computed tomography angiography (CTA) scan quality were excluded. This study complied with the Declaration of Helsinki and was approved by the local ethic commissions. All patients provided written informed consent for procedures and subsequent data collection.
Definitions and postprocedural measurementsPPMThe LVOT diameter was measured from the outer boundary to the outer boundary of the THV directly below the left ventricular boundary of the THV [12]. The pulsed wave Doppler sampling volume was positioned at the THV tip at the same position as the LVOT diameter measurement. For EOAi, PPM is defined as not significant if EOAi >0.85 cm2/m2; if >0.65 and < 0.85 cm2/m2, PPM is defined as moderate; and if < 0.65 cm2/m2, PPM is defined as severe. Additionally, as previously recommended, obese patients (body mass index ≥ 30 kg/m2) used a lower EOAi cutoff [13]: if the EOAi was >0.70 cm2/m2, it was not significant; if >0.55 and < 0.70 cm2/m2, PPM was defined as moderate; if < 0.55 cm2/m2, PPM was defined as severe.
TTE measurementPGAV was obtained by subtracting the LVOT pressure from the AV outlet pressure [8, 9].
LHC measurementUnder the guidance of X-ray fluoroscopy, the cardiac catheter was inserted into the left ventricular cavity and/or the aorta through the peripheral artery to measure the pressure of the LVOT and the AV outlet.
CTA measurementThe main measurements were those for the annular area, diameter, and circumference, the diameter of the sinotubular junction, LVOT, ascending aorta, and the height of the left and right coronary arteries.
End pointsPrimary performance end pointProcedural success was defined as a successful approach, deployment, and device positioning, and the mean PGAV and EOA were measured by TTE using the continuity equation before discharge, then indexed against the body surface area to define PPM.
Primary clinical end pointThe primary clinical end point was the composite end point of all-cause mortality after the procedures and readmission for heart failure. Furthermore, the incidence of stroke and related complications (a new-onset permanent pacemaker implant and procedural and device-related complications) was evaluated.
Statistical analysisAll data were tested for normality and homogeneity of variance. Continuous variables were expressed as mean ± standard deviation or median and interquartile range (IQR). The result of the classified data was expressed as n (%). The Student t-test and the Mann-Whitney U test were used to compare continuous normally and non-normally distributed variables, respectively, using the χ2 test or the Fisher exact test when appropriate.
In the collinearity analysis, Pearson and Spearman correlation coefficients were calculated. The XGBoost algorithm was chosen as the machine learning (ML) technique of choice for PGAV prediction. Shapley additive explanations values were calculated as the latest measure from cooperative game theory [14] to quantify the contribution of input variables to model predictions [15]. Meanwhile, restricted cubic spline (RCS) analysis of EOAi was performed to obtain the corresponding average PGAV of moderate and severe PPM.
In order to distinguish patients based on prognosis, a cohesive hierarchical clustering algorithm (clustering independent of survival data) was applied. The variables used for clustering were selected by defining the following criteria: (1) Routine measurements of TTE and LHC after TAVR; (2) A well-represented mass of the first 5 dimensions of principal component analysis, defined by the cosine squared (cos2). After variable selection, Ward’s minimum variance method was applied to carry out coherent hierarchical clustering.
A simple model of survival after procedures based on the predicted increase in the mean PGAV level was established using the maximum selected logarithmic rank statistic. Survival rates were described using the Kaplan-Meier method, and the hazard ratio was estimated using the Cox proportional risk model.
Bilateral P < 0.05 was considered statistically significant. All statistical analyses were performed using SPSS software Version 26.0 (SPSS, Inc., Armonk, NY, USA) and Stata software Version 14.2 (Stata Corp., College Station, TX, USA).
ResultsBaseline and preprocedural imaging characteristicsIn the internal derivation cohort of 273 consecutive patients with AS with a small annulus, the average age was 73.0 (IQR: 67.0–79.0) years; 52.0% of patients were male; 90.8% of New York Heart Association (NYHA) functional class levels were ≥ III, the average Society of Thoracic surgeons score was 5.10 (IQR: 3.60–7.25) %; and the average n-terminal pro-b-type natriuretic peptide (NT-proBNP) level was 1749.0 (IQR: 1125.0–2368.0) pg/mL (Table 1). Notably, the average EOAi of the internal derivation cohort was 0.46 (IQR: 0.37–0.58) cm2/m2, and the average annular area was 345.5 (IQR: 325.0–367.5) cm2 (Table 2). In addition, there were no significant differences in demographic and preprocedural imaging characteristics between the external validation cohort and the internal derivation cohort (Supplemental Tables 1 and 2).
Table 1 Baseline characteristics of the internal derivation cohortTable 2 Preprocedural imaging assessments of the internal derivation cohortMean PGAV measurements of TTE and LHC. Linear regression analysis showed significant collinearity in the mean PGAV measured by TTE and LHC, with a Pearson correlation (R) coefficient of 0.98 (P < 0.001) (Fig. 1A). Importantly, the mean difference in PGAV assessed by TTE and LHC was 9.8 [95% confidence interval (CI): 4.5, 14.0] mmHg (Fig. 1B), with a median difference range of 11.3% (Fig. 1C). In addition, the mean PGAV measured by TTE was significantly higher than that measured by LHC [52.5 (IQR: 47.5–57.0) mmHg vs. 42.5 IQR: (38.0–46.0) mmHg, P < 0.001] (Fig. 1D).
Fig. 1
Transthoracic Echocardiography and Left Heart Catheterization Measurement of the Mean Pressure Gradient of The Aortic Valve. (A) Strong collinearity between TTE and LHC measurements (R = 0.98). (B) Mean difference: 9.8 mmHg (95% CI: 4.5, 14.0). (C) Median difference range: 11.3%. (D) TTE-measured PGAV significantly higher than LHC. (E) Inverse correlation between TTE-measured PGAV and EOAi (R = 0.93). (F) TTE-based cutoff values for moderate and severe PPM: 46.7 and 61.2 mmHg. EOAi: indexed effective orifice area; mPGLHC: mean pressure gradient measured by left heart catheterization; mPGTTE: mean pressure gradient measured by transthoracic echocardiography
Notably, there was a significant inverse correlation between the mean PGAV and EOAi measures by postprocedural TTE (R = 0.93, P < 0.001) (Fig. 1E). Therefore, according to the definition of the PPM critical value [13], RCS analysis was used to obtain corresponding mean PGAV cutoff values for moderate and severe PPM, respectively (mean PGAV for moderate PPM = 46.7 mmHg; mean PGAV for severe PPM = 61.2 mmHg) (Fig. 1F).
Improvement of mean PGAV by the XGBoost algorithmAfter obtaining results showing significant differences between the mean PGAV measured by TTE and LHC, the XGBoost algorithm was used to improve the mean PGAV obtained by TTE measurements. Input variables included the following: left ventricular ejection fraction (LVEF), left ventricular end systolic volume, peak velocity, left ventricular mass index, left atrial volume index, mean PGAV, EOAi, and STJ diameter. Notably, the mean PGAV predicted by measurement of the XGBoost algorithm had a significant positive correlation with the mean PGAV obtained by LHC (R = 0.94, P < 0.001) (Fig. 2A). The mean difference between the predicted and the LHC measured for the mean PGAV was − 0.12 [95%CI: −5.73, 4.97] mmHg (Fig. 2B). Importantly, the mean PGAV cutoff obtained using RCS analysis for the moderate PPM critical value was 36.8 mmHg, whereas the mean PGAV for the severe PPM critical value was 46.5 mmHg (Fig. 2C).
Fig. 2
Improvement of the Mean Pressure Gradient of the Aortic Valve by The Extreme Gradient Boosting (XGBoost) Algorithm. (A) Strong correlation between XGBoost-predicted and LHC-measured PGAV (R = 0.94). (B) Mean difference: −0.12 mmHg (95% CI: −5.73, 4.97). (C) XGBoost-based cutoff values for moderate and severe PPM: 36.8 and 46.5 mmHg
Clinical outcomes and prognosis evaluation after cohesive hierarchical cluster analysisIn the internal derivation cohort, 93.4% of patients achieved procedural success (Table 3), the estimated 2-year composite end point incidence range was 26.8% (95% CI: 23.7%–32.5%) (Fig. 3A), and 50% of deaths occurred within 8.3 months after TAVR (Fig. 3B). Importantly, the survival differences among patients were evaluated using the cohesive hierarchical clustering algorithm (Fig. 3C), and the number of 21 candidate variables was reduced to 5 final variables (mean PGAV, EOAi, LVEF, left ventricular end systolic volume, and left atrial volume index) for clustering (Fig. 3D). Cohesive hierarchical clustering analysis (Fig. 3C-D) divided patients into two clusters, with key differences and clinical outcomes as follows: Compared with Cluster II, Cluster I showed poorer cardiac function and worse prognosis. specifically, Cluster I had a higher proportion of severe cardiac function impairment (NYHA ≥ III class) and higher NT-proBNP levels, accompanied by more significant left ventricular systolic dysfunction and lower cardiac output/index (detailed data see Fig. 3E). Notably, although there was no significant difference in mean PGAV (measured by TTE or LHC) between the two clusters, the mean PGAV measured by LHC was consistently higher than that by TTE in both clusters (all P < 0.001, Fig. 3E). Clinically, Cluster I had a significantly higher incidence of 2-year composite end points than Cluster II (21.6% vs. 0%, P < 0.001, Fig. 3F).
Table 3 Procedural details and in-hospital clinical outcomes of the internal derivation cohortFig. 3
Cohesive Hierarchical Clustering Analysis and Clinical Outcomes Evaluation. (A) 2-year composite endpoint incidence: 26.8% (95% CI: 23.7–32.5%). (B) Time to 50% mortality: 8.3 months; censoring: 14.9 months. (C) PCA representation of candidate variables. (D) Heatmap and dendrogram of clustering results. (E) Comparison of PGAV between and within clusters. (F) Kaplan-Meier survival by cluster assignment. CI: confidence interval; Dim: dimension; LHC: left heart catheterization; LV: left ventricle; LVEDV: left ventricular end diastolic volume; LVEF: left ventricular ejection fraction; LVESV: left ventricular end systolic volume; LVOT: left ventricular outflow tract; TAVR: transcatheter aortic valve replacement; TTE: transthoracic echocardiography
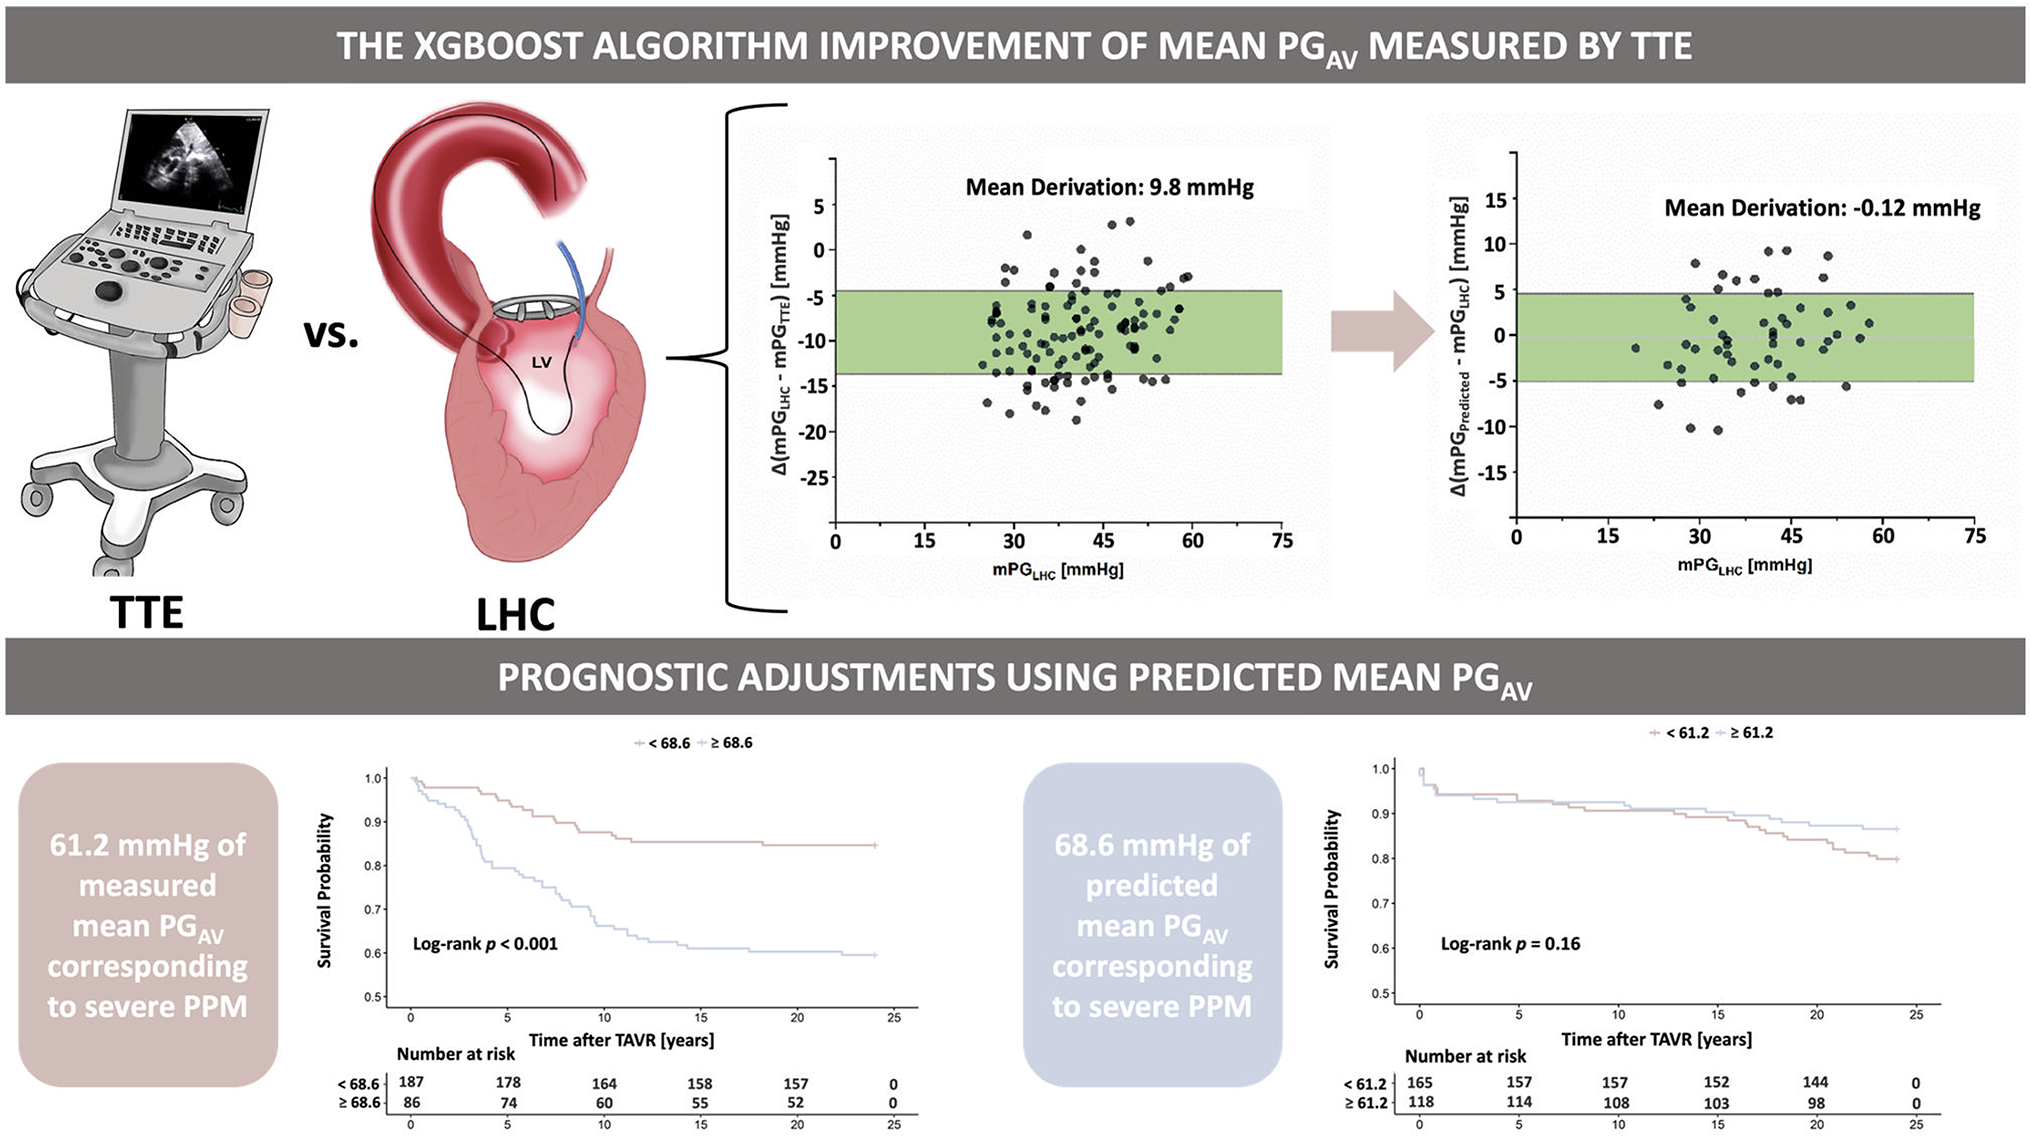
Of interest, to quantify the contribution of input variables to model predictions, Shapley additive explanations analysis was used to evaluate the highest global characteristic importance of mean PGAV predictions. Among them, the global characteristics of mean PGAV, EOAi, LVEF, left ventricular mass index, and left atrial volume index were the most significant (Fig. 4A). The survival model was established based on the predicted increase of the mean PGAV level using the maximum selected logarithmic rank statistic. According to the results of RCS analysis, the predicted mean PGAV of 68.6 mmHg was the cutoff value (Fig. 4B). The area under the curve of this prediction model was 0.630, confirming its availability and reliability (Fig. 4C). Compared with patients with a predicted mean PGAV < 68.6 mmHg, patients with a predicted mean PGAV ≥ 68.6 mmHg had a significantly higher incidence of 2-year composite end points (40.7% vs. 16.6%, P < 0.001) (Fig. 4D). Notably, a dichotomy of the mean PGAV cutoff value derived from the severe PPM cutoff for the TTE measured above could not significantly distinguish the 2-year composite end point incidence (Fig. 4E).
Fig. 4
The Survival Model After Transcatheter Aortic Valve Replacement Was Established Based on the Predicted Increase of the Mean PGAV Level Using the Maximum Selected Logarithmic Rank Statistic. (A) SHAP analysis of feature importance. (B) RCS-derived cutoff for predicted PGAV: 68.6 mmHg. (C) AUC of the prediction model: 0.630. (D) Kaplan-Meier survival by predicted PGAV (XGBoost) (E) Kaplan-Meier survival by TTE-measured PGAV. AUC: area under the curve; SHAP: Shapley additive explanations; STJ: sinotubular junction. Central illustration: Predicting mean PGAV based on TTE measurements adjusts evaluation of PPM in patients with AS who have a small annulus and updates prognostic resolution after TAVR
External validation performanceThe difference of survival in the external validation cohort was evaluated using the cohesive hierarchical clustering algorithm. Compared with cluster IV, cluster III had a higher proportion of patients who were NYHA functional class ≥ III (100.0% vs. 80.3%, P = 0.020) and a significantly higher proportion of those with NT-proBNP [2582.0 (IQR: 1444.0–3371.0) pg/mL vs. 1591.5 (IQR: 1001.0–1771.5) pg/mL, P < 0.001)] (Supplemental Table 1). Of interest, cluster III had a significantly higher proportion of patients with ≥ moderate mitral regurgitation (19.1% vs. 7.9%, P < 0.001) (Supplemental Table 2). Furthermore, 94.9% of patients in the external validation cohort achieved procedural success (Supplemental Table 3). Notably, there was a significant positive correlation between the mean PGAV predicted by XGBoost analysis and the mean PGAV obtained by LHC measurements (R = 0.87, P < 0.001) (Supplemental Fig. 1 A). The mean difference between predicted and LHC estimates for the mean PGAV was − 0.69 [95%CI: −2.63, 2.38] mmHg (Supplemental Fig. 1B). The mean PGAV of predictions for moderate and severe PPM critical values obtained using RCS analysis did not differ significantly from the internal derivation cohort (predicted mean PGAV for moderate PPM: 38.2 mmHg vs. 36.8 mmHg; predicted mean PGAV for severe PPM: 47.8 mmHg vs. 46.5 mmHg) (Supplemental Fig. 1 C). The maximum selected logarithmic rank statistic was applied to binary the external validation cohort based on the predicted mean PGAV, and a clinical outcome similar to that of the internal derivation cohort was achieved (26.9% vs. 6.0%, P < 0.001).
Comments (0)