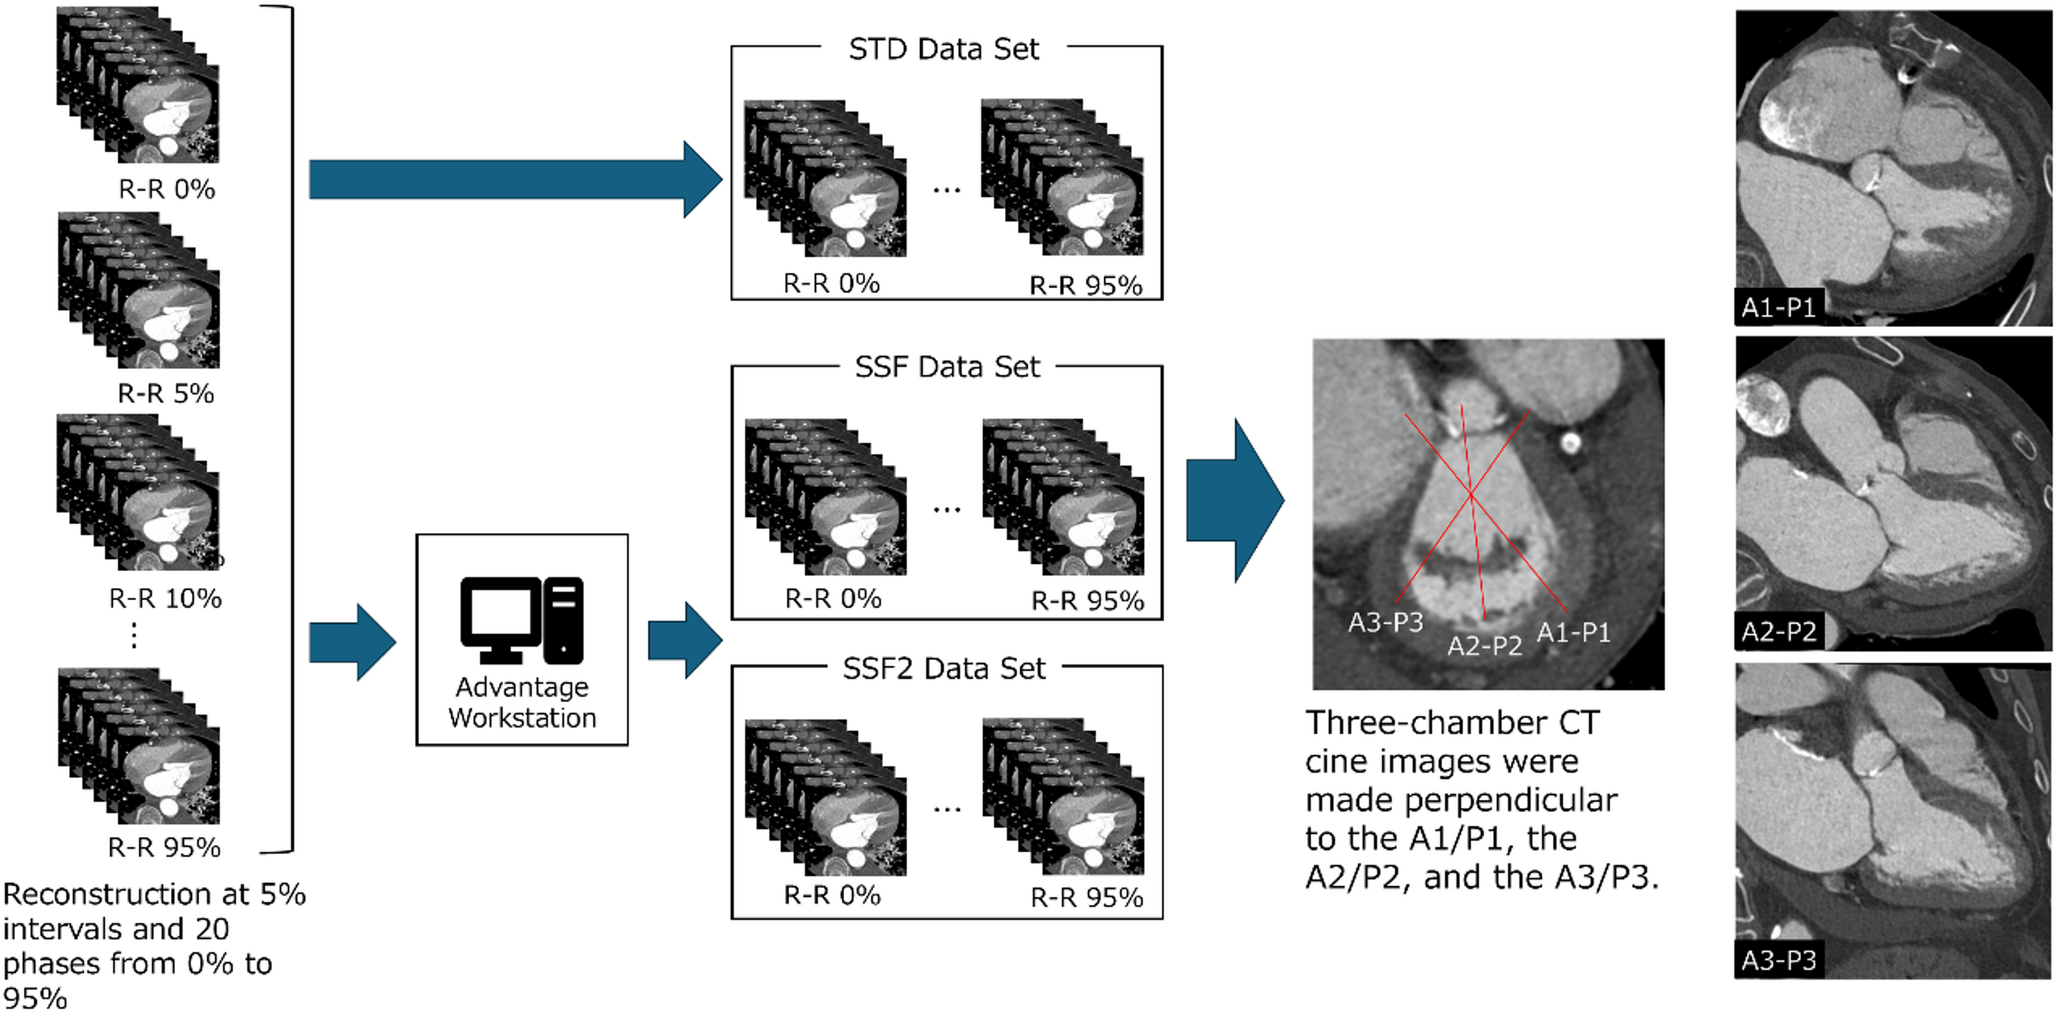
Subjective image quality scores for all 20 cardiac phases for the A2/P2
In both A2 and P2 images, the average image quality score across all 20 cardiac cycles of the SSF2 technique was significantly higher than those of the STD and SSF techniques. With the exception of the 20% R-R-phase P2 images, the SSF2 scores were significantly higher than those of STD and SSF in the systolic phase from the five to 40% R-R intervals. These results highlight the utility of SSF2 in the systolic phase, which is important for the diagnosis of mitral regurgitation. As with the first-generation algorithm, SSF2 uses information from adjacent cardiac phases available from a single rotation to characterize motion at the prescribed target phase. In a fully automated manner, SSF2 searches each region of the image volume for a local motion path that is consistent with the subset of measurement data that passes through that portion of the image volume [14]. Each image volume in the series is then spatially deformed by the motion field, which maps the motion state from the respective time to the central reference time given by the prescribed cardiac phase. Motion correction of the second-generation technology extends beyond the coronary vessels to the entire heart [14]. In this study, the diastolic phase of the ventricle is the period of the cardiac cycle from the closure of the aortic valve to the closure of the mitral valve during which the ventricle is filled with blood, and SSF2 reconstruction did not improve mitral valve image quality during this time. Diastole comprises four sequential components‒ isovolumic relaxation, early rapid filling, diastasis, and atrial systole (late filling). During the isovolumic relaxation phase, relaxation and lowering of internal pressure of the left ventricle coincide with closure of both the aortic and mitral valves, creating a pressure gradient in which left atrial pressure exceeds left ventricular pressure. Early rapid filling then occurs as blood passively flows from the left atrium to the left ventricle utilizing this pressure gradient. Diastasis (cardiac quiescence) follows as the influx of blood raises left pressure, momentarily pausing flow and equalizing the left ventricular and left atrial pressure, and as the remaining blood is actively propelled into the left ventricle during atrial systole (late filling), diastole is completed. Blood flows from the left atrium to the left ventricle during the nonsequential periods of early rapid and late filling [15], so SSF2 may have been unable to perform motion correction during diastole, when the mitral valve exhibits complex motion, because the algorithm uses images of adjacent cardiac phases to correct for motion in the target cardiac phase.
Table 2 shows lower image quality scores for the posterior leaflet than the anterior leaflet in each reconstruction, presumably attributable to the shorter length of the posterior than anterior leaflet and its close proximity to the left ventricular wall during diastole, which may have hindered its clear recognition.
Subjective image quality scores of the systolic-phase images
The mean score of image quality for all systolic leaflets (A1-P3), which are important for the diagnosis of mitral regurgitation, was significantly higher in SSF2 (3.46 ± 0.61) than in STD (3.03 ± 0.86) and SSF (3.00 ± 0.85). For individual valve cusps (A1, A2, A3, P1, P2, and P3), image quality did not differ significantly between the SSF and STD reconstructions but was consistently significantly higher for SSF2 than both STD and SSF. Because the first-generation algorithm (SSF) only corrects coronary artery motion [9], the mitral valve image score probably did not improve. However, the second-generation algorithm (SSF2) corrects motion in other structures in the heart in addition to the coronary arteries, so its use likely improved the quality of mitral valve images [9] and therefore assessment of mitral valve regurgitation.
In the SSF group, scores of only 1.8% of cases increased by one or more, whereas in the SSF2 group, scores of 38.7% of cases improved, suggesting that SSF2 reconstruction positively affects mitral valve image quality. Even in the SSF2 group, scores of 61.3% of cases showed no improvement. However, among the SSF2 cases with score increase below one, 94.8% had a pre-motion-correction score (STD) of three or four, indicating an already high initial score.
Sixteen of our 47 cases (34%) demonstrated atrial fibrillation. Though coronary computed tomography angiography (CCTA) represents a more technically challenging application of cardiac CT for the assessment of coronary arteries in patients with AF, other investigators have reported the utility of CT scanners with whole-heart coverage in acquiring high-quality CCTA images while reducing radiation exposure [16, 17]. In our study as well, use of CT scanners with whole-heart coverage produced equivalent or better image quality of the mitral valve in atrial fibrillation than that in sinus rhythm, even without motion correction. Pulsed Doppler echocardiography shows distinct E (early rapid filling velocity) and A (late diastolic filling velocity, specifically reflecting left atrial contraction) waves, representing early and atrial filling of the left ventricle (LV) via the mitral valve (MV) [15]. In AF, the A-wave is particularly absent. Consequently, without motion correction, i.e., in STD, higher AF than SR scores may have resulted from the reduced valve motion associated with the loss of atrial transport (atrial kick) characteristic of AF. Notably, the absence of significant difference between the AF and SR scores in the SSF2 group suggests a potential benefit of the SSF2 motion-correction algorithm.
None of the three reconstructions, STD, SSF, or SSF2, showed significant correlation between heart rate and score during imaging, suggesting the possibility of equivalent image quality in cases of low and high heart rate. Conversely, in the case of low heart rate, the long time between each phase in the 20-phase reconstruction might prohibit capture of the optimal cardiac phase.
Scanning protocol and analysis
Our standard coronary CTA protocol uses a contrast agent injection rate of 22 mgI/kg/sec. However, in cases of mitral regurgitation, many patients have left atrial enlargement, so we increased the injection rate to 28 mgI/kg/sec. Because it is difficult to obtain cross-sections perpendicular to the anterior and posterior leaflets at the A1/P1 and A3/P3 during diastole, we evaluated only the systolic phase, which contributes to diagnosis.
ECG-gated CT prior to TAVI has been reported to enable the evaluation of both the aortic valve and coronary arteries with reconstruction at 20 to 30% of the R-R interval [9]. The diagnosis of mitral regurgitation requires images obtained during the left ventricular systole, when the mitral valve is closed, and among left ventricular systolic phases ranging from 15 to 40% of the R-R interval, we observed no significant difference in heart rate during the scan among the best systolic phases of the images. So, modulating contrast dose at five to 40% of the R-R interval may reduce radiation exposure. However, comprehensive evaluation is essential prior to mitral valve plasty, percutaneous mitral annuloplasty, and edge-to-edge mitral valve repair for mitral regurgitation. Beyond CT assessment of leaflet morphology for prolapse or billowing, accurate characterization of the coronary arteries, mitral annulus, left ventricular geometry, including the chordae tendineae and papillary muscles, and the subvalvular apparatus is mandatory [5, 18, 19]. As well, evaluating deformation of the mitral annulus is crucial for procedures aimed at restoring MV geometry. Thus, both the left ventricular diastolic and systolic phases are considered to play important roles. In addition, the many cases of atrial fibrillation make it difficult to predict the heart rate at the time of imaging, thereby requiring the acquisition of images in both the diastolic and systolic phases. In CT for preoperative evaluation of mitral regurgitation, the implementation of dose modulation to reduce radiation exposure will very likely remain difficult in the future. To cope with sudden heart rate fluctuations, we also set the R-R intervals to 120% or more and performed imaging of the left heart and coronary arteries.
Limitations
Our retrospective study was limited because we included only 47 patients with mitral regurgitation, which did not provide sufficient data to allow evaluation of the impact of this reconstruction method on the differential diagnosis of functional or degenerative disease. In addition, we divided the R-R interval of the electrocardiogram into 20 parts and evaluated the quality of mitral valve images, but we may have failed to capture the optimal cardiac phase in cases of low heart rate.
Furthermore, though comprehensive evaluation of visibility requires objective quantitative analyses, specifically the use of CT value profiling for leaflet thickness and direct measurement of leaflet length, significant technical and inherent limitations in the acquired data restricted our study to the subjective, qualitative assessment of mitral valve leaflet visualization by two radiologists.
The limitations of CT profile curve analysis of the mitral valve are primarily attributable to motion artifacts and the inherent thinness of the leaflets. Because CT values are represented on a per-pixel basis, the attenuation values of the thin leaflets are highly susceptible to image noise and partial volume effect. Consequently, the CT value at the nadir of the leaflet, which exhibits lower attenuation than the intracardiac lumen, increases, thus reducing the accuracy of FWHM measurements or rendering those measurements impossible by preventing detection of the leaflet. FWHM measurement is further challenged by the method of image reconstruction. The inherent requirement of techniques such as SSF and SSF2 to utilize cardiac phases preceding and subsequent to the target phase prohibits the perfect coregistration of coordinate axes of the three distinct image datasets produced by differing reconstruction methods. This lack of precise alignment makes it difficult to measure FWHM at the exact same anatomical location across all reconstructed images.
Objective measurement of leaflet length was difficult because motion blur prevented clear depiction of the leaflets, and indistinct delineation hindered the accurate determination of their boundaries. As well, overlap of the anterior and posterior leaflets during coaptation prevents measurement to the true tip of the leaflet.
Because this study is exploratory in nature, we did not perform corrections for multiple comparisons, so our findings should be interpreted with caution and used primarily for hypothesis generation for future confirmatory studies.

Comments (0)