Published dataset collection
To develop and validate a gut microbiome-based ML model for early CRC and adenoma screening, publicly available stool microbiome datasets containing 16 S rRNA sequencing data from CRC, non-advanced adenomas, AA, and healthy control subjects diagnosed via colonoscopy were collected. A total of five publicly available 16 S rRNA sequencing datasets (Baxter, Dadkhah, Zackular, Yang, and Cong) [25,26,27,28,29], primarily from the USA and Canada, were included and analyzed to minimize geographical bias (Supplementary Table 1).
Three datasets (Baxter, Dadkhah, Zackular) served as primary discovery/validation cohorts for feature selection, RF classifier training, and MRS development. Specifically, the Baxter and Dadkhah datasets were used for RF training and internal 10-fold cross-validation, whereas the Zackular dataset was used exclusively for independent external validation to assess model generalizability.
Two Chinese cohorts (Yang and Cong) were used solely for cross-regional validation of the binary MRS model. While both datasets included adenoma cases, the Yang dataset only provided processed ASV tables without raw sequencing data, preventing standardized reprocessing. This role separation ensured transparency in dataset usage, avoided information leakage between training and testing phases, and enabled the assessment of cross-population transferability.
Participants were included if they had undergone colonoscopy with a confirmed diagnosis of CRC, AA, non-advanced adenoma, or healthy control status, and had available stool 16 S rRNA sequencing data with associated metadata. Exclusion criteria were: prior history of CRC or other gastrointestinal malignancies; inflammatory bowel disease; antibiotic, probiotic, or prebiotic use within three months prior to sample collection; incomplete metadata; and sequencing runs with insufficient read depth (< 10,000 reads after quality control). For all publicly available datasets, these criteria were applied to the extent possible based on the metadata provided. Detailed cohort-specific inclusion/exclusion criteria were not uniformly available from the original studies, and any additional restrictions beyond the core criteria followed those described in the corresponding primary publications.
Data and metadata were obtained from the National Center for Biotechnology Information (NCBI) Sequence Read Archive (SRA) database, and incomplete samples were excluded. The Baxter [26] and Dadkhah [28] datasets were used to train RF classifiers, while Zackular dataset [25] was employed for external validation to assess model generalizability. The MRS model was constructed using the Baxter dataset and validated using the Zackular dataset to reduce technical variability.
The Zackular dataset [25] included 90 participants (30 CRC, 30 non-advanced adenoma, 30 controls) recruited in the United States. The mean age (± SD) was 55.3 ± 9.2, 61.3 ± 11.1, and 59.4 ± 11.0 years for the healthy, non-advanced adenoma, and CRC groups, respectively. Across groups, 37–70% were men, and the majority were non-Hispanic White (70–93%). Mean BMI ranged from 26.6 to 30.7 kg/m². Cancer stage information was not reported.
Across the three primary datasets used for model development (Supplementary Table 2), the total sample size was 1,181, comprising 454 controls, 373 non-advanced adenomas, 197 advanced adenomas, and 157 CRC cases. The Baxter and Dadkhah datasets contained more controls than CRC cases, whereas Zackular had balanced class sizes. The Yang dataset was balanced (50 CRC, 50 controls), while Cong was slightly imbalanced (10 CRC, 11 controls). Post-hoc power analysis was performed based on the observed effect sizes in alpha diversity and microbial feature abundance between CRC and non-CRC groups. Using G*Power 3.1 and the primary dataset sample sizes (non-CRC n = 1,024; CRC n = 157), we determined that, under the assumption of a moderate effect size (Cohen’s d = 0.4) and α = 0.05, the study achieved 99.66% power, which is well above the conventional 80% threshold. This is well above the conventional 80% threshold, supporting that our analyses and model development were adequately powered to detect moderate group differences.
Data preprocessing
Raw 16 S rRNA sequencing data were processed using the Easy Microbiome Analysis Platform (EasyMAP) [30], incorporating the QIIME2 pipeline [31]. Sequencing reads were demultiplexed, trimmed, merged, and denoised using DADA2 to generate high-quality amplicon sequence variants (ASVs). Taxonomic classification of ASVs was performed with pre-trained classifiers based on the SILVA reference database. As the discovery and validation datasets targeted different 16 S rRNA hypervariable regions (V1–V3, V3–V4, or V4), region-specific classifiers were trained and evaluated separately to minimize primer-driven compositional bias. Feature selection was also performed within each region so that only taxa consistently detected with the corresponding primer set were included in model construction.
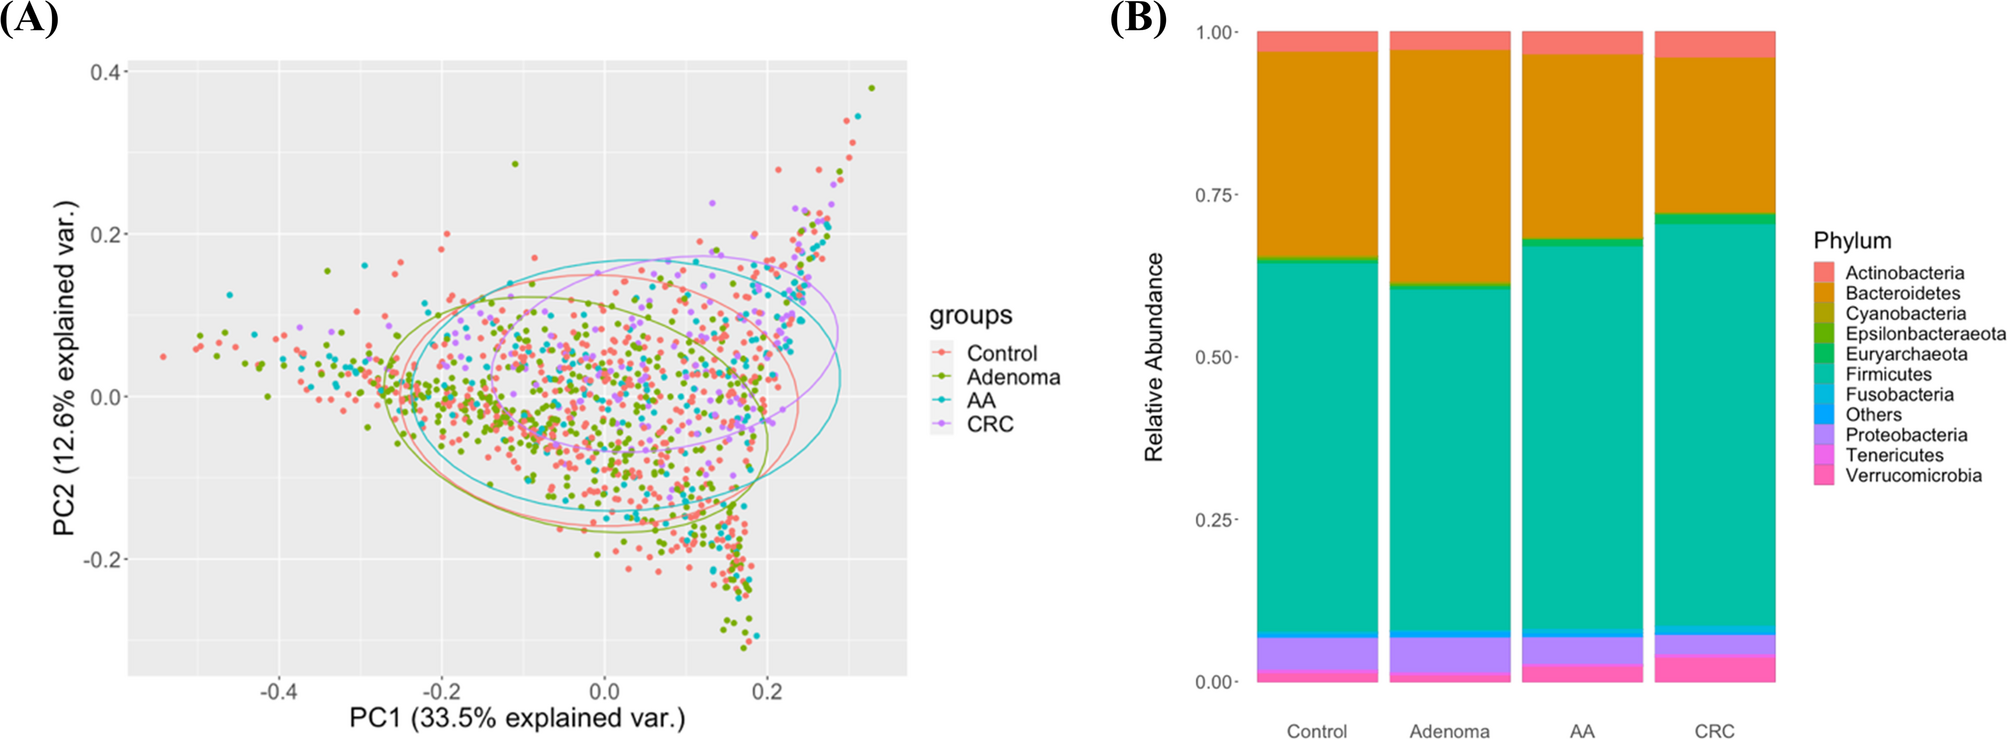
ASV tables were normalized by total-sum scaling (TSS), and binary appearance data were created by converting ASV presence to 1 (present) or 0 (absent). The appearance ratio was calculated as the percentage of samples in which an ASV was observed within each group. Microbial community composition and inter-group variation were visualized using the phyloseq R package (v1.42.0) within the Bioconductor (v3.17), including phylum-level bar plots and principal component analysis (PCA).
Due to limited AA representation in some datasets—particularly the complete absence of AA cases in certain validation cohorts (e.g., Zackular)—the AA group was combined with the non-advanced adenoma group for feature selection, model development, and MRS calculation. This strategy ensured sufficient statistical power and is biologically justified, as both AA and non-advanced lie along the adenoma–carcinoma sequence and already exhibit detectable dysbiotic shifts at the early-lesion stage. Adenoma-associated microbial markers have been shown to be reproducible across cohorts, and classifier panels trained on mixed adenomas populations perform comparably in distinguishing both advanced and non-advanced lesions [25, 32,33,34]. Similar grouping approaches have been widely adopted in large-scale cancer microbiome studies to enhance statistical robustness while maintaining biological plausibility.
Taxa present in fewer than 5% of samples were removed prior to analysis to reduce sparsity-driven artifacts, and samples with low read depth were excluded from downstream analyses. Missing metadata were handled by excluding incomplete samples, and no imputation was applied to taxonomic abundances.
Differential abundance analysis and feature selection
To enhance model performance and reduce dimensionality, differential abundance analysis (DAA) was performed to identify CRC-associated microbial features. ANCOM-BC (Bioconductor v3.17, v2.0.3) [35] was used, which applies the Benjamini–Hochberg method to adjust for multiple comparisons. All p-values from differential abundance testing were adjusted using the Benjamini–Hochberg method to control the false discovery rate (FDR), with FDR < 0.05 considered statistically significant. Given the relatively large number of taxa tested (n = 109), we also applied a stricter preliminary filter of raw p < 0.01 in both ANCOM-BC and chi-square tests to further ensure robustness and reduce the likelihood of spurious associations. This process yielded 109 candidate biomarkers, which were subsequently used for the development of the RF classifier and MRS model (Supplementary Fig. 1).
ML model development and validation
Two complementary models were developed: a classification model using RF classifiers and a risk stratification model using the MRS. RF models were constructed using scikit-learn (v1.2.2), leveraging ensemble decision trees to reduce overfitting. A nested, stratified 10-fold cross-validation (CV) framework was used, in which the inner loop performed feature selection, MRS threshold determination, and hyperparameter tuning, and the outer loop provided unbiased performance estimates from held-out folds. Participants were split at the subject level, with class proportions preserved and a fixed random seed to ensure reproducibility. Hyperparameters were optimized via grid search over the number of trees, maximum tree depth, minimum samples per split, feature subset size, and class weight settings. All preprocessing—including differential abundance filtering, normalization, and threshold determination—was performed exclusively on training folds and then applied unchanged to the corresponding test fold to prevent information leakage.
To assess robustness to parameter choices, we conducted a sensitivity analysis by systematically varying key hyperparameters. Across the tested configurations, out-of-fold AUC, sensitivity, and specificity showed only minimal variation, indicating that the RF classifier is stable across a broad range of hyperparameter settings. For datasets lacking an external validation cohort, stratified 10-fold CV was used with the same anti-leakage protocol. In external validation, no resampling or balancing was applied to reflect the real-world prevalence of CRC, adenoma, and controls. Model performance metrics included accuracy, area under the receiver operating characteristic curve (AUC), sensitivity, specificity, calibration (Brier score and slope), and external validation performance. Features selected via ANCOM-BC and chi-square tests were used as model inputs, and class weights were adjusted during training to further compensate for imbalance. External validation was conducted using the independent Zackular dataset. For all metrics derived from 10-fold cross-validation, 95% confidence intervals (CIs) were calculated from fold-wise results using the formula: mean ± 1.96 × (SD/√n), where n = 10. This approach provides a transparent quantification of variability and facilitates clearer interpretation of model robustness.
MRS calculation
The MRS is conceptually analogous to the PRS, which combines multiple genome-wide significant variants into a single quantitative measure of genetic risk. Similarly, the MRS condenses information from a disease-associated microbial sub-community into one interpretable score, capturing the collective characteristics of relevant taxa rather than focusing on individual features [24]. This approach leverages within-sample alpha diversity to reflect the complexity of microbe–microbe and microbe–host interactions, providing a more holistic representation of microbiome-related risk.
In our two-stage framework, candidate ASVs were first identified in the discovery cohort through differential abundance analysis (ANCOM-BC, ALDEx2 [36], MaAsLin2 [37]; FDR < 0.05). We then applied a pruning-and-thresholding (P + T) procedure to select an optimal sub-community: for each p-value cut-off, we calculate Shannon, Simpson, and observed-ASV indices and construct corresponding MRS models. Model definition was determined within a nested CV framework, where an inner loop selected the optimal P + T threshold and alpha-diversity index, and an outer 10-fold CV generated unbiased out-of-fold predictions. All preprocessing and index computation steps were performed only within training folds and applied unchanged to test folds. Receiver-operating characteristic (ROC) curves were generated using cross-validated predictions within the discovery cohort, and the threshold yielding the highest cross-validated AUC was selected. In the validation phase, this threshold was applied unchanged to the independent validation cohort to avoid information leakage. The final MRS was recalculated in both cohorts, and group differences were assessed using unpaired two-tailed Student’s t-tests. This design integrates multiple microbial features into a single robust score while minimizing selection bias and ensuring transferability across populations.


Comments (0)