
Remember me
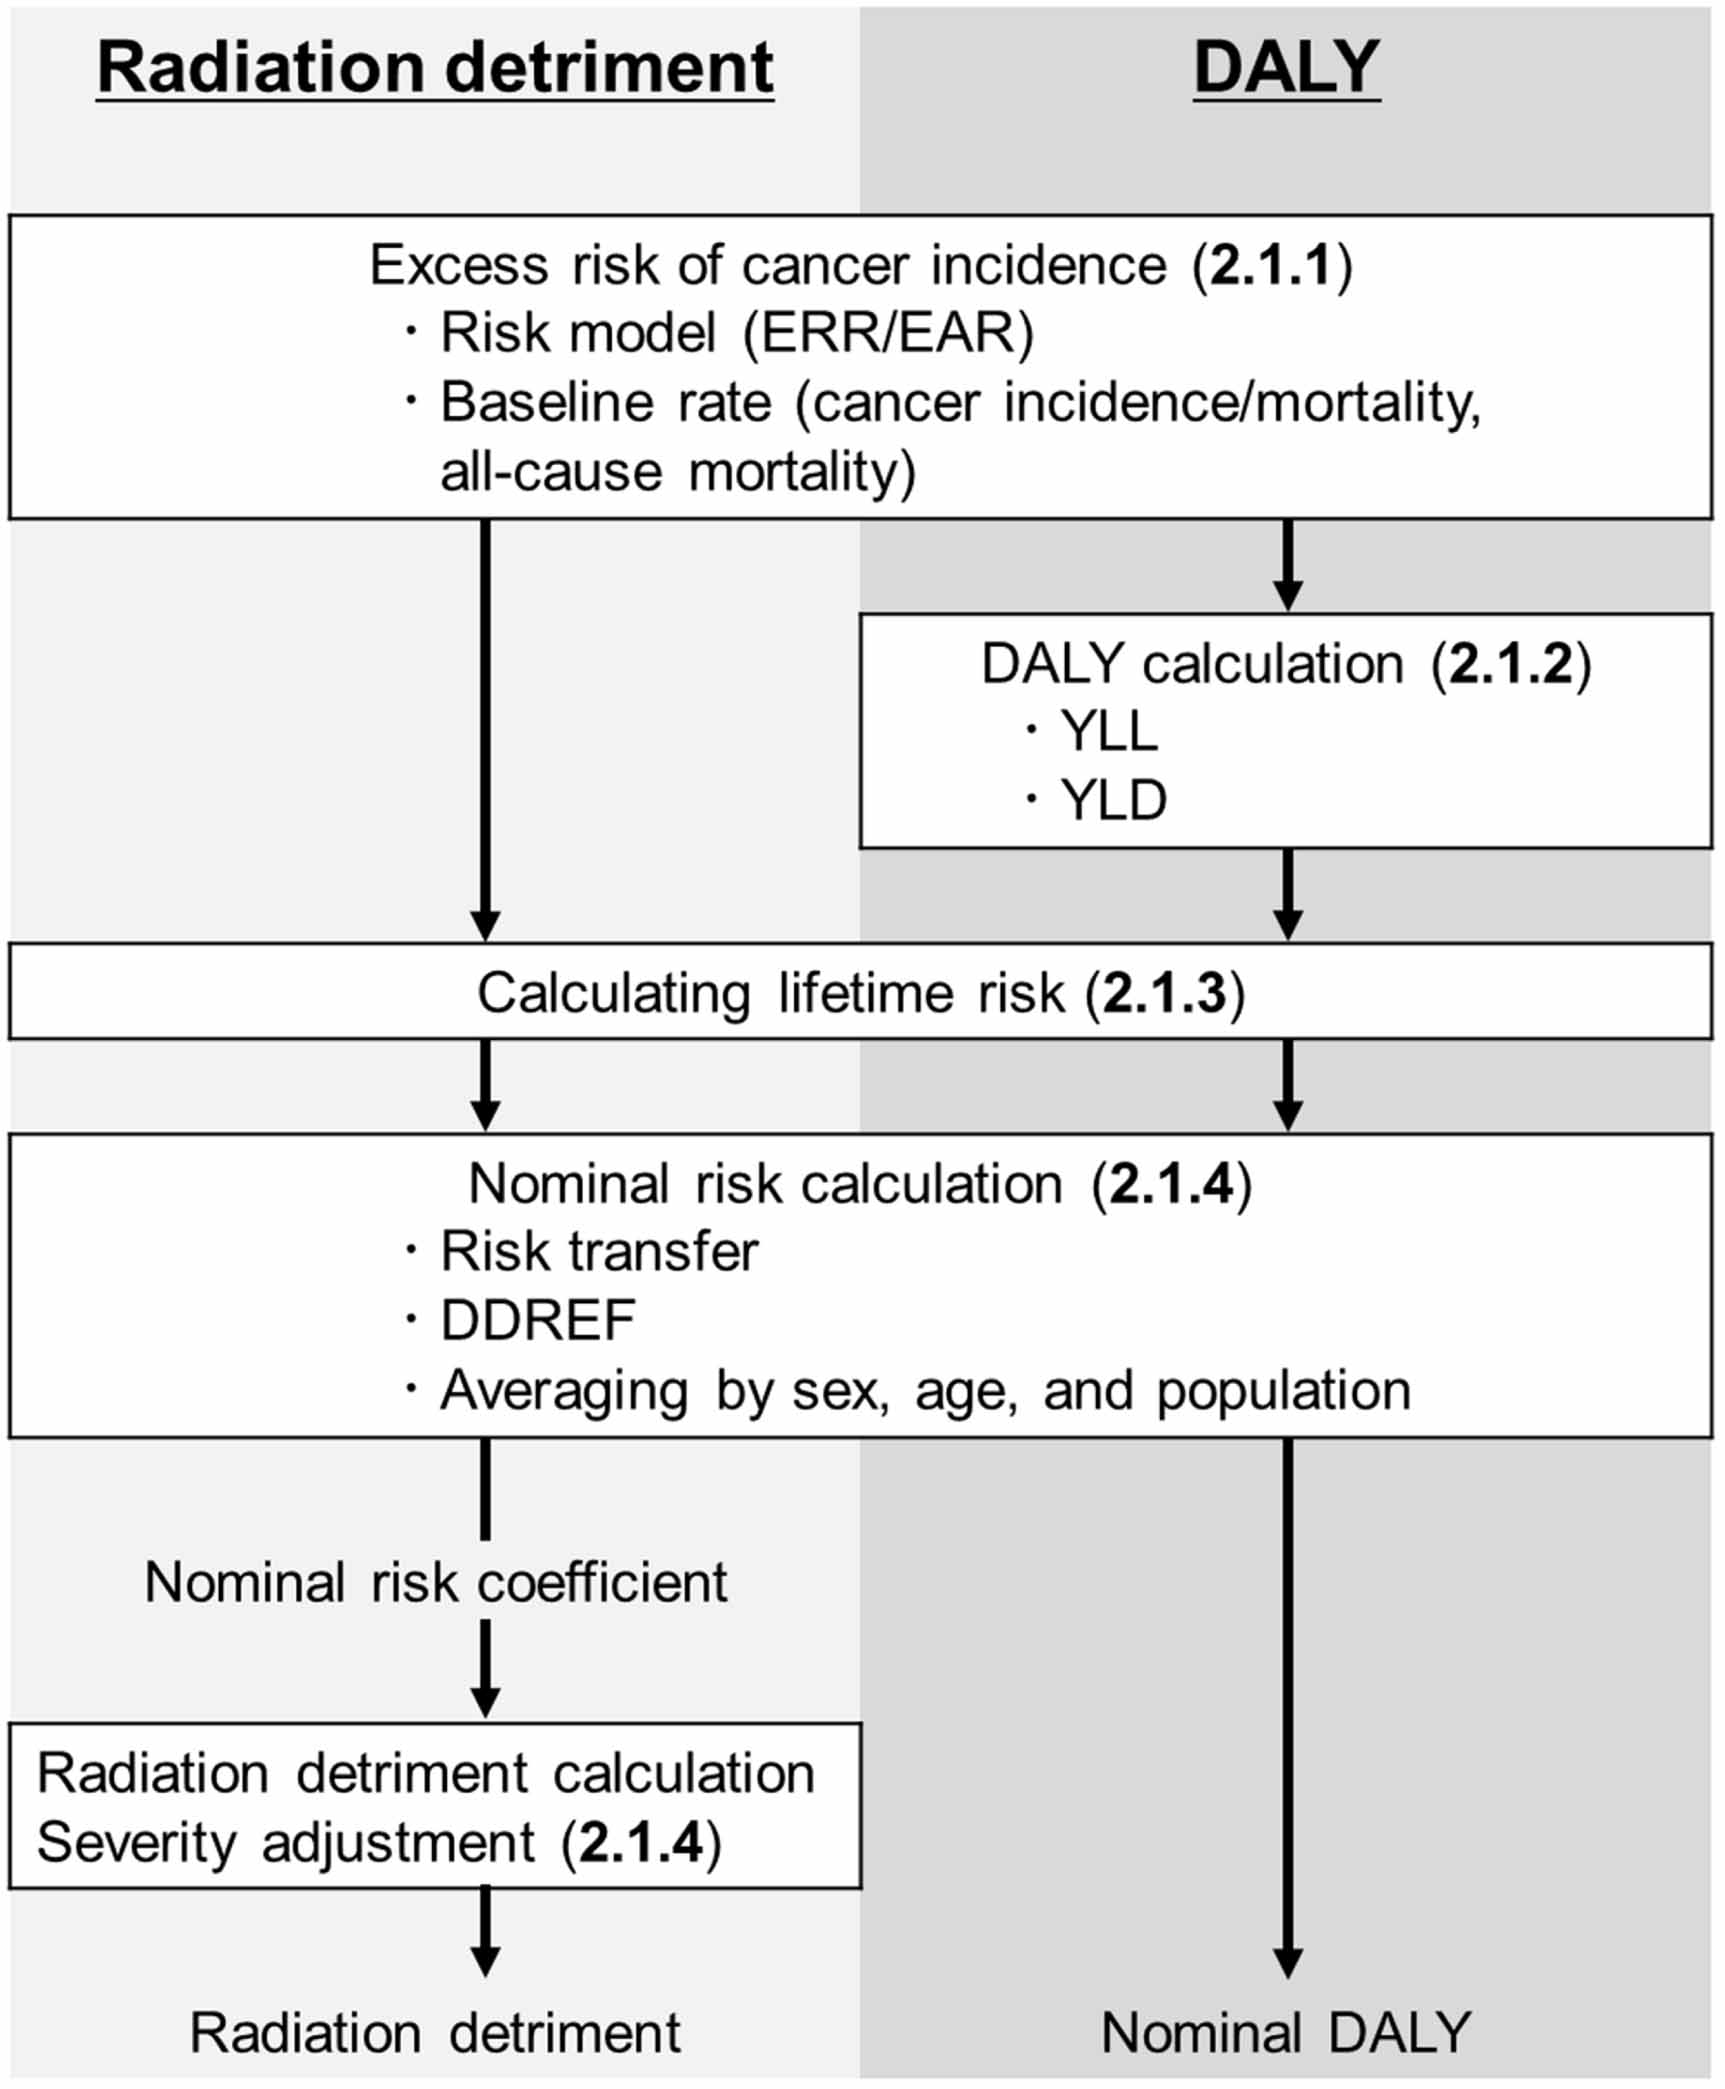
The calculations in this study were based on data related to composite populations, such as cancer incidence rates, cancer mortality rates, all-cause mortality rates, and population size, as provided by the ICRP [1, 4]. Data related to composite populations by age were obtained using cubic spline interpolation because these values were provided by 5 year age categories. Excess cancer incidence risk and DALYs associated with excess cancer were based on a common calculation method for excess cancer incidence (figure 1). An exposure dose of 0.1 Gy was used in the calculation for a single exposure situation because the radiation detriment was based on the risk calculated for 0.1 Gy.
Figure 1. Calculation of radiation detriment and cancer DALYs developed in this study.
Download figure:
Standard image High-resolution image 2.1.1. Excess cancer incidence risk modelsThe excess relative risk (ERR) and excess absolute risk (EAR) models were used as excess cancer risk models. Excess risks for all solid cancers (hereinafter, all solid) were calculated using models with effect modification of age-at-exposure and attained age (equation (1)). The model parameters used in this study were given by sex based on the ICRP estimation [4] (table S1). The EAR model, presented in ICRP Publication 152, was used for breast cancer. For leukaemia, an EAR model based on a linear-quadratic model was used, and the ERR model was provided as the ratio of excess cancer incidence following the EAR model to the baseline following the model shown in ICRP Publication 152 [4]. Details of the calculations for breast cancer and leukaemia are provided in supplementary information 1,

 : age-at-exposure
 : attained age
 : exposure dose
 ,
,  ,
,  : parameters.
Excess cancer incidence risks by cancer site,  , were calculated using the ERR or EAR model and cancer-free survival, which was the conditional probability of surviving without cancer for those who were alive without developing any cancer (equation (2)),

 : excess incidence risk by cancer site at attained age a exposed to dose d at age e based on the ERR model.
 : excess incidence risk per 10 000 persons by cancer site at attained age a exposed to dose d at age e based on the EAR model.
 : cancer-free survival at age
  when exposed to dose
  at age
  .
.
 : incidence rate by cancer site at attained age
  .
.
Cancer-free survival,  , was calculated using equations (3) and (4) considering the mortality rate, except for cancers, and the incidence rate,

 : rate of developing cancers or death by all causes except for cancers at age
  exposed to dose
  at age
  .
.
 : all-cause baseline mortality rate at age
  .
.
 : baseline mortality rate of all solids at age
  .
.
 : baseline mortality rate of leukaemia at age
  .
.
 : baseline incidence rate of all solids at age
  .
.
 : baseline incidence rate of leukaemia at age
  .
.
 : excess incidence rate of all solids at age
  exposed to dose
  at age
  .
.
 : excess incidence rate of leukaemia at age
  exposed to dose
  at age
  .
.
For the calculation of cancer-free survival, the rate of developing cancers or death by all causes except for cancer,  , was computed using the sum of excess incidence rates of each cancer site in ICRP Publication 152. However, in this study, the sum of the excess incidence rates of all solid and leukaemia was used instead of the sum of those of each cancer site (equation (4)) because data related to all cancer sites were not provided. Excess cancer incidence rates by cancer site,
  , were calculated based on the ERR or EAR model (equation (5)),

 : excess incidence rate by cancer site at age
  exposed to dose
  at age
  .
.
 : incidence rate by cancer site at age
  .
.
The burden of cancer for 10 years until occurrence was calculated because survivors beyond 10 years were considered cured in the GBD study estimation [7]. The calculation of YLDs was based on four phases: diagnosis/treatment phase (phase 1), remission phase (phase 2), disseminated/metastatic phase (phase 3), and terminal phase (phase 4). To evaluate cancer DALYs attributable to radiation exposure, calculation methods were developed based on a previous study [9]. In this study, YLDs of the diagnosis/treatment and remission phases were calculated in relation to the incidence of radiation-induced excess cancer, and YLDs of the disseminated/metastatic and terminal phases were calculated in relation to the number of mortalities. In other words, those who developed cancer experienced diagnosis/treatment and remission phases, while those who died of cancer experienced disseminated/metastatic and terminal phases (equation (6)). Disabilities for cancer-specific procedure sequelae, e.g., mastectomy, were considered for some cancer sites in the GBD study [7]; however, cancer YLDs in this study did not include procedure-related disabilities for simplification of the calculation. Cancer YLLs were calculated based on the number of mortalities and life expectancy (equation (7)),

 : YLLs of radiation-induced excess cancer at age
  exposed to dose
  at age
  .
.
 : life expectancy at age
  .
.
 : survival rate by cancer site at age
  .
.
 : YLDs of radiation-induced excess cancer at age
  exposed to dose
  at age
  .
.
 : disability weight for phase
  .
.
 : duration of phase
  by cancer site.
The  and
and  values were based on a previous GBD study [12] (tables S2 and S3). Life expectancy was calculated using equation (8),

 : survival rate at age
  .
.
The survival rate of the cancer sites,  , was calculated using equation (9) because the subtraction of the ratio of mortality rate to incidence rate by cancer site from one was used as the site-specific 5 year survival rate [7, 13],

 : mortality rate by cancer site at attained age
  .
.
When the mortality rate,  , was higher than the incidence rate,
  , the value of
  was equal to 0. The values by 5 year age categories were applied to the mortality and incidence rates in equation (9). DALYs for thyroid cancer were not calculated in this study because the mortality rate data for thyroid cancer were not provided by the ICRP.
Regarding lifetime risks, the risk of exposure-induced cancer incidence (REIC) and the sum of the YLLs or YLDs were calculated (equations (10)–(12)). The lifetime DALYs were the sum of the lifetime YLLs and YLDs (equation (13)),

 : maximum attained age
 : lag.
In this study, the maximum attained age was set at 94 years, and the lag for all solids and leukaemia was set at 5 years (4).
2.1.4. Calculation of nominal risk coefficient and radiation detrimentTo transfer risk estimates across populations, the REIC and lifetime DALYs based on the EAR or ERR models were averaged using the weighted values shown in table S4. The dose and dose rate effectiveness factor was set to 2 and applied to all solid cancer sites. The nominal risk coefficients and nominal DALYs were averaged with age, population, and sex based on the REIC and lifetime DALYs resulting from 0 to 89 years of age-at-exposure. Radiation detriments by cancer site were calculated from the nominal risk coefficients adjusted for the lethality fraction, quality of life, and relative cancer-free life lost using equation (14). The adjustment parameters were obtained from ICRP Publication 103 [1] (table S5),

 : radiation detriment
 : nominal risk coefficient
 : lethality fraction
 : weight of quality of life
 : relative cancer-free life lost.
To understand the impact of the averaging process on nominal DALYs, nominal DALYs were calculated using altered calculation conditions considered in previous studies [4, 14]. Nominal DALYs with altered conditions were calculated based on the Asian or Euro-American population, male or female, ERR or EAR model, and 0–14 years or 18–64 years of age-at-exposure to examine the impact of population, sex, model, and age-at-exposure. The impact was evaluated using the ratio of DALYs under altered conditions to those under default conditions. The nominal risk coefficient was calculated under the same conditions as in the examination of the nominal DALYs. The impact on the nominal risk coefficients was the same as that on radiation detriment because the four calculation conditions considered in this study affected the value of the nominal risk coefficient and did not affect the severity adjustment (figure 1).
Prolonged exposure was defined as the repetition of annual exposure. To reflect this assumption, the excess incidence risk by cancer site at attained age  exposed to dose
  based on the ERR or EAR model was calculated using equations (15) and (16),
 : start age at exposure
 : end age at exposure.
The lifetime DALYs and density of DALYs attributable to prolonged radiation exposure were calculated using equations (15) and (16) to the calculation in 2.1.1–2.1.4. This risk calculation was shown as the ‘unconditional death probability rate’ in ICRP Publication 60 [11]. Excess cancer DALYs attributable to prolonged exposure to 20 mSv per year for working-age (47 years, age from 18 to 64 years) were also calculated in this study.
Comments (0)