
Remember me
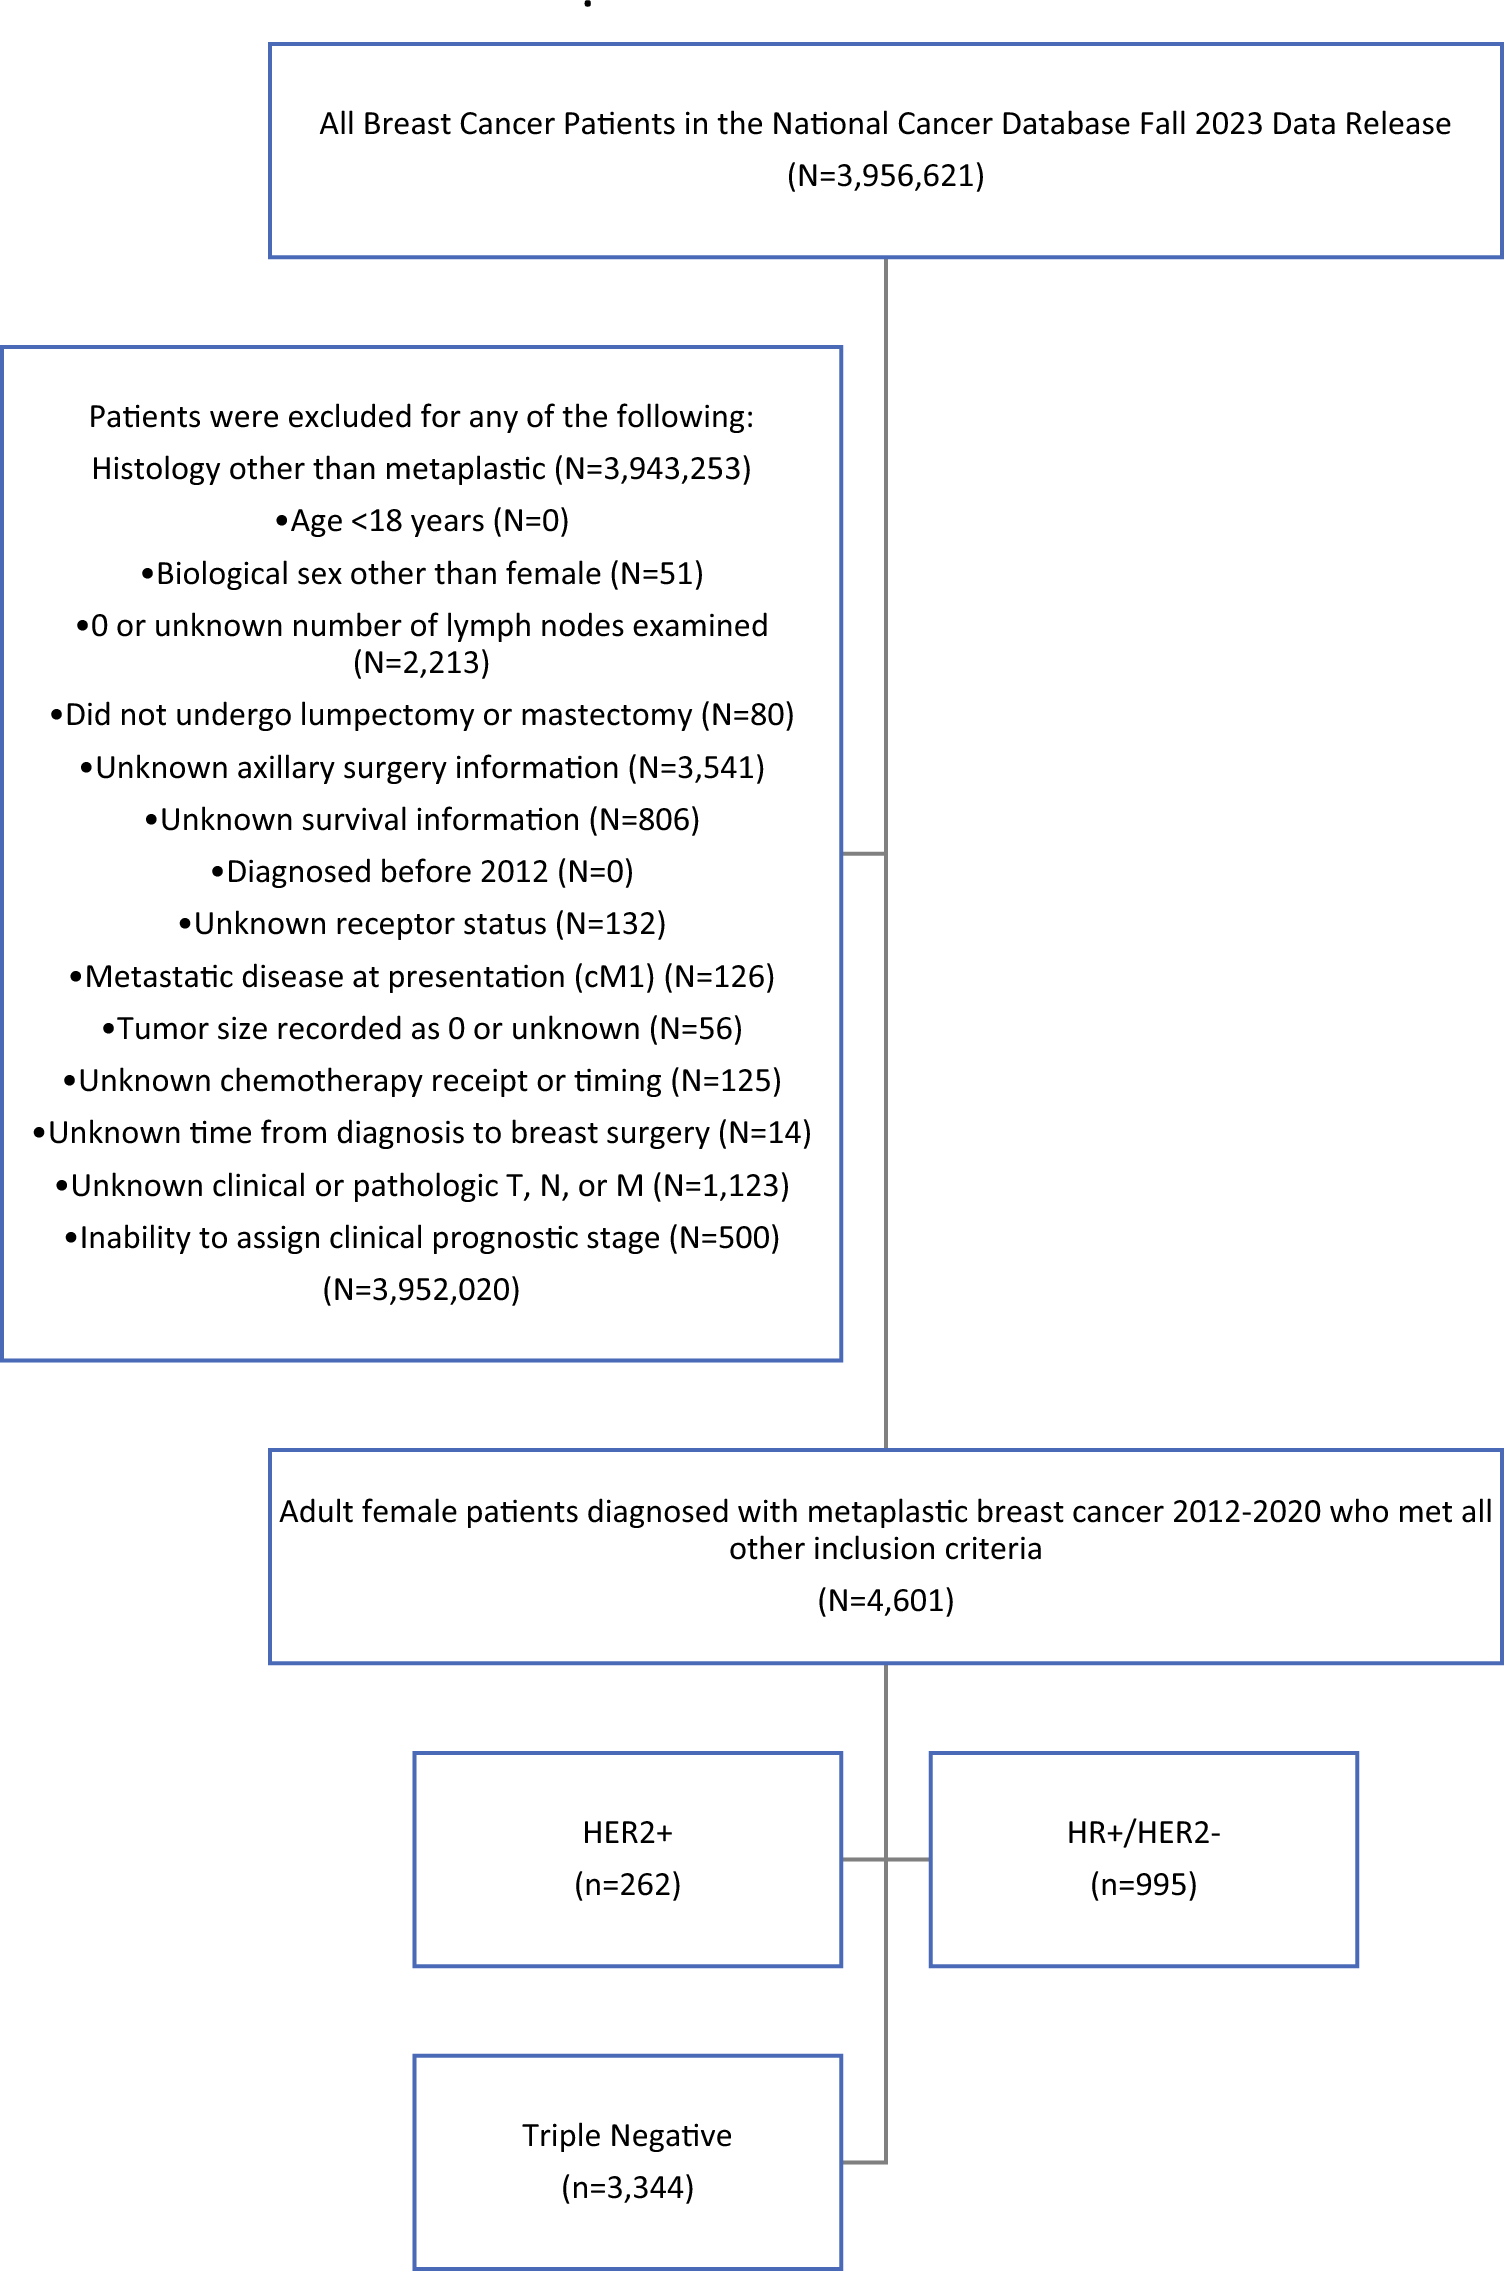


A total of 7616 female patients with clinically non-metastatic, unilateral MpBC on histology were identified. 1691 patients had missing data in one or more category regarding biomarker status, treatment completion, treatment sequencing, or declining at least one element of their physician-recommended treatment and were subsequently excluded from the analysis. Of the remaining 5575 patients who met the full inclusion criteria, 74.9% (n = 4175) had triple-negative disease and 25.1% (n = 1400) were positive for at least one biomarker. The overall baseline demographics for the cohort with MpBC, and a comparison between TN-MpBC and nTN-MpBC are outlined in electronic supplementary material (ESM) Table 1. Most patients were White race (77.2%), treated in a metro geographic location, and had a Charlson–Deyo Comorbidity Index of 0. On comparison between MpBC groups, only age and treatment facility type were different. Compared with nTN-MpBC patients, those with TN-MpBC were slightly older (median age 63 vs. 61 years; p < 0.0001), more likely to be treated at an academic/research program (34.2% vs. 30.9%; p = 0.01), and less likely to be treated at a comprehensive community cancer program (37.0% vs. 41.4%; p = 0.01).
When evaluating cancer-specific factors, most MpBC patients had clinical T1 (31.9%) or T2 (48.7%) and clinical N0 (83.4%) disease, with poorly or undifferentiated clinical grade (82.9%) (Table 1). Pathologic TNM stages were most frequently T1 (34.1%) or T2 (46.7%), N0 (82.0%), and M0 (98.9%). On comparison between groups, the distribution of patients presenting with clinical T stage were equivalent, however nTN-MpBC patients were less likely to have clinical N0 (84.5% vs. 80.2%) and more likely to have clinical N1 (12.3% vs. 16.0%) disease (p = 0.001). nTN-MpBC patients also had lower rates of moderately differentiated clinical grade (14.7% vs. 13.9%; p < 0.0001) with higher rates of lymphovascular invasion (14.5% vs. 17.7%; p = 0.01) and regional lymph node positivity (17.1% vs. 24.5%; p < 0.0001) than TN-MpBC patients. Pathologic TNM stage was more likely to be T0 (2.2% vs. 3.3%) or T2 (45.9% vs. 49.2%) [p = 0.0009] and N1 (12.6% vs. 18.0%; p < 0.0001) in the nTN-MpBC group, but more likely T3 (13.2% vs. 9.6%) or T4 (4.8% vs. 3.5%) [p = 0.0009] and N0 (82.0% vs. 77.8%; p < 0.0001) for TN-MpBC patients.
Table 1 Cancer-specific factor comparison between triple-negative and biomarker-positive metaplastic breast cancerAmong treatment and outcomes variables evaluated, the majority of MpBC patients received surgical resection (97.3%), had regional lymph nodes examined (91.1%), underwent chemotherapy (79.8%), and received radiation therapy (58.3%) (Table 2). Between-group comparison revealed higher rates of residual tumor following surgery (3.3% vs. 2.2%; p = 0.04) for TN-MpBC, but a similar distribution of surgical approach to the primary tumor for both groups. Among patients who received chemotherapy as part of their treatment regimen, TN-MpBC patients were more frequently treated with a multi-agent chemotherapy regimen (95.8% vs. 93.9%; p = 0.04) and had higher rates of NAC sequencing (20.2% vs. 13.4%; p < 0.0001) compared with nTN-MpBC. However, TN-MpBC patients also saw more frequent use of surgical resection alone without systemic therapy (19.0% vs. 9.6%), whereas nTN-MpBC patients were more commonly sequenced with an adjuvant approach (51.3% vs. 61.7%) or both neoadjuvant and adjuvant systemic therapy (9.4% vs. 15.3%) [p < 0.0001]. The nTN-MpBC group saw more utilization of immunotherapy (4.1% vs. 13.5%; p < 0.0001) and hormone therapy (2.5% vs. 51.9%; p < 0.0001) than the TN-MpBC group. Pathologic response to NAC was similar between MpBC cohorts with low rates of pCR (15.8% vs. 20.1%; p = 0.2). Thirty-day mortality was equivalent between MpBC groups, but 90-day (1.5% vs. 0.4%; p = 0.003) and overall mortality (30.6% vs. 27.4%; p = 0.04) were worse for TN-MpBC patients than nTN-MpBC patients, at a median follow-up of 51.1 months. On Kaplan–Meier analysis, there was no significant difference in OS between the TN-MpBC and nTN-MpBC groups.
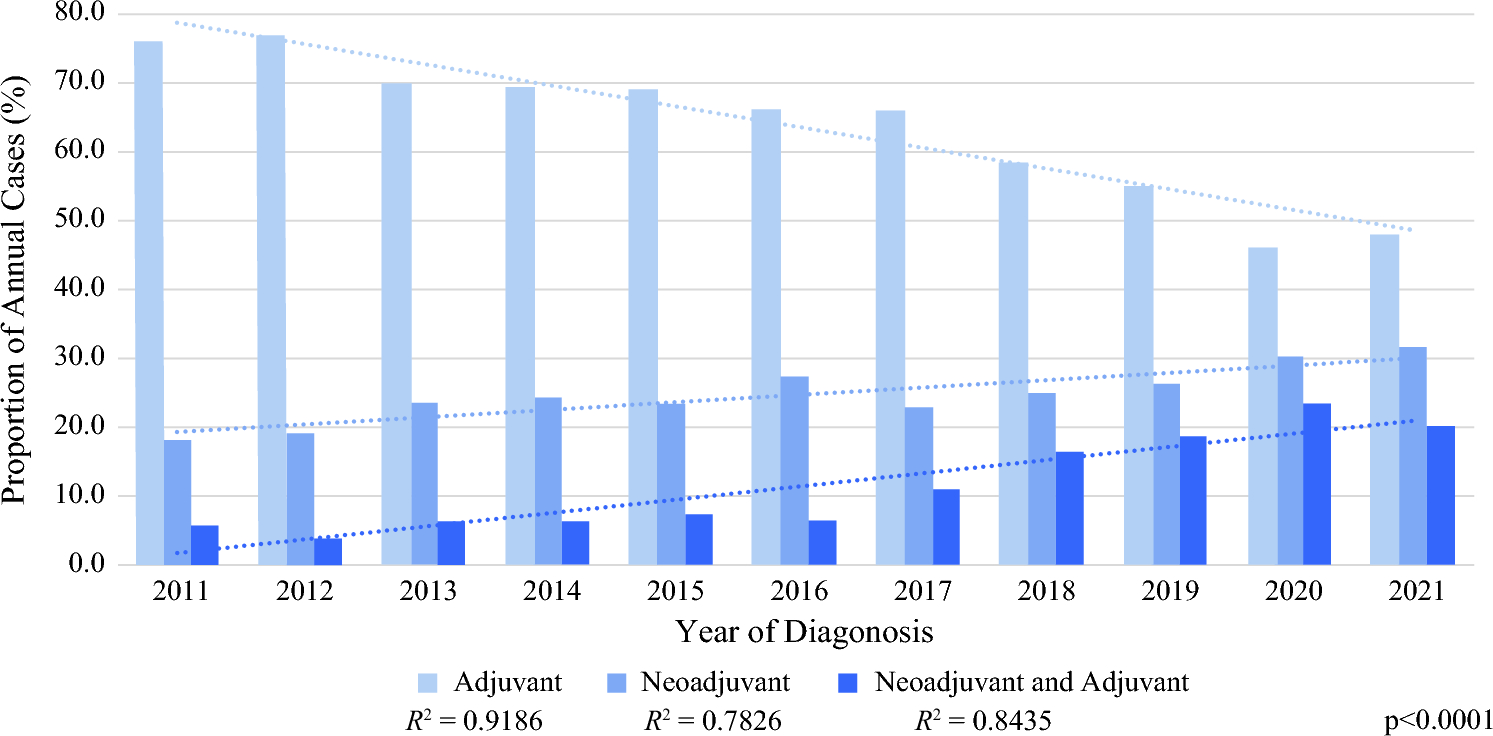
Table 2 Treatment and outcome factor comparison between triple-negative and biomarker-positive metaplastic breast cancerWhen evaluating annual trends in treatment sequencing for systemic therapy and surgery, the rate of NAC and combined neoadjuvant and adjuvant systemic therapy increased annually for TN-MpBC patients, while the rate of adjuvant systemic therapy decreased (Fig. 1). Over the study period, NAC among patients who received systemic therapy increased from 18.3 to 31.5% of cases, combined neoadjuvant and adjuvant systemic therapy increased from 5.7 to 20.1%, and adjuvant systemic therapy decreased from 76.0 to 48.0% of cases. On linear regression analysis, year of diagnosis significantly predicted the systemic therapy sequencing rate (adjuvant R2 = 0.92, neoadjuvant R2 = 0.78, combined neoadjuvant and adjuvant R2 = 0.84). No linear relationship was identified for the annual rate of systemic treatment sequence for nTN-MpBC or the annual rate of TN-MpBC patients who received surgery alone without systemic therapy.
Fig. 1
Rates of systemic treatment sequence among triple-negative metaplastic breast cancer patients by year of diagnosis
When evaluating annual trends in the pathologic response to NAC among patients with MpBC, no significant difference was found in the proportion of pathologic non-response versus response (partial or pCR) over time for TN-MpBC (R2 = 0.03; p = 0.6). Similarly, when evaluating the annual rate of pCR versus partial pathologic response, no significant change was identified by year of diagnosis (pCR: R2 = 0.16, p = 0.2; partial response: R2 = 0.27, p = 0.1). A similar lack of change over time among nTN-MpBC patients was found for overall response and pCR rates.
Metaplastic versus Triple-Negative Ductal Breast CancerA total of 144,080 patients with TN-IDC were identified. The baseline demographic comparison between TN-MpBC (n = 4175, 2.8%), nTN-MpBC (n = 1400, 0.9%), and TN-IDC (n = 144,080, 96.3%) is outlined in ESM Table 2. The MpBC cohorts were older and more likely White race, treated at an academic/research program, and insured with government insurance, and less likely Black race or to have a Charlson–Deyo Comorbidity Index of 0 than the TN-IDC group.
When evaluating cancer-specific factors, both MpBC cohorts had higher clinical and pathologic T stages (p < 0.0001) (Table 3). Conversely, clinical and pathologic N stages were lower for both TN-MpBC and nTN-MpBC compared with TN-IDC (p < 0.0001). TN-IDC had a higher likelihood of moderate differentiation on clinical grade, lymphovascular invasion, and regional lymph node positivity, and higher rates of Ki-67 than either group with MpBC (p < 0.0001 for all).
Table 3 Cancer-specific factor comparison between triple-negative metaplastic breast cancer, biomarker-positive metaplastic breast cancer, and triple-negative ductal breast cancerAmong treatment and outcomes variables evaluated, TN-MpBC patients had slightly higher rates of surgical resection (97.5%) than nTN-MpBC (96.6%) or TN-IDC patients (96.1%) [p < 0.0001]) but were more likely to have residual tumor after resection (3.3% vs. 2.2% vs. 2.6%; p = 0.02) (Table 4). Both the TN-MpBC (45.3%) and nTN-MpBC (43.9%) cohorts were less likely to receive a partial mastectomy than the TN-IDC cohort (53.2%) [p < 0.0001] or have regional lymph nodes examined (91.0% vs. 91.6% vs. 93.4%; p < 0.0001). Compared with TN-MpBC and nTN-MpBC, TN-IDC patients were more likely to receive chemotherapy (80.1% vs. 78.8% vs. 87.1%; p < 0.0001) and radiation therapy (58.3% vs. 58.3% vs. 63.4%; p < 0.0001) and had a higher likelihood of an NAC sequence of systemic therapy (20.2% vs. 13.4% vs. 32.9%; p < 0.0001). nTN-MpBC patients had a lower likelihood of receiving a multi-agent chemotherapy regimen (95.8% vs. 93.9% vs. 95.7%; p = 0.002), but more were more likely to receive immunotherapy (4.1% vs. 13.5% vs. 5.3%; p < 0.0001) and hormone therapy (2.5% vs. 51.9% vs. 3.0%; p < 0.0001) than triple-negative patients in either group. When considering response to NAC, higher rates of non-response were found among TN-MpBC (23.6%) and nTN-MpBC (23.4%) patients compared with TN-IDC (6.5%) [p < 0.0011]. 30- and 90-day mortality was higher among TN-MpBC (p = 0.0002 and p < 0.0001). At a median follow-up time of 51 months for MpBC and 54 months for TN-IDC, overall mortality was higher for TN-MpBC (30.6%) and nTN-MpBC (27.4%) compared with TN-IDC (20.4%) [p < 0.0001).
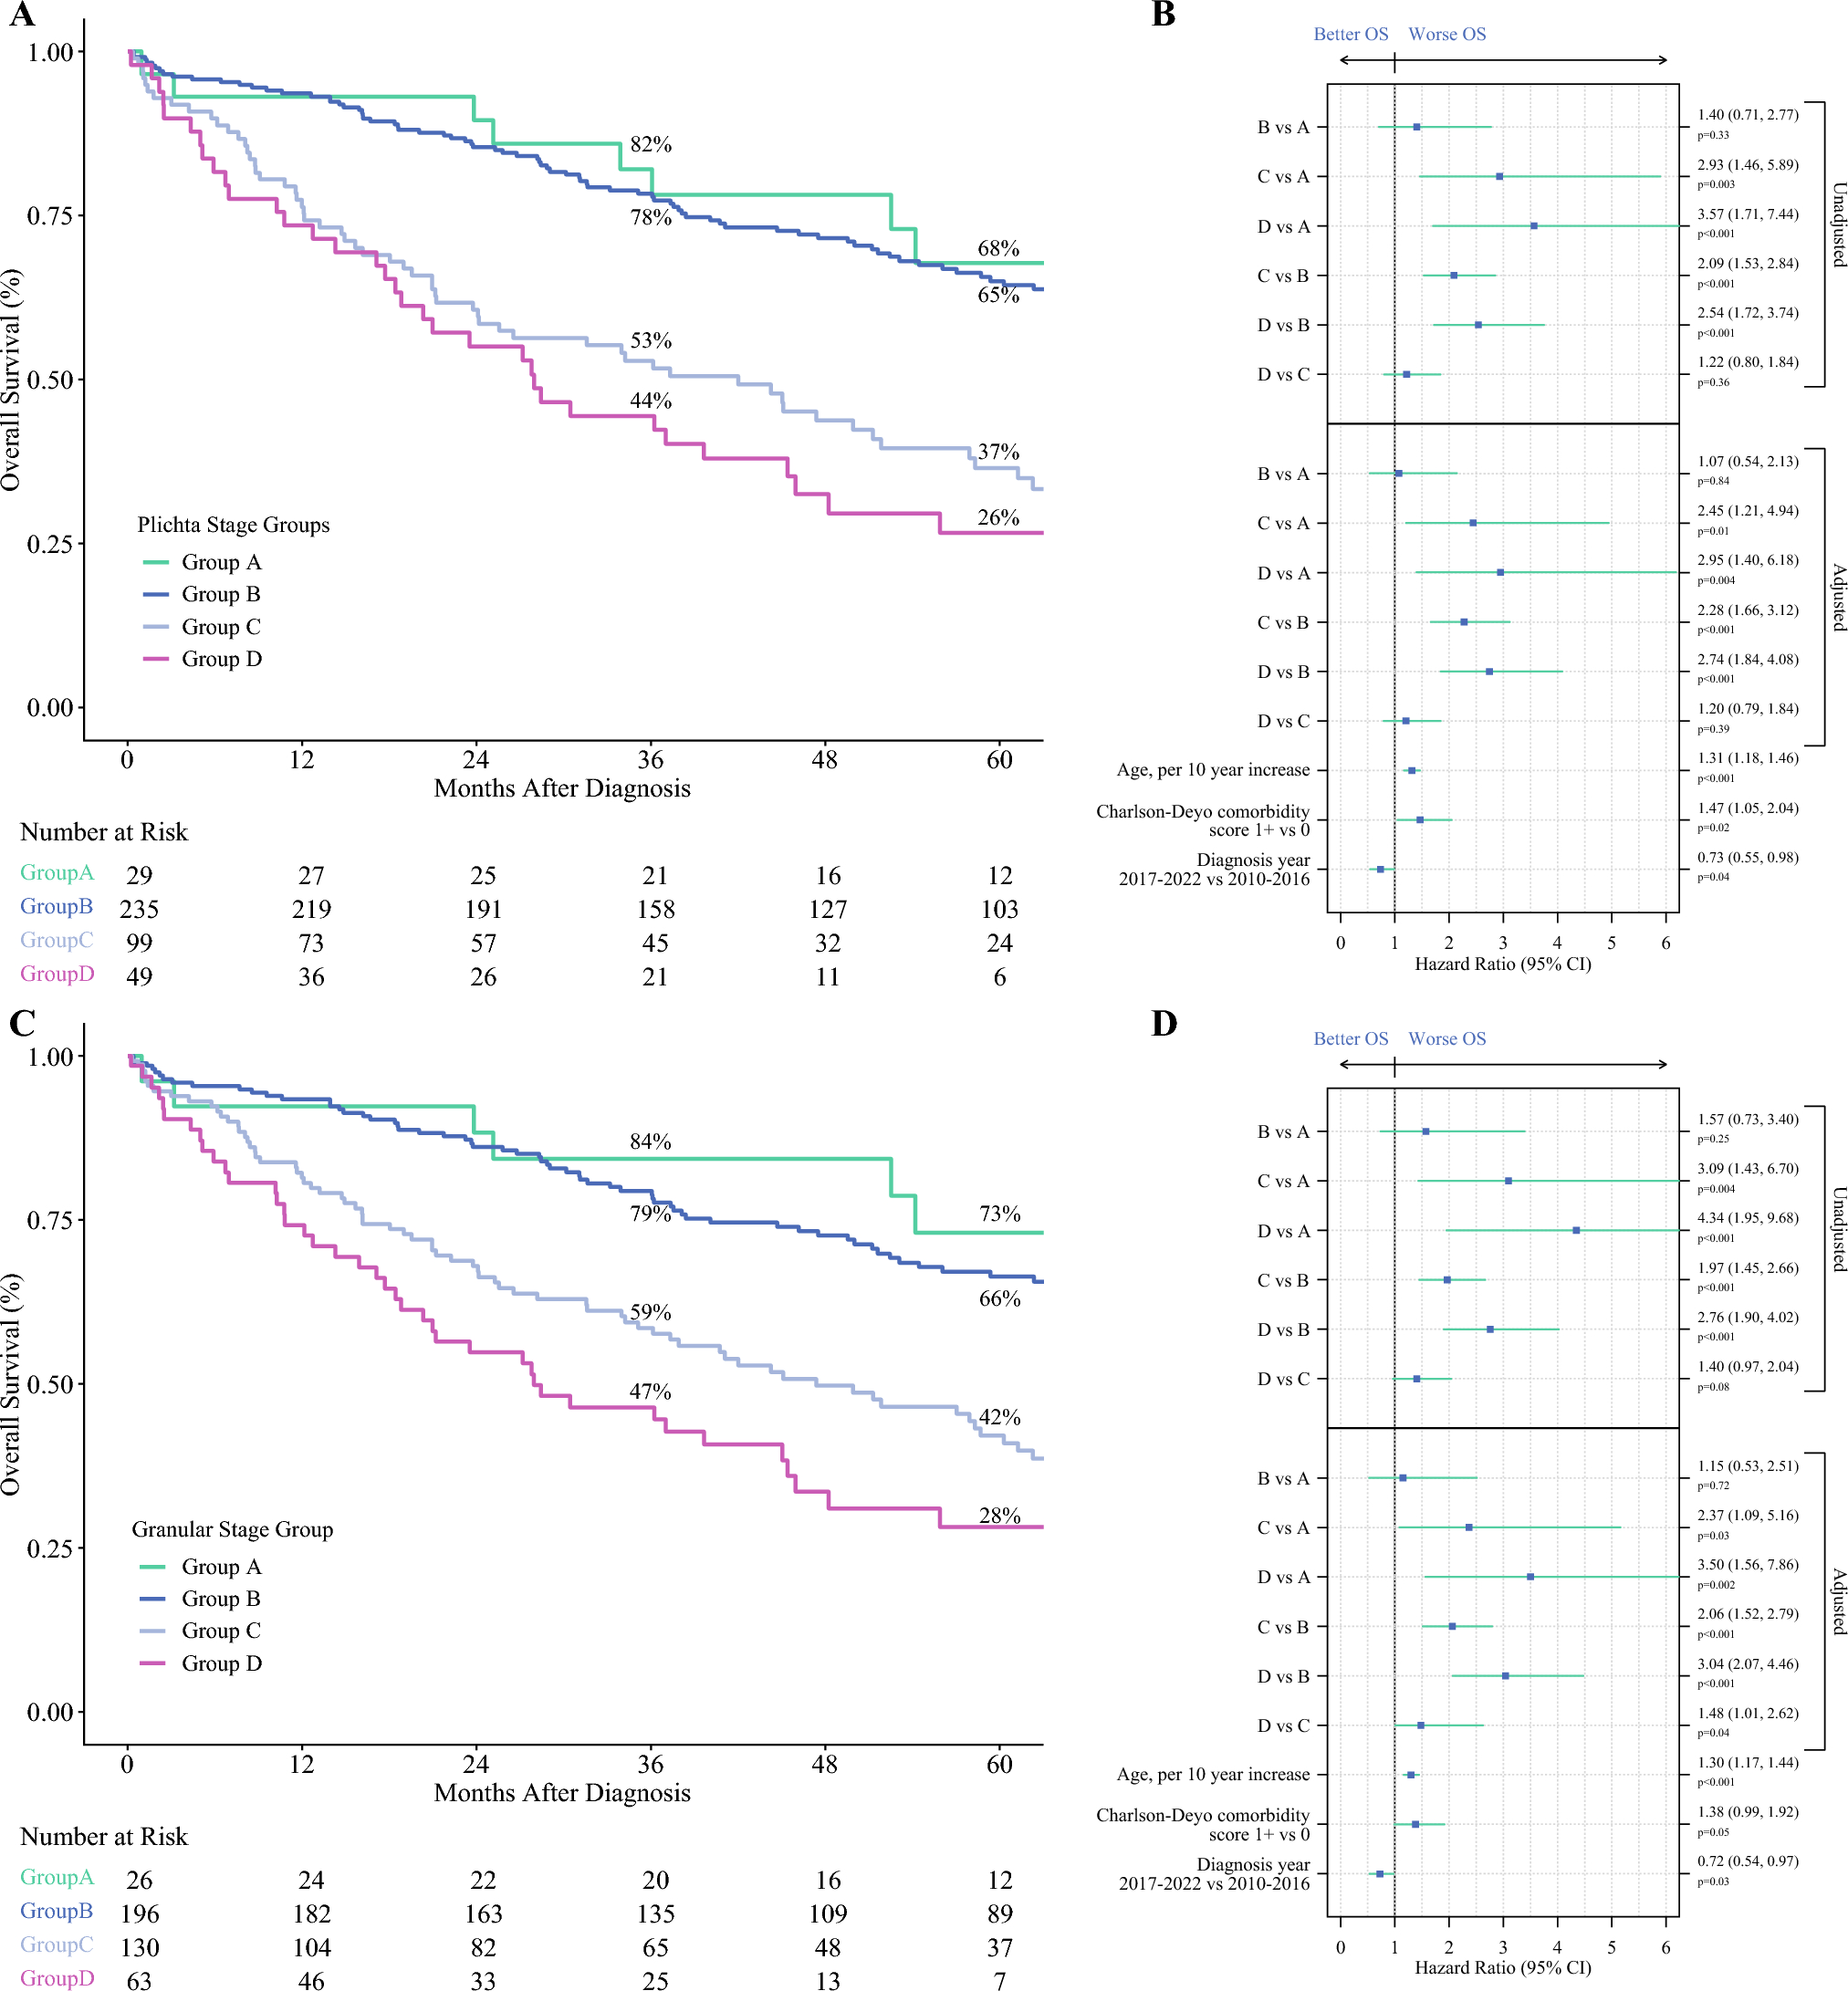
Table 4 Treatment and outcome factor comparison between triple-negative metaplastic breast cancer, biomarker-positive metaplastic breast cancer, and triple-negative ductal breast cancerOn Kaplan–Meier survival analysis, TN-MpBC and nTN-MpBC had lower OS than TN-IDC (p < 0.0001) (Fig. 2). When OS was evaluated by MpBC undergoing versus not undergoing NAC, an NAC approach for MpBC regardless of biomarker status had significantly worse OS than either not undergoing NAC or TN-IDC (p < 0.0001). On sensitivity analysis of survival for MpBC cohorts and sequence of systemic therapy, an adjuvant approach had significantly better OS than all other approaches to treatment, including NAC (p < 0.0001) (Fig. 3). When evaluated by pathologic response to NAC, a partial or non-response had worse survival compared with complete response and not undergoing NAC (p < 0.0001).
Fig. 2
Kaplan–Meier survival curves by (a) biomarker status, and (b) biomarker status and sequence of systemic therapy.
Fig. 3
Kaplan–Meier survival curves for triple-negative metaplastic breast cancer comparing overall survival by a triple-negative metaplastic breast cancer sequence of systemic therapy; b triple-negative metaplastic breast cancer response to neoadjuvant systemic therapy; c biomarker-positive metaplastic breast cancer sequence of systemic therapy; and d biomarker-positive metaplastic breast cancer response to neoadjuvant systemic therapy. NAC neoadjuvant chemotherapy
Finally, on Cox proportional hazard regression modeling of the matched patients (n = 642, SMD range −0.011 to 0.97, variance ratio range 0.97–1.67), NAC was associated with mortality (aHR 2.56 [2.36–4.79]; p = 0.003) compared with not undergoing NAC (ESM Table 3). Clinical T4 stage versus clinical T0 (aHR 8.29 [1.20–57.00]; p = 0.03) and regional lymph node positivity versus no positive regional lymph nodes (aHR 6.53 [1.24–34.42]; p = 0.03) were also independently associated with mortality on regression modeling.
Comments (0)