
Remember me
We conduct simulation studies to illustrate how other regression models compare to the proposed model in terms of estimating the relationships of interest. If unaware of the discussion about centering in multi-level models, one might consider simply including the individual-level characteristic, PO-year affiliation status, and its interaction with affiliation status to capture the effects of system affiliation on disparities, as reflected in the following model:
$$ y_ = \beta_ + \beta_ x_ + \beta_ x_ z_ + \beta_ z_ + \delta_ + u_ + u_ + e_ . $$
(2)
The PO-year and PO effects could be modeled as random effects, or PO and year effects can be treated as fixed effects, and the interpretation of the regression coefficients will differ (Bell et al. 2019; Hamaker and Muthen 2020). When the within-group and between-group effects are not equal, the random effects model without centering will produce a weighted average of the two effects (e.g., \(\beta_\) in (2) will be a weighted average of \(\beta_\) and \(\beta_\) in (1)), and these weights are equal to the precision of the estimates. In our applications of interest, there are far more beneficiaries than there are POs, so \(\beta_\) will tend towards \(\beta_\). We refer to (2) as \(M_\) and \(M_\) depending on whether fixed or random effects are used. Note that if the PO and PO-year effects are excluded altogether, this model can be used to estimate the total effect of affiliation on disparities.
If using a multi-level model and aware of the importance of centering to identify within-group effects and separate them from between-group effects, it might be clear that the individual-level characteristic \(x_\) needs to be centered at the PO-level to be interpreted as a within-PO effect on quality, and thus one might fit the following model with centering of \(x_\):
$$ y_ = \beta_ + \beta_ \left( - \overline_ } \right) + \beta_ \overline_ + \beta_ z_ \left( - \overline_ } \right) + \beta_ z_ + \delta_ + u_ + u_ + e_ . $$
(3)
We refer to (3) as \(M_ }}\) since the level 1 individual-level variable \(x_\) is centered. This model differs from (1) because it does not center the interaction term directly, does not include the mean interaction term at the group-year level as a covariate, and does not center the group-year level affiliation status at the group-level.
Finally, one might combine the modeling framework for within- and between-effects in clustered or grouped data (reflected in (3)) with the comparative longitudinal data models that disentangle the longitudinal and cross-sectional effects of affiliation to estimate the following model:
$$ y_ = \beta_ + \beta_ \left( - \overline_ } \right) + \beta_ \overline_ + \beta_ z_ \left( - \overline_ } \right) + \beta_ \left( - \overline_ } \right) + \beta_ \overline_ + \delta_ + u_ + u_ + e_ . $$
(4)
We refer to (4) as \(M_ ,\overline }}\) since the level 1 individual-level variable \(x_\) and the level 2 group-year level variable \(z_\) are both centered. This model differs from (1) because it does not center the interaction term directly or include the mean interaction term at the group-year level as a covariate.
For illustration, we also include a model that is like the one we propose (1), but excludes the terms capturing the between-PO effects, e.g.,
$$ y_ = \beta_ + \beta_ \left( - \overline_ } \right) + \beta_ \left( - \overline_ } \right) + \beta_ \left( - \overline_ } \right) + \delta_ + u_ + u_ + e_ . $$
(5)
We refer to this model as \(M_\).
For each of the models discussed, we have included PO and PO-year effects, \(u_\) and \(u_\), however we also implement versions of these models that exclude the PO-year effects, and just include PO effects. Table 1 provides a tabular description of each model, indicating which terms are centered versus uncentered, included versus excluded, and what types of random (or fixed) PO or PO-year effects are included.
Table 1 Description of each model compared in simulationsSimulation Study 1. We know that model (1) will capture the disparities of interest as defined in the Methods section. Therefore, we generate data of a similar structure to our motivating application and compare each of the models described above in terms of how closely they estimate the disparities of interest, to illustrate how much bias is obtained by using a different model than the one proposed.
We assume 1000 POs are observed over two years, and generate individuals or beneficiaries nested within PO-years. All POs are assumed unaffiliated in year 1, and in year 2, affiliation status is randomly generated for each PO with probability 0.5 of being affiliated (e.g., \(z_ = 0\), and \(z_ \sim }\left( \right)\)). To create individual-level dual status flags we generate a percent dual value for each PO in each year, \(p_\), with \(p_ \sim }\left( \right)\), and some random noise with standard deviation 0.05 added for year \(t = 1\), to reflect realistic small changes in the composition of a PO over time. We then sample individual-level dual status as \(x_ \sim }\left( } \right)\), for \(i = 1, \ldots ,n_\), where \(n_ = 10\). We next generate PO-year level and PO-level random effects, with \(\gamma_ \sim N\left( ^ } \right)\), \(\gamma_ \sim N\left( ^ } \right)\), and \(\gamma_ \sim N\left( ^ } \right)\).
Finally, we simulate individual-level outcomes using (1), with realistic parameter values corresponding to \(\beta_ = 50\), \(\beta_ = - 10\), \(\beta_ = - 20\), \(\beta_ = 1\), \(\beta_ = - 1\), \(\beta_ = 1\), \(\beta_ = 0\), and \(\delta_ = 0\). This set-up corresponds to a within-PO effect of dual of \(- 10\), and a between-PO effect of dual of \(- 20\). In this scenario, affiliation leads to an improvement in within-PO disparities by 1 point, and a worsening of between-PO disparities by 1 point. We let \(\sigma_ = 10\), \(\sigma_ = 10\), and \(\sigma_ = 5\), so there is within-PO and between-year variation not fully accounted for by the model, though it is smaller than the PO-level variation.
We repeat the process of simulating data 500 times to obtain 500 simulated datasets for analysis, and for each dataset, we fit our proposed model, \(M_\), and the other comparison models, \(M_\), \(M_\), \(M_ }}\), \(M_ ,\overline }}\), and \(M_\). We calculate the bias for each quantity of interest under each model (difference between the estimated and true parameter value) and compare across models using absolute bias and a relative bias measure, where bias is expressed relative to the standard deviation of the simulated outcomes.
Tables 2 and 3 display the bias and relative bias for each parameter of interest from each model. The models that center the individual-level dual status (\(M_\),\(M_ }}\), \(M_ ,\overline }}\), \(M_\)) have the least bias for within-PO disparities, and the simple random effects models without centering, \(M_\), have the most bias. This is the same pattern observed for the effect of affiliation on within-PO disparities. For between-PO disparities, the proposed model \(M_\) has the least bias, and it is the only one that estimates the effect of affiliation on between-PO disparities. For the main effect of affiliation, which is the effect of affiliation on quality within POs for non-duals (in POs without any duals), \(M_\) also has the least bias. There is not a meaningful difference between the version of a model with both PO-year and PO random effects versus one with just PO random effects, though the one with PO and PO-year random effects has slightly less bias.
Table 2 Bias for within-PO disparities, between-PO disparities, effect of affiliation on within-PO disparities, effect of affiliation on between-PO disparities, and effect of affiliation on non-duals from Simulation 1Table 3 Relative bias for within-PO disparities, between-PO disparities, effect of affiliation on within-PO disparities, effect of affiliation on between-PO disparities, and effect of affiliation on non-duals from Simulation 1The takeaway from this simulation is that to estimate all disparities and affiliation effects of interest, the proposed model \(M_\) is necessary. Additionally, all parameters estimated by \(M_\) and \(M_\) have more bias than those estimated by \(M_\), two of four of the parameters estimated by \(M_ }}\) and \(M_ ,\overline }}\) have more bias, and \(M_\) produces more bias for the main effect of affiliation.
Simulation Study 2. Next, we simulate comparative longitudinal data similar in structure to our motivating application, but not exactly from the proposed model. As with Simulation 1, all POs are assumed unaffiliated in year 1, and we generate affiliation status in year 2, and PO-year-level percent dual, and individual-level dual status in the same way. We next generate PO-year level quality effects as \(\gamma_ \sim N\left( _ ,\sigma_^ } \right)\) and \(\gamma_ \sim N\left( _ - 5z_ \overline_ ,\sigma_^ } \right)\), which encodes a negative contextual and between-PO effect of dual eligibility on quality, and a negative effect of affiliation on contextual effects and between-PO disparities. We additionally generate random PO effects, encoding the belief that POs have different levels of quality that persist over time that aren’t explained by the composition of the PO, with \(\gamma_ \sim N\left( ^ } \right)\). Finally, we simulate individual-level outcomes as follows: \(y_ \sim N\left( + \gamma_ - 10x_ + z_ + x_ z_ ,\sigma_^ } \right)\), for \(j = 1, \ldots ,100\), \(t = 1,2\) and \(i = 1,2, \ldots ,10\).
This set-up corresponds to a within-PO effect of dual-eligibility of \(- 10\), a contextual effect of \(- 20\), and thus a between-PO effect of dual of \(- 30\). In this scenario, affiliation leads to an improvement in quality for non-duals of 1 point, but it also reduces disparities within POs by 1 point. However, affiliation leads to between-PO disparities that are larger (worsened) by 4 points (after affiliation, within-PO disparities are reduced by 1 point and contextual effects are of dual worsened by 5 points, leading to a worsening of between-PO disparities by 4 points). We let \(\sigma_ = 10\), \(\sigma_ = 10\), and \(\sigma_ = 5\), as in Simulation 1, and conduct repeated simulations to compare bias for each quantity of interest under each model.
Table 4 displays the relative bias for each parameter of interest from each model. Consistently with the prior simulation scenario, the models that center the individual-level dual status (\(M_\),\(M_ }}\),\(M_ ,\overline }}\), \(M_\)) have by far the least bias for within-PO disparities, and much less than the random effects models without centering. This is the same pattern observed for the effect of affiliation on within-PO disparities. For between-PO disparities, the proposed model \(M_\) also has the least bias by far, with PO-year and PO random effects giving slightly less bias than just PO random effects. For the main effect of affiliation, \(M_\) also has the least bias, however PO random effects only gives less bias than PO-year and PO random effects.
Table 4 Relative bias for within-PO disparities, between-PO disparities, effect of affiliation on within-PO disparities, effect of affiliation on between-PO disparities, and effect of affiliation on non-duals from Simulation 2The overall conclusion from these simulations is that the proposed model \(M_\) provides estimates for all quantities of interest and has the least bias. The choice to use PO versus PO and PO-year random effects should be based on the data, and whether the results indicate PO-year random effects are needed in addition to PO random effects.
3.2 The effect of health system affiliation on disparities in diabetes medication adherenceWe now apply the proposed model, \(M_\), to estimate the effects of affiliation on within- and between-PO disparities in the diabetes medication adherence measure, a quality measure for evaluating the performance of healthcare providers, and defined as the percent of members with a prescription for diabetes medications who fill their prescription often enough to cover 80% or more of the time they are supposed to be taking the medication. Levin et al. found some evidence of worsening disparities in medication adherence rates following health system affiliation of PCPs (Levin et al. 2023). Our methods focus on disparities within POs as meaningful units, since most strategies to address disparities are at the organization-level (data infrastructure, provider training, quality improvement processes, etc.), and the decomposition analysis provides a deeper understanding of equity.
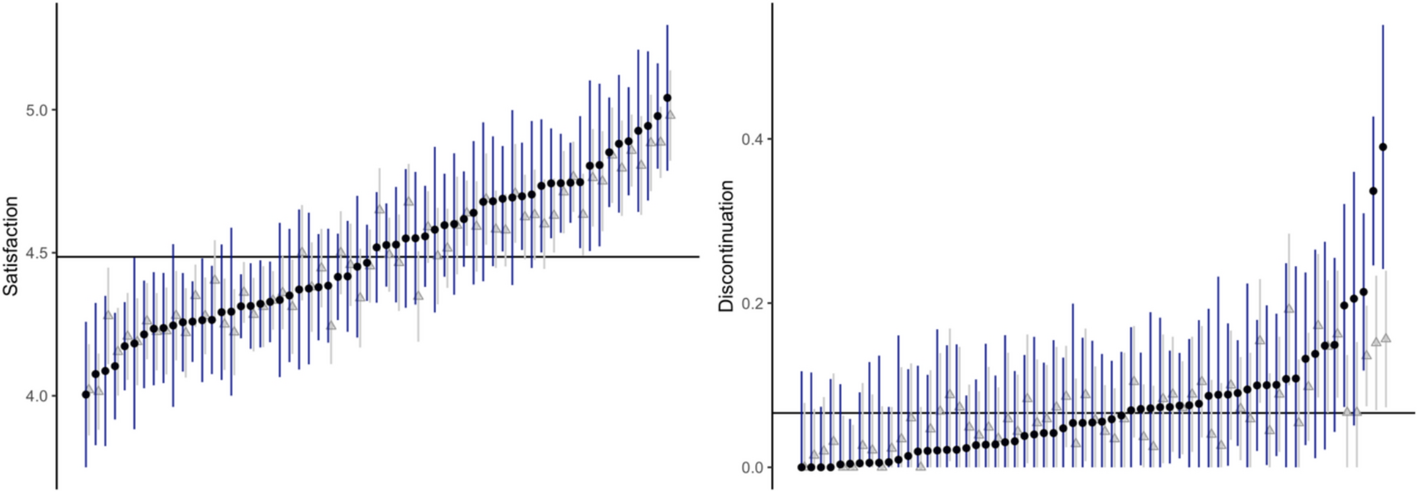
\(M_\) was applied with PO and PO-year random effects, and with adjustment for standard beneficiary and PO characteristics described in Methods. Figure 1 plots the point estimates and 95% confidence intervals for within-PO and between-PO disparities in unaffiliated POs (\(\beta_\) and \(\beta_ )\), which were positive and negative respectively, indicating that in unaffiliated POs, duals were actually doing better on this measure within POs, but were concentrated in poorer performing POs. However, affiliation had a negative effect on within-PO disparities (captured by \(\beta_\)), meaning quality for duals got worse relative to non-duals compared to pre-affiliation quality levels, but a positive effect on between-PO disparities (captured by \(\beta_ )\) indicating that there are smaller differences in the quality of affiliated POs that serve duals vs. those that serve non-duals.
Fig. 1
Estimated within- and between-PO disparities and effect of affiliation on within- and between-PO disparities for diabetes medication adherence measure
Comments (0)