
Remember me
On-demand neuromodulation can be used to treat neurological disorders such as Parkinson’s disease [1] and epilepsy [2] as well as to investigate how the brain works. Most clinical neuromodulation is based on implanted electrode probes and implanted pulse generators, necessitating neurosurgery for the implantation. In addition, the implanted probes have long-term reliability issues, leading to the ineffectiveness of the probes over time, as hardened tissues form around the probes. It has also been reported that implanted electrodes can cause the gradual loss of neurons within approximately 50–70 μm distance from the microelectrodes [3]. Various alternative neurostimulation techniques have been explored, such as optical stimulation [4], chemical stimulation [5], transcranial magnetic stimulation (TMS) [6], transcranial electrical stimulation (TES) [7], thermal stimulation [8], and ultrasound stimulation [9]. Each of these techniques presents its own advantages and disadvantages.
Optical stimulation, also known as optogenetic stimulation, uses light-sensitive channels or opsin which can be virally introduced into neurons. Optical stimulation with optical fibers offers a spatial resolution of 0.1–1 mm and a temporal resolution in the order of milliseconds [10]. One notable advantage of optogenetics is its ability to provide cell-type-specific stimulation within a tissue through selective genetic activation and inactivation of light-sensitive ion channels [4]. However, optogenetic stimulation requires injection of viruses and has limited penetration depth [11].
The chemogenetic method is similar to optogenetic in that it also requires genetic modifications of tissue, but employs chemically engineered molecules or ligands instead of light or light-sensitive channels. Chemical stimulation commonly involves designer receptor exclusively activated by designer drugs to ensure a good spatial selectivity [12], but suffers a slow temporal resolution of minutes–hours [13]. Though both optical and chemical neuromodulations have been useful in understanding brain activity, they share a limitation in requiring genetic modification of the tissue, which hinders their translation to clinical applications for which electrode implantation remains the preferred method [14].
TES and TMS are non-invasive neuromodulation techniques using electromagnetic waves and magnetic fields, respectively. However, the efficacy of the current delivered to neurons through TES is not as potent as that by TMS in eliciting an action potential (AP) [15]. Additionally, TES faces limitations in spatial resolution, though TMS can be focused on a small volume. Prefrontal TMS therapy is widely employed for treating major depressive disorder by depolarizing cerebral neurons, and it has received approval from the US Food and Drug Administration (FDA) [16]. Despite being considered a safe tool, TMS requires a large coil to generate the magnetic field, which is attached to the patient’s head and may be accompanied by a few side effects such as recurrent headaches and a tingling sensation on the face [17].
In contrast, focused ultrasound stimulation (FUS) offers spatial focusing as small as 10 µm in diameter [18], with a temporal resolution as fast as 1.5 ms [19]. Unlike magnetic stimulation, FUS does not necessitate large equipment to deliver sufficient acoustic energy for eliciting neuronal activities; the drive electronics can be miniaturized and made portable. Leveraging these advantages, FUS is used in clinical settings for imaging and tumor ablation [20]. Moreover, the FDA has recently approved a FUS device for treating patients with advanced PD who experience symptoms such as mobility issues, rigidity, or dyskinesia [21]. This underscores the growing acceptance and application of FUS in therapeutic interventions.
In 1958 Fry et al reported a temporary neural inhibition in a cat’s eye when it was stimulated with a focused ultrasonic beam onto the lateral geniculate nuclei [22]. Since then, ample efforts have been made for FUS neural modulation in both the central and peripheral nervous systems. Some studies indicate that low-intensity ultrasound (ISPTA = 23 mW cm−2, ISPPA = 2.9 W cm−2) at low frequencies (0.44–0.66 MHz) can increase Na+ and Ca2+ currents [9]. Transcranial pulsed ultrasound (ISPTA = 84.32 mW cm−2, f= 0.25 MHz) has been reported to increase spike frequency by triggering TTX-sensitive neuronal activity without a significant rise in brain temperature (<0.01 °C) [23]. Moreover, continuous ultrasonic stimulation at 43 MHz for 200 ms is reported to activate Piezo1 channels in human embryonic kidney cells [24], as well as TWIK-related acid-sensitive K+ (TASK) channels in pyramidal cells of the hippocampus CA1 region [25]. Applying 10 MHz ultrasound (ISPTA = 4.9 W cm−2) for 20 ms with a 1 kHz pulse repetition frequency (PRF) is reported to modulate and increase Nav1.5 channel current [26]. Furthermore, ultrasonic waves have been reported to alter the passive properties of cell membranes, including conductance and capacitance [25, 27]. More recent reports suggest that FUS can both stimulate and inhibit neurons through tuning the PRF and pulse duration [28–31].
Although FUS-based neural stimulation and inhibition have been widely reported at the behavioral level and molecular level, the underlying mechanism for such effects is still not well understood. Patch clamp experiment is a good technique that can be used to understand the mechanism of FUS-based neural stimulation, since it allows monitoring of neuron activities at a cellular level. But the whole-cell patch-clamp experiment requires a good visibility of cells on the top of a neural tissue with light shining from the beneath of the tissue with a FUS transducer in between the tissue and the light source, typically absorbing the light. Consequently, various approaches such as a blind patch clamp [31], usage of reflector cones to redirect acoustic waves [29], and emulation of acoustic effects with mechanical poking with a glass pipette [32] have been explored with limited effectiveness, as these methods fail to achieve the precise control of FUS on the target neuron. This paper describes the FUS neuromodulation study with patch clamp experiments using a self-focusing acoustic transducer (SFAT) built on a thin and translucent 127 μm thick lead zirconate titanate (PZT) substrate. The microfabricated SFAT (with its center area having no electrode) has a small, planar footprint and good infra-red (IR) light transmittance, making it an excellent fit for whole-cell patch clamp experiments on rat brain slices. The translucent transducer allows IR light to pass through, ensuring good visibility of cells when patching a glass pipette onto a neuron cell on the brain tissue that sits directly on the transducer. With the SFAT operating at 18.4 MHz, we have successfully carried out 323 whole-cell patch clamp experiments on pyramidal neurons in the CA1 region of hippocampal slices from Sprague Dawley rats with a variety of pulsed FUS parameters such as peak-to-peak voltage, PRF, and pulse duration or the number of cycles per pulse. The experiment results indicate the bi-directional neuromodulation (inhibition and excitation) depending on the FUS parameters and the optimal parameters for both inhibition and excitation are reported in this paper.
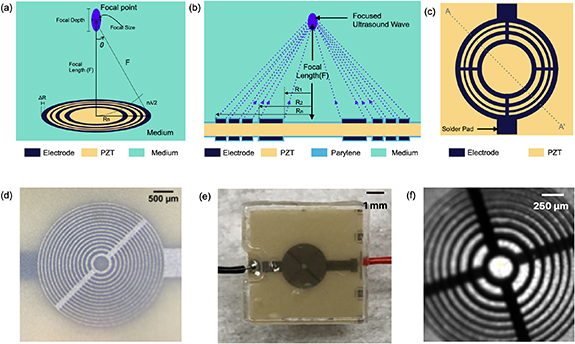
2.1. Device designAn SFAT is composed of an ultrasonic sound source responsible for the generation of ultrasound waves and a patterned electrode designed for near-field wave interference. The sound source is a bulk sheet of piezoelectric PZT, which is sandwiched by its top and bottom electrodes. A PZT-5A is chosen as a substrate piezoelectric material for its high piezoelectric coefficient and electromechanical coupling coefficient. When a sinusoidal electrical signal, whose frequency is matched with the thickness-mode resonance of a PZT thin substrate, is applied between the top and bottom electrodes, the PZT vibrates with its resonance and generates acoustic waves [33]. A 127 µm PZT substrate, which offers good IR transparency, is chosen for a thickness-mode resonance frequency  of about 18.4 MHz.
Focusing is achieved by ensuring that the acoustic waves arrive in phase (0°–180°) at a focal point (at a distance F away from the transducer center) [34] through patterning the top and bottom electrodes into Fresnel half-wavelength band (FHWB) rings (figures 1(b) and (c)). When alternating current voltage of the resonant frequency is applied across the top and bottom electrodes, only the portions of PZT sandwiched between the electrodes vibrate and generate in-phase acoustic waves. Geometrically, each ring’s boundary is designed so that the distance to the focal point is equal to integer multiples of the half wavelength ( ) in the medium plus the focal length (F) (figure 1(a)). The radii of rings
  corresponding to a desired focal length (F) can be determined using the following equation

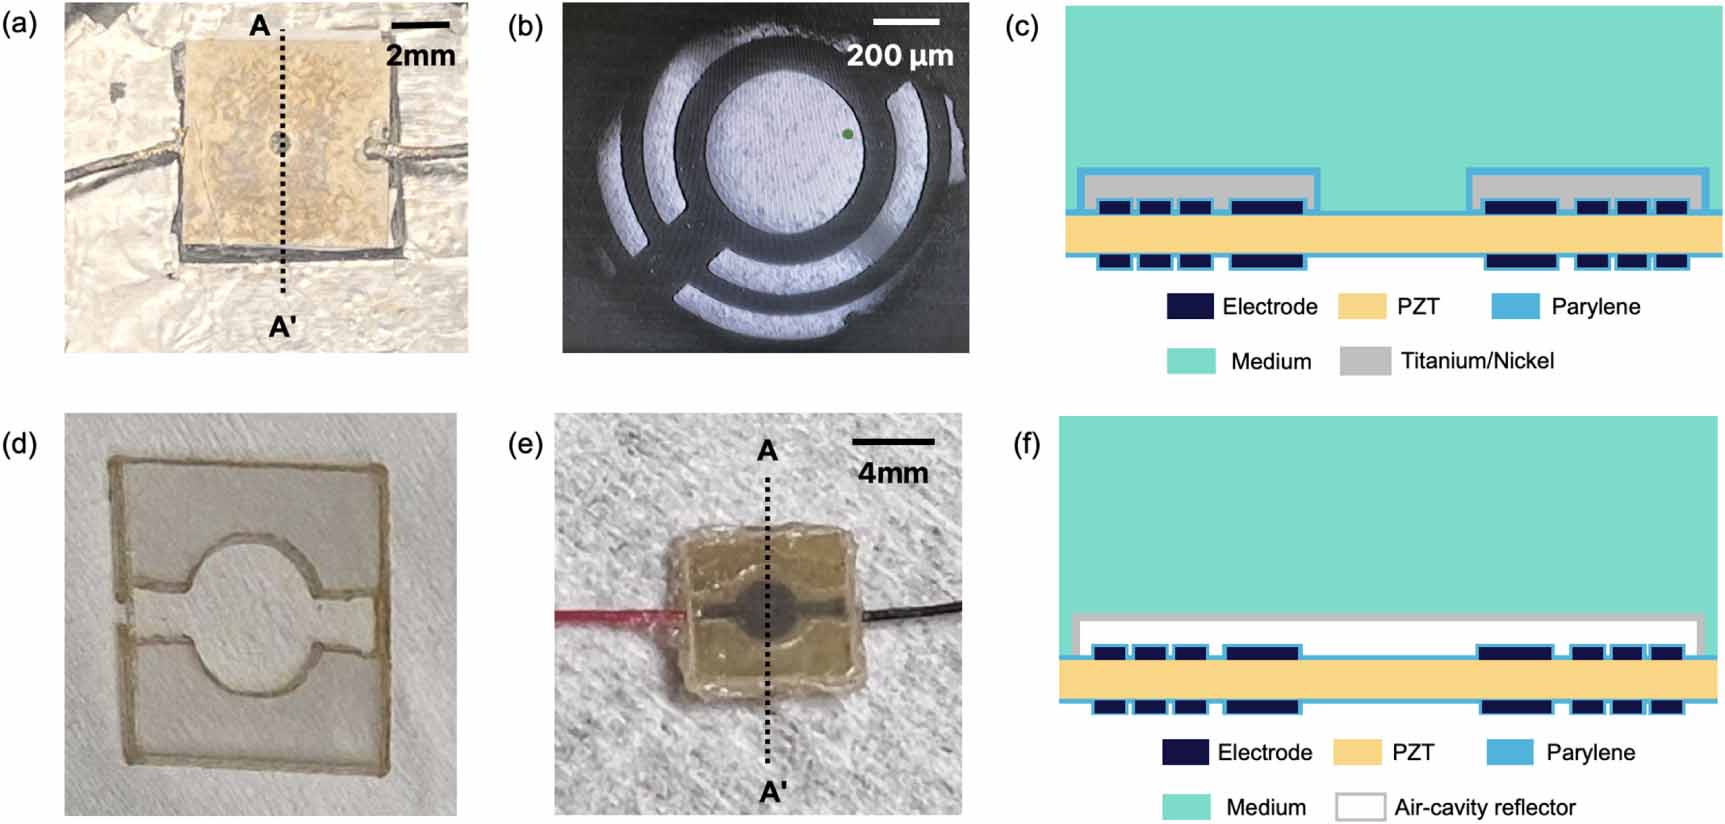
Figure 1. (a) Conceptual diagram of focused ultrasound generated by SFAT, defining the focal size, focal depth, focal length, half angle ( ), ring radius (
 ), and the width of the outermost ring (
 ). (b) The cross-sectional diagram (across the AA′ dashed line in (c)) showing a typical SFAT based on a PZT substrate with patterned Fresnel annular-rings electrodes. This illustration highlights how the Fresnel acoustic lens focuses ultrasound in the medium by selectively letting constructively interfering acoustic waves arrive at the focal point in-phase. (c) The top-view illustration of the same SFAT, showing the patterned top electrode and solder pad. Top-view photos of (d) a fabricated SFAT for neuromodulation, (e) the bottom side of the SFAT with 0.5 mm thick polyester sheet attached, and (f) an SFAT placed in a patch-clamp setup with IR light illuminated from the bottom to show the translucent characteristic of the 127 µm thick PZT.
Download figure:
Standard image High-resolution imagewhere  and λ are focal length and wavelength, respectively.
Focal size, defined as the full width at half maximum of the acoustic pressure, created by the Fresnel annular-ring lens is approximately equal to the width of the outermost ring ( ) [35] and is:

where c, F, n and f are the sound velocity in the medium, focal length, number of rings in the Fresnel lens, and the operating frequency, respectively [36].
The design of FHWB rings can be made with a ‘positive source’ having a circular electrode in the center or a ‘negative source’ with no electrode in the center. For the patch clamp experiments, the negative source is used to allow light to pass through the SFAT center where there is no opaque electrode. The focal length is designed to be 400 µm according to the thickness of a rat brain tissue prepared for the patch-clamp experiment. As the focal depth, defined as the vertical resolution of the focal zone (figure 1(a)), is approximately twice the lateral focal size in the SFAT design [36], the effective focal zone of the 400 µm focal length design in the vertical direction is estimated to be around 350–450 µm. This ensures that the ultrasonic waves can be focused near the top surface of the patched tissue, where the neuron cells are patched. The wavelength of the acoustic wave of 18.4 MHz in the brain tissue, where the speed of sound is approximately 1540 m s−1 [37], is about 84 µm. The transducer is designed to have 15 constructive Fresnel rings for a focal size of around 46 µm (equation (2)), resulting in the largest ring diameter of about 3.1 mm (figure 1(d)). The focal zone is aligned at the center of the SFAT in a lateral dimension, with the central opening (through which IR light passes) measuring 187 µm in diameter (figures 1(c) and (f)). This configuration ensures that the only neurons located within the central opening are clearly visible during patch-clamp experiments, allowing precise targeting of neurons within the focal size of 46 µm laterally, with the reduced risk of missing the target. Additionally, a 0.5 mm-thick polyester sheet is attached to the bottom of the SFAT to provide enhanced support and mechanical robustness during the experiments (figure 1(e)), followed by coating the surface with 28 µm thick Parylene D as the acoustic matching and electrical insulation layer. figure 1(f) shows the translucent characteristic of SFAT when exposed to IR light emitted from the bottom of the transducer.
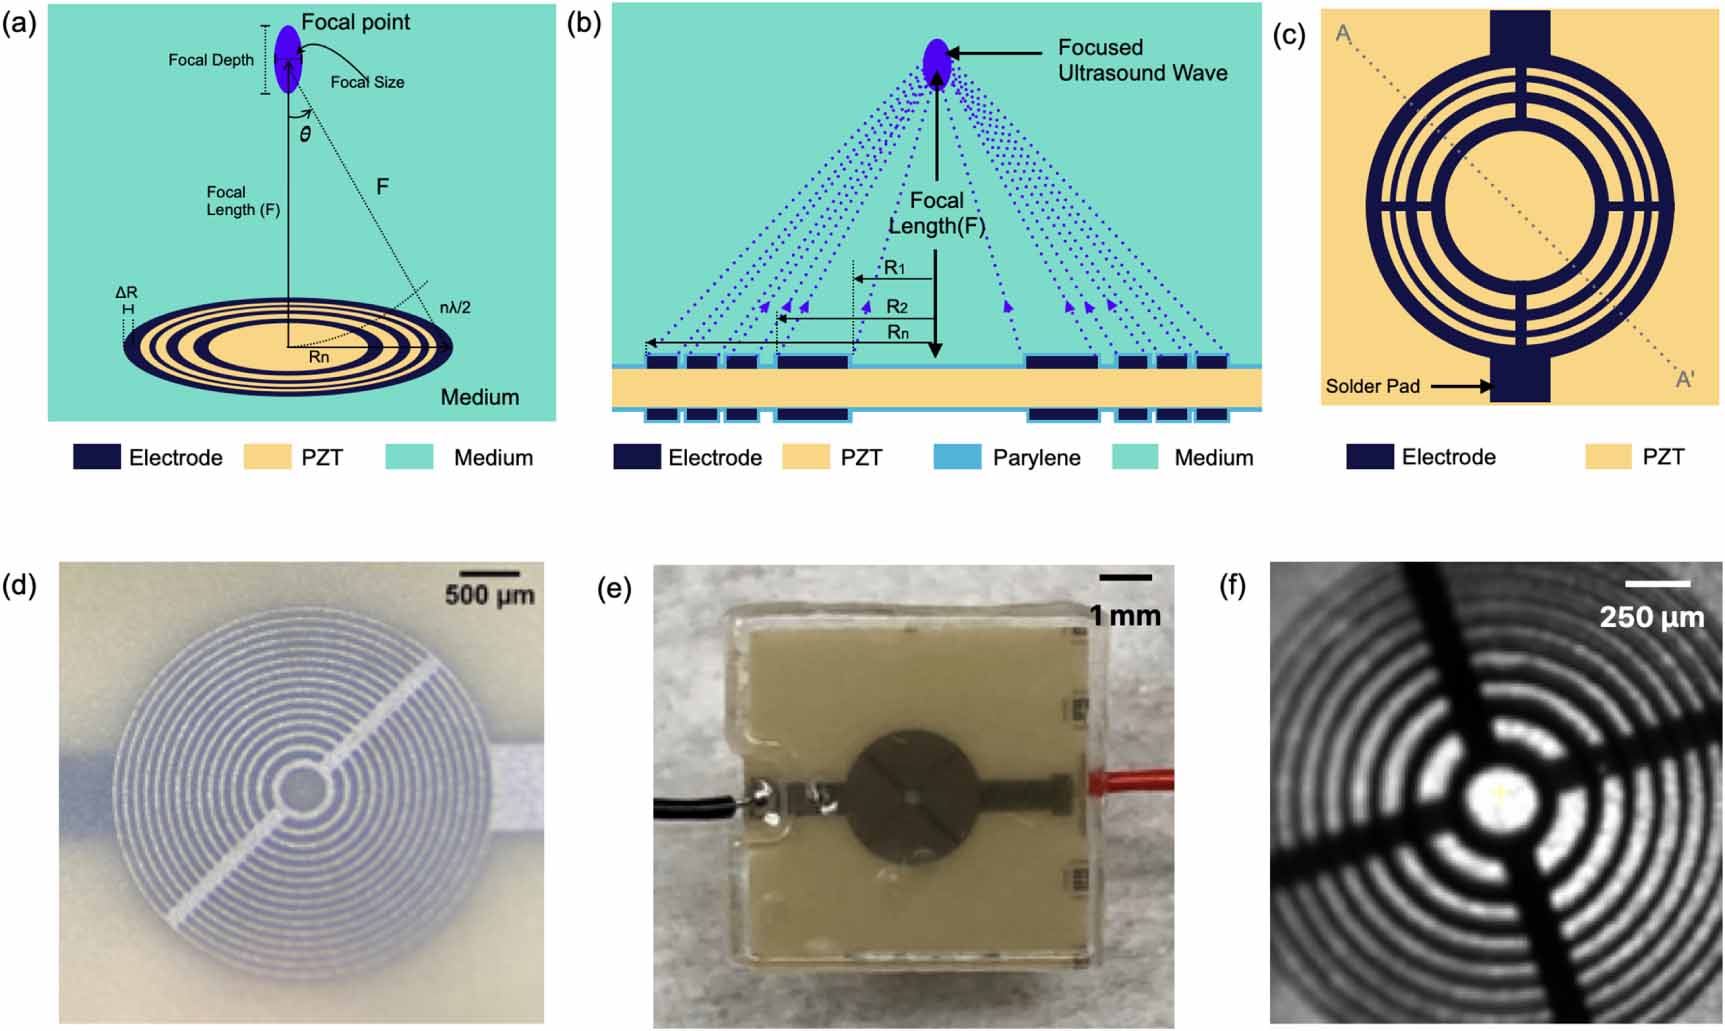
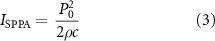
2.2. Simulation and measurement of SFATThe distribution of acoustic pressure generated by an SFAT is simulated with finite-element analysis (FEA) [38] in the frequency domain using the Pressure Acoustics module of COMSOL Multiphysics 5.6 (COMSOL Inc.). The simulation is modeled with a two-dimensional axial symmetry to significantly reduce the computation time and memory, as SFAT has a symmetrical design. This approach allows modeling only half of the volume cross-section and the complete simulation results can be reconstructed by mirroring the simulated data along the central vertical axis (R = 0). For simplicity, only the volume of the medium above the transducer top surface where the actual acoustic waves propagate is considered. The vibration of the piezoelectric sheet is modeled as a normal displacement boundary condition applied only to the Fresnel annular-ring electrode areas. The simulation employs a free triangular mesh, with the maximum element size set to be  with λ being the wavelength of the acoustic wave [39]. Additionally, the propagating medium is assumed to be isotropic and homogeneous, and spherical wave radiation boundary conditions are applied at the outer boundaries of the simulation volume, where acoustic waves can pass through without reflection. Figure 2(a) shows the FEA simulation of the normalized acoustic pressure distribution in brain tissue, indicating the focal length, the focal size, and the focal depth of 390, 46, 95 µm, respectively.
Figure 2. (a) Finite element analysis (FEA) of the normalized acoustic pressure distribution of the 15-ring SFAT at 18.4 MHz with a designed focal length of 400 µm in the brain tissue media. The simulation result shows a focal size of 46 µm and a focal depth of 95 µm. (b)–(e) FEM simulations and measurements of the normalized acoustic pressure on the z = 5 plane and on the vertical plane. (f) Illustration of the hydrophone measurement setup in the scanning tank.
Download figure:
Standard image High-resolution imageThe acoustic pressure generated by the fabricated SFAT is measured using a needle hydrophone (HNP0200, Onda Corp.) with a tip diameter of 200 µm in the scanning tank system (AIM III, Onda Corp.). To prevent the hydrophone measurement from being dominated by electromagnetic interference (EMI) when the hydrophone is too close to the transducer, the same SFAT with a longer focal length of 5 mm is fabricated and compared with the simulation result (figures 2(b)–(e)). A sinusoidal signal of 18.4 MHz is periodically delivered to the SFAT, consisting of only three cycles per pulse, at a PRF of 1 kHz during the hydrophone measurement to minimize the effect of EMI. The hydrophone is connected to a 20 dB pre-amplifier (AH-2010, Onda Corp.) and is securely fixed to a three-axis precision moveable stage. The SFAT is attached to a two-rotational-axis stage to align the beam axis between the hydrophone and the SFAT center (figure 2(f)). The acoustic signals picked up by the hydrophone are visualized with a digital oscilloscope (Picoscope 5000, Pico Technology Inc.), and the root-means-square voltage is converted into the peak acoustic pressure. The measured peak acoustic pressure, P0, at the focal point is used for calculating the spatial peak pulsed average acoustic intensity,  [40],
[40],
where  and
and  are the density of the medium and the speed of sound in the medium, respectively. By multiplying ISPPA with a PRF over the pulse duration, the Spatial Peak Time Average acoustic intensity, ISPTA, is calculated:
The measurement results with 40Vpp applied to SFAT match the simulation results, and the SFAT is estimated to generate an intensity of 0.16 MPa at the focal point when actuated with 40Vpp.
With the use of a 200 µm-diameter needle hydrophone, larger than the transducer’s focal diameter of 46 µm, the acoustic pressure measurements are subject to spatial averaging effects. As a result, the reported intensities reflect the spatial average pulse average (ISAPA) and the spatial average time average (ISATA) rather than the spatial peak pulse average (ISPPA) and the spatial peak time average (ISPTA). Thus, ISAPA and ISATA are used throughout the paper to describe the FUS parameters.
2.3. Low-EMI SFATAcoustic transducers not only generate acoustic waves but also emit EMI energy into the surrounding medium. While this EMI is generally not problematic for most applications, it can pose an issue when recording electrical signals from neurons immersed in the same medium and positioned above the SFAT. Given that the amplitude of the AP generated by neurons is approximately 100 mV, it is crucial to control and minimize the EMI induced by SFAT to prevent it from overwhelming the AP signals. Typically, tissues act as EMI absorbers, absorbing EMI much more effectively than water [41].
When the size of brain tissue is large, it effectively absorbs most of the EMI. However, in the case of a smaller tissue size, typically prepared from a young mouse, the tissue may not absorb enough EMI, leading to the dominance of EMI in the electrical recording. To tackle the EMI issue, a low-EMI SFAT is developed by depositing an additional metal layer on top of the SFAT. Any metal serves as an effective EMI shielding material to block EMI generated from the transducer since electromagnetic waves propagating through metal attenuate very rapidly, as the amplitude A of EMI at traveling inside a metal can be expressed as

where  , and
, and  are the initial amplitude, traveling distance, and skin depth of the metal, respectively. The amplitude of EMI is reduced to approximately 37% at the traveling distance of the skin depth, which can be obtained from
where  and
and  are the resistivity, relative permeability of the metal, permeability of vacuum (
 ), and angular frequency (
 ), respectively. Aluminum (Al), Copper (Cu), and Nickel (Ni) are commonly used for EMI shielding [42], and their material properties along with skin depths at a frequency of 18.4 MHz are listed in table 1.
Table 1. Material properties and skin depths of aluminum, copper, and nickel.
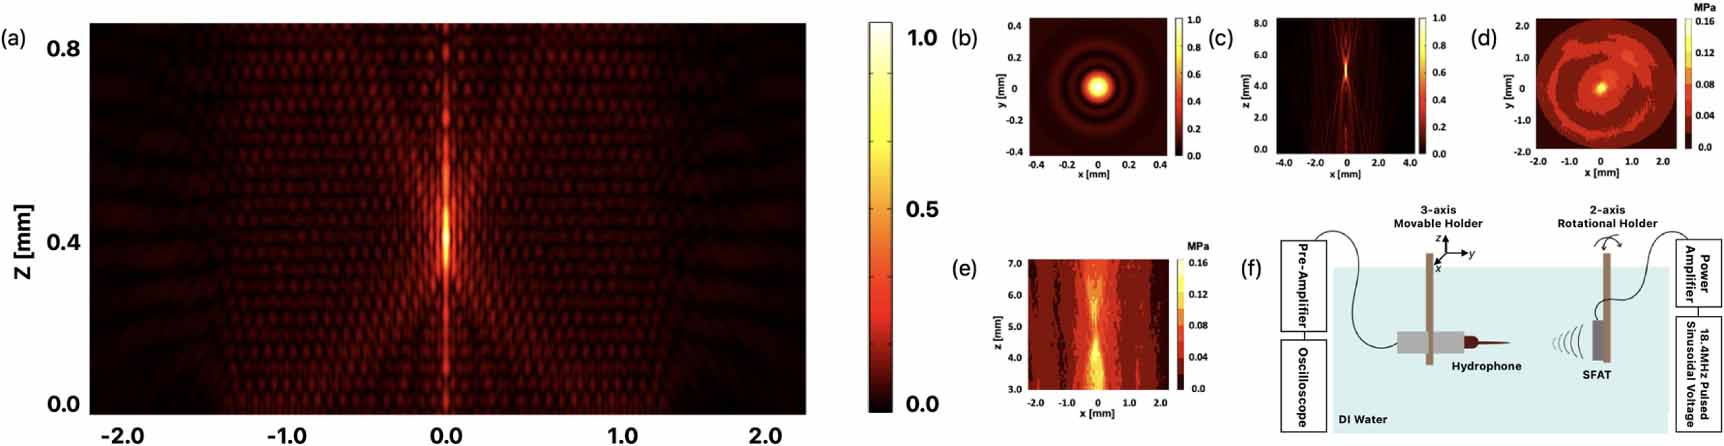
MetalsAluminumCopperNickelResistivity (µΩ cm)2.651.686.84Relative permeability1.000.99600Skin depth (µm)19.1215.201.25Nickel is selected as the EMI shielding metal for its low skin depth due to its high permeability. A 1.25 µm thick Nickel layer is deposited on top of the SFAT with 100 nm thick Titanium (Ti) layer acting as an adhesion layer. Before the deposition, a thermal release tape (Semiconductor Equipment Crop.), shaped in a circle with a 1.5 mm diameter, is manually placed at the center of SFAT (figures 3(a) and (b)). This serves as a mask to protect the central area in order to preserve the translucency of SFAT, when the thermal release tape is released by elevating the temperature to 90 °C in the oven.
Figure 3. Photos of (a) the fabricated low-EMI SFAT and (b) the microscopic image validating the translucency of low-EMI SFAT. (c) The cross-sectional diagram ((across the AA′ dashed line in (a))) of the low-EMI SFAT. Photos of (d) an air-cavity reflector made from three pieces of laser-machined acrylic sheets and (e) a FUS-blocking control SFAT with the air-cavity reflector attached, and insulated through Parylene coating. (f) The cross-sectional diagram ((across the AA′ dashed line in (e))) of the FUS-blocking control SFAT with an air-cavity reflector.
Download figure:
Standard image High-resolution image 2.4. FUS-blocking control SFATAs an SFAT also gets heated due to dielectric and I2R heating (during patch-clamp experiments) which is a potential modulatory source of neuronal activity, a FUS-blocking control device is designed and fabricated with identical ring patterns (15 rings and a 400 µm focal length) and operating frequency (18.4 MHz). To block the acoustic wave for a FUS-blocking control device, an air-cavity reflector (made with laser machining and composed of three stacked acrylic sheets, each 127 µm thick) is added to the top of SFAT. The air-cavity reflector uses the high reflection coefficient (99%) between air and any solid material, due to the large acoustic impedance difference between air (0.4MRayl) and solid (over 1MRayl) [43], so that no acoustic wave may pass through it. The combined thickness of the acrylic sheets results in an air-cavity with about 390 µm air gap (figure 3(d)). These acrylic sheets are attached to the SFAT with super glue and sealed with an additional layer of 20 μm thick Parylene (figure 3(e)).
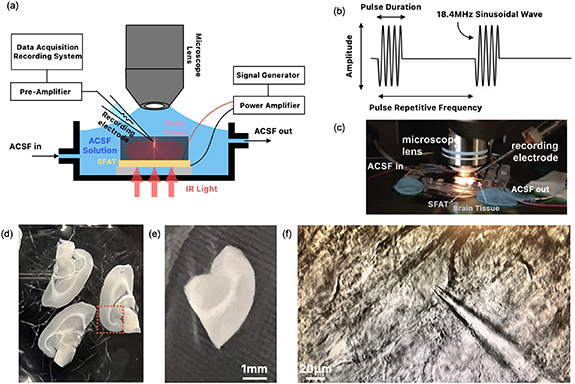
3.1. Whole-cell patch clamp experiment designThe whole-cell patch clamp technique allows recording of the electrical activity of individual neurons (or cells) [44], and is carried out with FUS produced by an SFAT in a setup illustrated in figure 4.
Figure 4. (a) Conceptual diagram of the patch clamp experimental setup, overlaying the focused ultrasound simulation on the tissue diagram and (b) pulsed operation of SFAT with the definition of the number of cycles, pulse duration, pulse repetitive frequency (PRF), and operating frequency. Photos of (a) the whole-cell patch clamp experiment setup with an SFAT, (d) acute slices from 3–4 weeks old Sprague Dawley rat, (e) hippocampus (red box in (d)) region of the slice, and (f) a photo of the patched neuron with the micropipette on the hippocampus tissue over the SFAT through which the light passes through and illuminates the tissue.
Download figure:
Standard image High-resolution imageAn SFAT is placed at the bottom of a transparent chamber with a continuous flow of artificial cerebrospinal fluid (ACSF) at a rate of 2–3 ml min−1, while the rat brain slice is positioned on top of the SFAT (figure 4(c)), with the light illumination from under the SFAT. The hippocampal brain slices (350–400 µm in thickness, approximately 5 × 5 mm2 in size) are prepared from Sprague Dawley rat (without sex-specific selection, 3–4 weeks old, and 250–300 g body weight) and transferred into a pre-chamber filled with ACSF (aerated with 95% O2/5% CO2) composed of 124 NaCl, 2.5 KCl, 1.25 KH2PO4, 1 MgSO4, 2 CaCl2, 26 NaHCO3, and 11 D-glucose, with all the numbers in mM. Then the slices are incubated in ACSF at 35 °C for the first 15 min and kept in ACSF at room temperature for at least 1 h before recording the neuronal activity.
For a whole-cell patch clamp, a borosilicate glass capillary tube is pulled with a horizontal puller (P-1000, Sutter Instrument) to create a micropipette. Inside the micropipette, the patch pipette solution is filled with 125 K-gluconate, 10 KCl, 10 HEPES, 1 EGTA, 2 MgCl2, 0.1 CaCl2, and 4 ATP-Na2. During experiments, to record the neuronal activities, the micropipette tip is attached to a neuron in the CA1 region of hippocampus. The recording electrode inside the micropipette is connected to the preamplifier and the recording acquisition system (MultiClamp 700B Microelectrode Amplifier from Molecular Devices) with a sampling rate of 10 kHz. The SFAT is driven with pulsed sinusoidal signals generated by a function generator (AFG-3252, Tektronix Inc.) and amplified by a power amplifier (75A250, Amplifier Research Corp.).
3.2. FUS stimulation parameters designAn SFAT delivers a series of pulsed acoustic waves to the target neuron located at the focal length with precise control over the timing and reduced heat generation, compared to continuous acoustic stimulation. The first key parameter is the peak-to-peak voltage, which is related to the acoustic intensity. For this, three values are chosen for the low, mid, and high voltage ranges: 40, 60, and 120Vpp, with corresponding ISAPA values being 0.44, 2.11, and 8.44 W cm−2, respectively.
The other two key parameters are the PRF and the number of cycles per pulse. During transducer operation, a series of acoustic pulses can be characterized by the PRF, as illustrated in figure 4(b), along with the number of cycles per pulse which depends on the pulse duration (PD) as well as the period (Ts) and frequency (fs) of the sinusoidal waves:

In our experiments, various PRFs are tested, ranging from 1 Hz to 200 Hz, with the number of cycles per pulse varying between 5 k and 65 k cycles per pulse. Using equation (4), ISPTA values are computed to span from 1 to 1031 mW cm−2. The ultrasound stimulation parameters are mostly within the FDA safety guidelines for ultrasound in biomedical application (ISPPA <190 W cm−2 and ISPTA <720 mW cm−2) [45], although current FDA approval applies mostly to ablative procedures like pallidotomy, not neuromodulation. A higher peak-to-peak voltage results in more heat generation from SFAT, posing a risk of damage to either the transducer or the nearby tissue. The limit of the driving voltage is also influenced by the number of cycles per pulse and PRF, as mechanical stress and heat on and from SFAT accumulate over the pulse duration. Table 2 presents examples of key ultrasound parameters used in the patch-clamp experiments. These experiments, with systematically varied parameters, are meticulously designed to assess the effects of different ISAPA,ISATA, PD, and PRF. For example, the first three parameter sweeps in table 2 evaluate the impact of PD while maintaining a constant PRF. In particular, the number of cycles per pulse is varied and selected among 5000, 10 000, 15 000, 25 000, 50 000, and 65 000 with a fixed ISAPA of 0.94 W cm−2 and PRF of 20 Hz. On the other hand, the last three rows are designed to examine the effect of PRF while keeping the PD consistent. Similarly, FUS stimulation with an ISAPA of 8.44 W cm−2 and a fixed PD of 45 000 cycles per pulse varies its PRF across 5, 10, 15, 20, 25, and 50 Hz. Distinct experimental conditions include variations in ultrasound parameters, cell identity, and device type (active or FUS-blocking device).
Table 2. Examples of ultrasound parameters used in the FUS patch clamp experiment.
Peak to peak voltage amplitude (Vpp)Spatial average Pulsed average acoustic intensity, (W cm−2)Spatial average Pulsed average acoustic intensity,
  (kPa)Pulse repetitive frequency (Hz)Number of cycles per pulseDuty cycle (%)Spatial average time average acoustic intensity,
  (mW cm−2)400.94160205000–65 0000.54–7.075.09–66.22602.11262205000–65 0000.54–7.0713.45–174.861208.44524205000 −65 0000.54–7.0742.10–547.36400.9416033030 00050.80504.30602.1126212030 00019.56499.251208.445244030 0006.52505.25400.9416010–20045 0002.45–48.9122.92–458.45602.112625–20045 0001.22–48.9125.78–1031.521208.445245–5045 0001.22–12.2394.74–947.35
The FUS stimulation with varying parameters is applied to the patched neuron for 30 s, followed by a 2 min resting period that allows cells to recover from any potential thermal effects induced by the ultrasound. Each patched cell typically receives multiple ultrasound stimulations until patch integrity is lost or the cell is damaged. The experiments have been systematically conducted with varied ultrasound parameters on the different cells and different devices, as shown in table 2, culminating in a comprehensive dataset across 323 distinct experimental configurations. Out of a total of 323 experiments, FUS is delivered with the active devices in 281 experiments, while the FUS-blocking control devices are used in the remaining 42 experiments. Patch clamp recordings are performed on 78 distinct tissue slices obtained from 29 animals (both male and female). A total of 39 different FUS pulse parameter sets are applied, while multiple FUS stimulations are delivered to the same neuron until the patch seal is lost, resulting in some neurons receiving multiple stimuli and others only a single stimulus. The maximum number of FUS stimuli applied to a single neuron is 15, with a resting period of 2 min between stimuli.
In some cases, a small positive or negative current is injected into the cell to adjust the baseline membrane potential. For example, when assessing the effect of FUS on neurons with a low resting membrane potential (without spontaneous APs), a positive current is injected to depolarize the baseline membrane potential, allowing a clearer comparison of the number of APs before, during, and after FUS stimulation. Conversely, in neurons with a high baseline membrane potential that shows bursting spikes, applying a negative current inhibits the bursting spikes and stabilizes the neuronal firing pattern, facilitating analysis of the FUS effect. The amount of the injected current is maintained to be no more than ±40 pA to prevent the neuron from responding to the electrical stimulation.
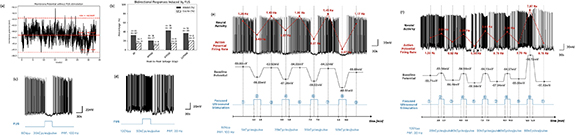
4.1. Neuromodulation effect of FUSThough evidence of the inhibitory effect by FUS neural stimulation has been more prevalent [9, 25], recent studies indicate that FUS can modulate the firing rate of the APs in both directions when its PRF and the pulse duration are tuned [28–31]. We have carried out a number of experiments with various PRFs and cycle numbers per pulse to find the optimal parameters that inhibit or excite the neuronal activities. The classification of neuronal activity as either inhibition or excitation is based on changes in the baseline membrane potential. Specifically, a depolarization exceeding 2% during FUS stimulation is considered indicative of excitation, while hyperpolarization greater than 2% signifies inhibition. Experiments with baseline membrane potential changes within ±2% are classified as ‘no response’ to FUS. The criterion is determined by recording the membrane potential in the absence of FUS stimulation for 30 s (figure 5(a)) and subsequently calculating the mean and standard deviation (σ). A threshold of ±2% relative to the mean is set, corresponding to approximately 3σ, which encompasses 99.7% of the data under the assumption that neuronal activity without stimulation follows a normal distribution, shown in figure 5(a).
Figure 5. (a) The membrane potential with the absence of focused ultrasound stimulation, showing the mean and ±2% or ±3 sigma(σ) range (b) the inhibition and excitation rates (in percentage) induced by FUS across the different voltage levels applied to the SFAT, regardless of the FUS pulsing parameters such as PRF and pulse duration. n and m represent the number of animals and the tissues used in the patch clamp experiments, respectively. (c)–(f) The recorded action potentials (black) along with the activation of focused ultrasound stimulation (blue). (c) A sample inhibition effect of the FUS with the parameters set at 60Vpp (ISAPA = 2.11 W cm−2), 35 kCycles/pulse (PD = 1.90 ms) and a PRF of 100 Hz (which results in 60% yield of successful inhibition). (d) A sample excitation effect of the FUS with the parameters set at 120Vpp (ISAPA = 8.44 W cm−2), 50 kCycles/pulse (PD = 2.72 ms) and a varied PRF of 20 Hz (which results in 60% yield of successful excitation). Series of (e) the inhibition and (f) the excitation effects with 30 s of FUS, followed by 2 min of resting period.
Download figure:
Comments (0)