Animals and treatments
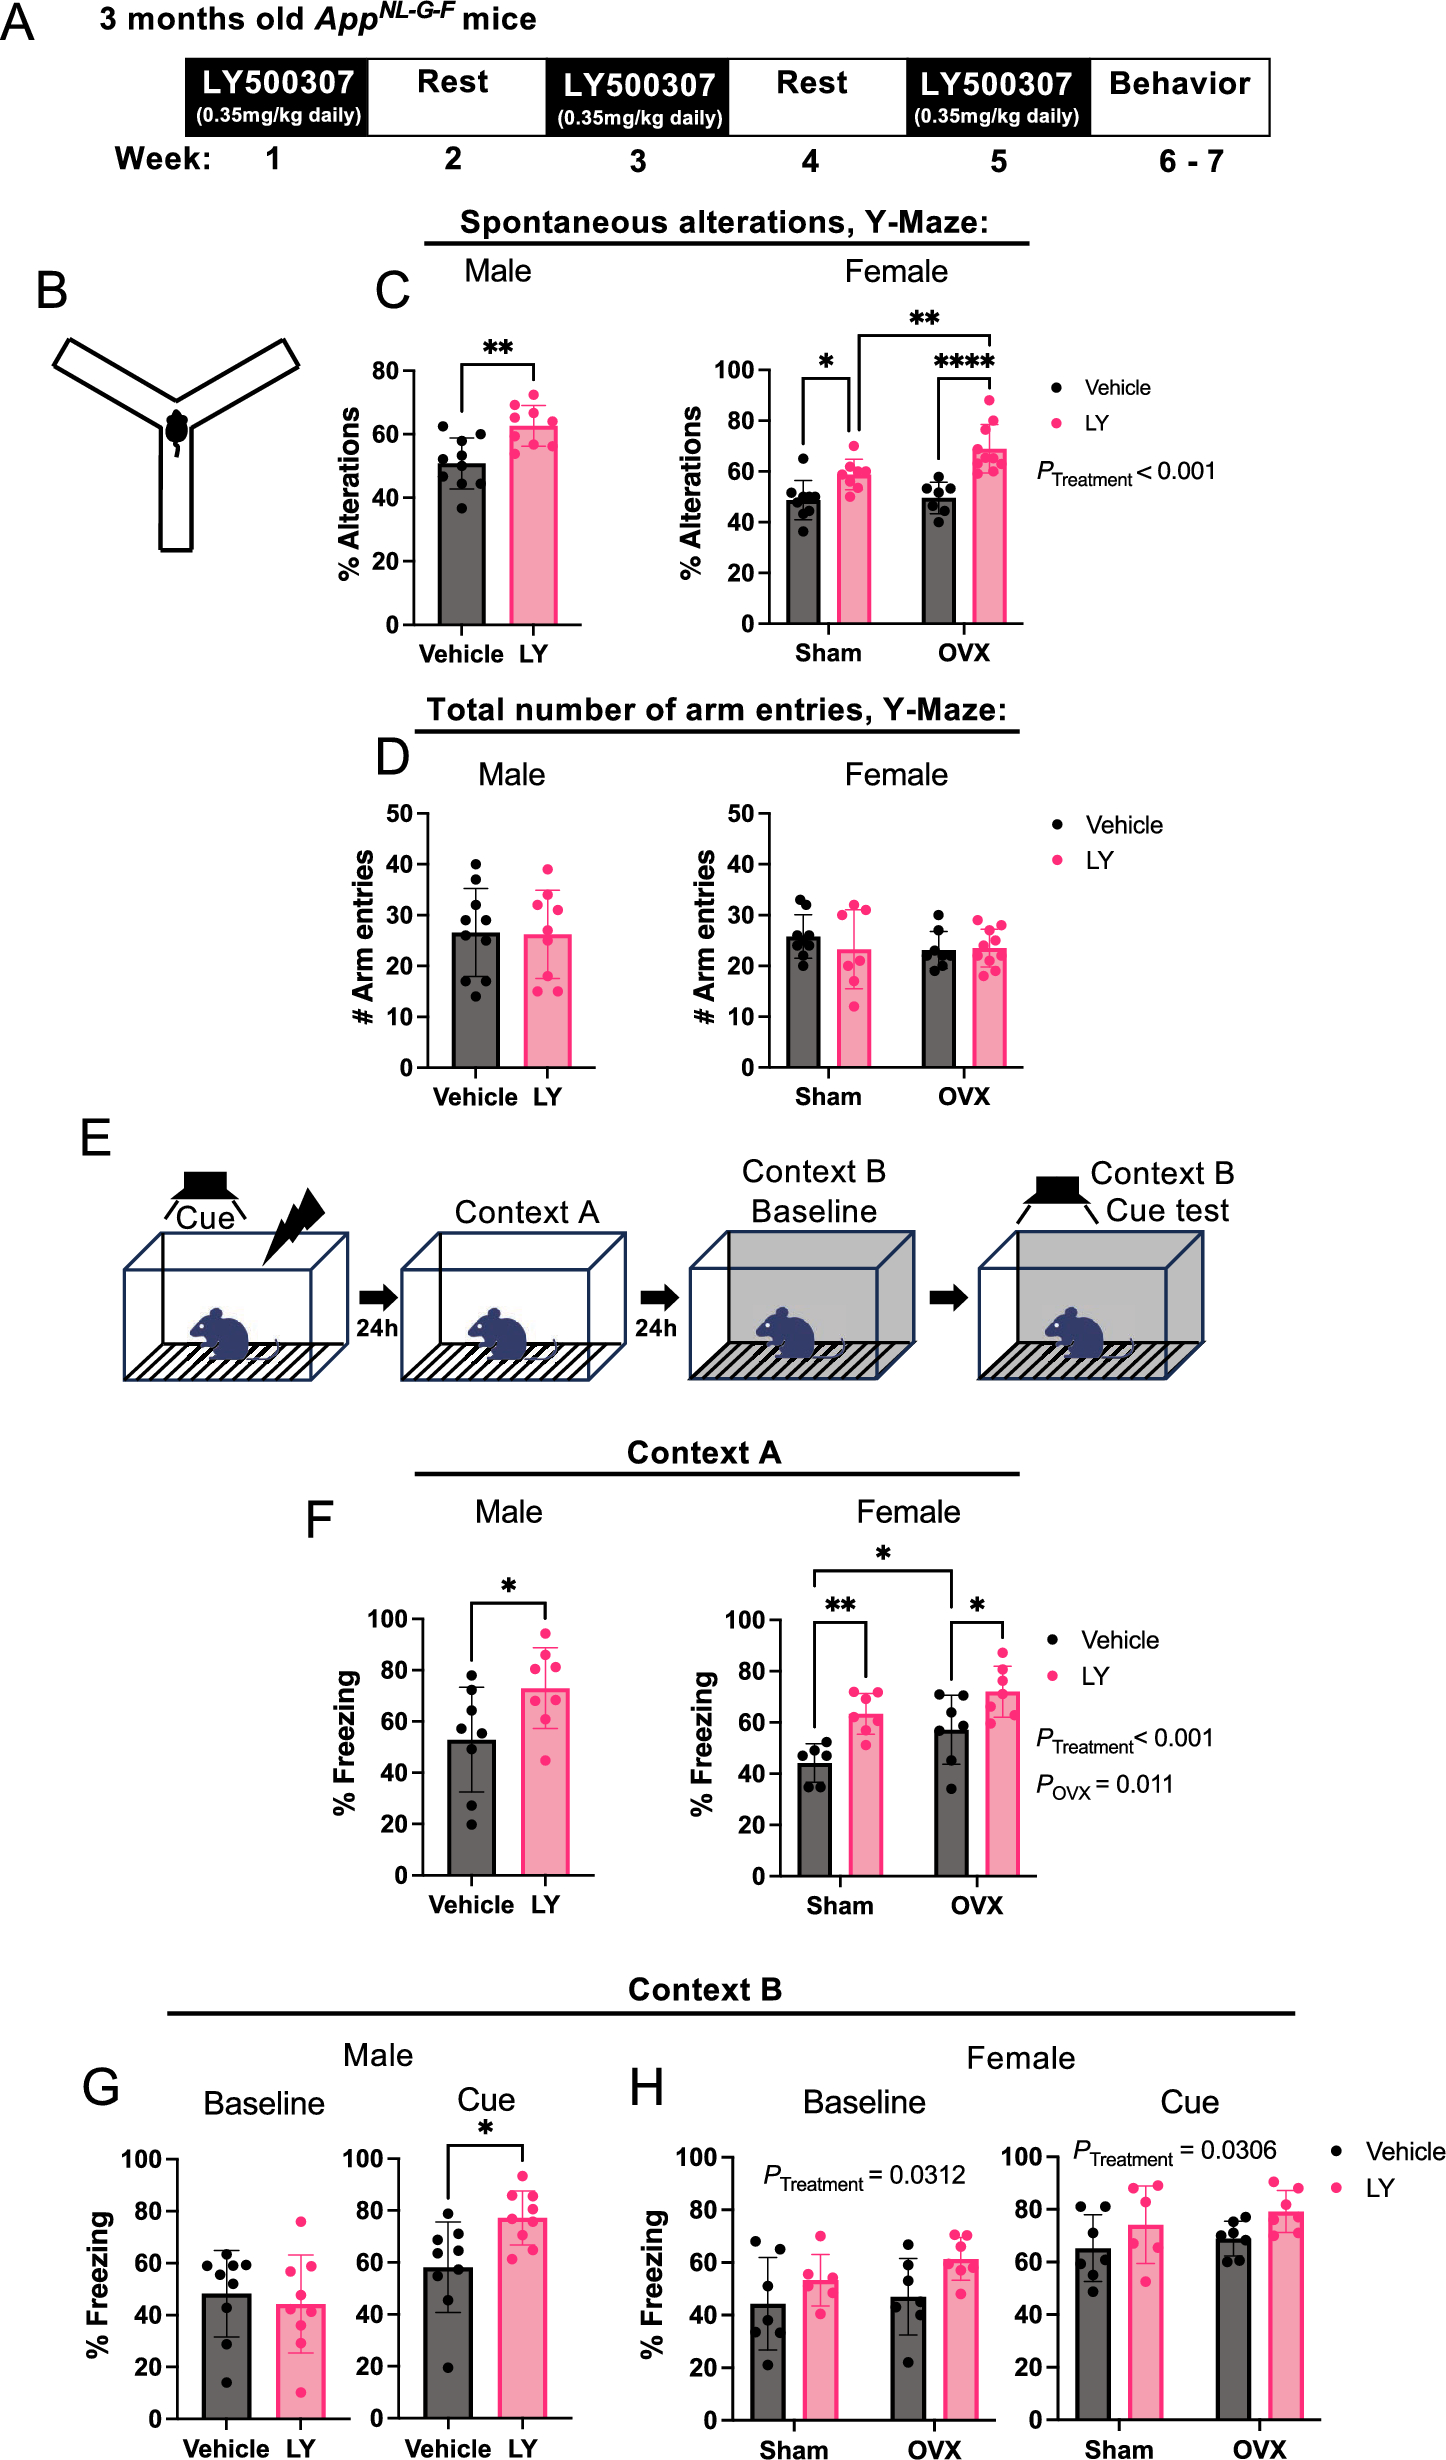
Male and female APPNL−G−F knock-in mice (carrying the Swedish [NL], Arctic [G] and Iberian [F] mutations in the humanized Aβ peptide [13]) were obtained from local breeding using the C57/BL6 J strain background. At 2.5 months of age, female mice were selected randomly for bilateral ovariectomy or sham surgery. Similarly, at 3 months of age male and female mice were randomly selected for LY500307 (0.35 mg/kg/day, Santa Cruz Biotechnology, Dallas, TX, USA), dissolved in vehicle solution (40% Captisol, [Cydex pharmaceuticals, Lawrence, KS, USA], 1% ethanol, and 59% 0.1 M PBS), or vehicle treatment (vehicle solution) through oral gavage administration. The treatment regimen was daily delivery over 7 days, followed by 7 days of rest. The resting period was included to avoid hormone-induced downregulation of ERβ gene expression [16]. This was repeated twice after which animals were subjected to behavior studies [2 days after last treatment and 2 days of rest between tests] and sacrificed at 5 months of age. For brain dissection, animals were deeply anesthetized with isoflurane followed by intracardial ice-cold 0.1 M PBS perfusion. Half brain was fixed in cold 4% paraformaldehyde and the hippocampus and cerebral cortex of the other half were snap-frozen for biochemical assays. All procedures were performed in accordance with approved ethical permits (ethical approval ID 407 and ID 2199–2021, Linköping’s animal ethical board).
Behavioral testsContextual cued fear conditioning
A conditioning semi-transparent plexiglass chamber of 17 × 17x25 cm (l x w x h) with a stainless-steel grid floor (grid spaced 0.5 cm apart, Ugo Basile, Gemonio, Italy) surrounded by sound-attenuating grey chest was used for training and conditioning tests under a constant light (50 Lux) and background white noise (77 db). The chest was fitted with a light-sensitive camera over the chamber. The chamber was cleaned with 70% ethanol before each individual mouse test. The contextual fear conditioning test was performed over a span of 3 days, as previously described [17]. Briefly, on the conditioning day, mice were individually and randomly placed in the chamber and allowed to explore for 2 min before the onset of the conditional stimuli in the form of two sound exposures (65 db, 2000 Hz) 1 min apart lasting for 30 s each. During the last 2 s of each conditioning stimulus, the mice received a mild electric foot shock (0.5 mA). The conditioning ended 1 min after the last shock. The next day, the mice were subjected to the contextual test where they were placed back in the same chamber (context A) for 3 min but were not subjected to any sound stimuli or foot shock. On the third day, the mice were subjected to the cued test in which they were placed back in the chamber that had been fitted with different environment (checkered wall patterns and white bottom, context B). The mice were free to explore the chamber for 2 min (baseline) before the onset of the sound stimuli (cue tone, 65 db, 2000 Hz) for the rest 2 min without any foot shock (cue test). Mouse movement was traced by a computer-based video tracking system (ANY-Maze 6.3 software, Stoelting, Dublin, Ireland). The freezing response was defined as the percentage of time a mouse remained motionless (divided into 30 s intervals).
Y-maze
Hippocampal-dependent spatial working memory and reference memory were analyzed using the standard Y-maze test. The Y-maze consisted of 3 arms (35 × 7 × 15 cm, made of non-reflective gray plastic, Noldus Wageningen, Netherlands) at 120° angle to each other. A random mouse from each test group was placed in the center of the maze, and the 5 min trial started when the experimenter was out of the room of the maze to allow uninterrupted movement of the animal. Both manual and automated recording (using EthoVision XT, Noldus, Wageningen, Netherlands) of number of entries into each arm was used to calculate the percent spontaneous alterations. Alternations were considered completed when a mouse performed successive entries into three different arms. The threshold for number of arm visits for data to be included was set to 10, and threshold for considering an arm visit was set to when at least half the mouse (excluding the tail) crossed the arm entry border. Percentage alternations were calculated as [total alterations/(# arm entries – 2)]. The Y-maze was cleaned with 70% ethanol before each individual mouse test.
Immunohistochemical and histochemical analyses
4 µm thick paraffin-embedded sagittal mouse brain sections were fixed on glass slides, hydrated, followed by heat-induced antigen retrieval in a pressure steamer at 121 °C for 20 min, followed by 15 min permeabilization with 0.5% Triton-X 100 (Millipore, Burlington, MA, USA) and blocking using 10% Horse Serum (ThermoFisher Scientific, Waltham, MA, USA), 0.1% Tween-20 (Millipore) in 0.1 M PBS for 1 h at 37 °C. Following blocking the slides were immunostained over-night at 4 °C with antibodies specific to Aβ (1:2000 dilution, 82E1, IBL-Tecan, Männedorf, Switzerland), Iba1 (1:300, ab178846; and 1:300 ab225260, both from Abcam, Cambridge, UK), GFAP (1:300, GA5 Alexa Fluor488-labeled, Millipore), CD68 (1:300, Ab283654, Abcam), and/or ERβ (1:5000, PP-PPZ0506-00, R&D Systems, Minneapolis, MN, USA) (Supplemental Table 1). For antibodies raised in mice, we used 1 × mouse-on-mouse IgG blocking solution (ThermoFisher Scientific) prior to antibody incubation. Secondary antibodies were Alexa Fluor488, Alexa Fluor568 (both from ThemoFisher Scientific). To reduce autofluorescence, the sections were incubated in 1 mM CuSO4 diluted in 50 mM ammonium acetate for 15 min. Nuclear staining was with 300 nM DAPI (ThermoFischer Scientific) for 10 min, prior to mounting. To visualize amyloid plaques, we used 1 × AmyloGlo stain (Biosensis, Thebarton, Australia) supplemented to the secondary antibody solution. ABC-HRP kit and Impact-DAB (both from Vector Laboratories, Newark, CA, USA) were used for immunohistochemical staining according to manufacturer’s recommendations. Immunofluorescence images were captured using an AxioPlan-2 fluorescent microscope (Carl Zeiss, Oberkochen, Germany) and the Zeiss AxioVision 4.0 software (Carl Zeiss). Image analysis was performed on at least 3 sections per mouse using the ImageJ software (NIH, Bethesda, MD, USA) and setting image threshold and counting was as described previously [18]. For each acquired image, the image lookup table (LUT) was kept linear and covered the whole image data. Association of microglia to plaques were quantified by counting number of microglia within 20 µm radius of plaque edge.
Aβ and cytokine profile immunoassays
Frozen cortical and hippocampal tissues were thawed and homogenized in ice-cold TBS buffer (50 mM Tris–HCl, pH 7.6, 150 mM NaCl, and protease inhibitor cocktail (Roche, Basel, Switzerland)). The homogenates were centrifuged at 24 000 × g for 45 min at + 4 °C, yielding a soluble fraction (supernatant) and an insoluble fraction (pellet). The pellets were solubilized by resuspension in 6 M Guanidine-HCl and sonication using a water-bath sonicator (Bioruptor, 5 min max output (Diagenode, Denville, NJ, USA)). Soluble pellets were centrifuged at 24 000 × g for 45 min at + 4 °C and the supernatant (defined as insoluble fraction) was diluted in TBS to yield 0.5 M Guanidine-HCl. Similarly, Guanidine-HCl was added to the soluble fractions to yield a concentration of 0.5 M Guanidine-HCl. Total protein concentration was determined using the BCA Protein Assay (ThermoFisher Scientific) or the Coomassie Protein Assay reagent (Sigma-Aldrich, St Louis, MO, USA). Quantification of Aβ1–40 and Aβ1–42 in soluble and insoluble fractions was performed using the EZHS-SET ELISA kit, following manufacturer’s instructions (Millipore) and read on a Tecan plate spectrophotometer. Proinflammatory cytokine profiling on soluble fractions were performed using the V-PLEX proinflammatory panel 1 (mouse) kit (Mesoscale Discovery, Rockville MD, USA) on soluble brain fractions according to manufacturer’s instructions. The kit allows multiplex quantification of IFN-γ, IL-1β, IL-2, IL-4, IL-5, IL-6, IL-10, CXCL1 (KC/GRO, keratinocyte-derived chemokine/growth-related oncogene), IL12p70, and TNF-α. Samples were read on the MESO QuickPlex SQ120 reader and data were analyzed using the Discovery Workbench 4.0 software (both from Mesoscale Discovery). The concentration of each cytokine in the tissue lysates was normalized with the total protein concentration of the respective sample.
Western blot
Cortical and hippocampal tissue were homogenized in ice-cold 4 × PIPES buffer pH 6.8 (40 mM Piperazine-1,4-bis(2-ethanesulfonic acid), 1.2 M Sucrose, 0.4 M NaCl, 27 mM MgCl2, and 1 × protease inhibitor cocktail, all from Sigma). Cell debris were pelleted and supernatants were centrifuged at 24 000 × g for 45 min at + 4 °C. The pellet was resuspended in a low volume of 4 × PIPIES buffer, and protein concentration was measured and adjusted to 2.5 mg/ml. 100 µg protein was incubated at 37 °C for 30 min followed by chloroform–methanol protein precipitation. In brief, 600 µl of cholorform:methanol in ratio 2:1 was added to the protein mixture and incubated for 30 min at room temperature (RT) under agitation followed by centrifugation and phase separation at 24,000×g for 15 min at RT. The intermediate was isolated, resuspended in 600 µl cholorform:methanol 1:2 and incubated for 60 min at RT under agitation. The protein was precipitated by centrifugation at 24,000×g for 15 min at RT, supernatant was removed, and pellet was let to dry. The protein pellet was resuspended in SDS-loading buffer to yield 3 mg/ml. In brief, 10–30 µg of protein were loaded on 4–20% gradient SDS-PAGE gels and proteins were transferred to a PVDF membrane. After blocking the membrane was subjected to antibody against Aβ1–16 (6E10, BioLegend), APP N-terminus (22 C11, Millipore), APP C-terminus (A8717, Sigma-Aldrich) and antibody against β-Actin (AC-15, Millipore). Detection was performed using ECL substrate (ThermoFisher) and exposure to light-sensitive films or CCD camera. Quantification of bands was performed using ImageJ software (NIH). All blots were processed in parallel.
Real-time quantitative PCR analysis
Total RNA from cells or tissue was extracted using the RNeasy plus mini kit, RNeasy plus micro kit or Allprep DNA/RNA kit (Qiagen) according to manufacturer’s instructions, and RNA concentrations and quality were determined with NanoDrop (ThermoFisher Scientific). Complementary DNA was synthesized using SuperScript IV VILO Master Mix cDNA synthesis kit (ThermoFisher Scientific). The qPCR reaction contained 5 or 10 ng of cDNA, exon-exon spanning primers (500 nM), and KAPA SYBR Fast qPCR master mix (Sigma-Aldrich) or using TaqMan assays (Supplemental Table 2) and TaqMan Fast Advanced Master Mix (Applied Biosystems) and was performed on an ABI 7500 fast thermal cycler (Applied Biosystems) according to manufacturer's instructions. Expression relative to housekeeping gene was calculated using the ΔCt method.
Statistical analysis
Results are expressed as means ± SD. The statistical analyses were performed using GraphPad Prism 9.02 software (GraphPad Software, San Diego, USA). Data were tested for equal variance by F-tests. Unpaired two-tailed Student’s t-tests were used to compare between two groups. Unless stated otherwise, multiple group analyses were performed by two-way or three-way analysis of variance (ANOVA), followed by uncorrected Fisher’s LSD test or corrected post-hoc tests for multiple comparisons as indicated in figure legends. Significance level was set at < 0.05 (*P < 0.05, **P < 0.01, ***P < 0.001, ****P < 0.0001). All analyses are based on at least 3 biological replicates.


Comments (0)