
Remember me
Radiochromic film (RCF) dosimeters are indispensable dosimeters for two-dimensional and small field dosimetry due to their high spatial resolution, water equivalent properties, and ease of use (Devic 2011, Das 2017, Mossahebi et al 2021). RCF dosimeters are conveniently used in established and emerging photon, electron, ion beam therapies, as well as brachy therapy dosimetry (Palmer et al 2013, Castriconi et al 2017, Chan et al 2017, Darafsheh et al 2020a, 2020b, Bertinetti et al 2024, Clements et al 2024). Since insignificant dose-rate dependency has been reported for RCFs, they are used as reliable dosimeters for ultra-high dose rate dosimetry as well (Jaccard et al 2017, Patriarca et al 2018, Darafsheh et al 2022, Romano et al 2022, Villoing et al 2022). Working principle of RCFs is based on a topochemical reaction, induced by the ionizing radiation, resulting in polymerization of their active layer that leads to visible coloration of the film (Soares 2007). The coloration is quantified by the optical density (OD) that is correlated to the dose through a calibration curve (Micke et al 2011, Lewis et al 2012, Devic et al 2016). Most commonly commercially available RCFs are known as GafChromicTM (Ashland Inc, Bridgewater, NJ, USA) films. Several models of GafChromicTM films exist to support applications involving various dose ranges. The main structural difference between these models is the size of the monomer nanocrystals in their active layer; the smaller they are, the less sensitive that model is. EBT-3 model with nominal dynamic range of 0.2–10 Gy is the most commonly used model for radiation therapy quality assurance (Mirza et al 2016, Darafsheh et al 2019, León-Marroquín et al 2019b, Duruer et al 2020). EBT-XD model has extended dynamic range (0.4–40 Gy) to cover stereotactic body radiation therapy dosimetry needs (Palmer et al 2015, Lewis and Chan 2016, Schoenfeld et al 2016, Khachonkham et al 2018, León-Marroquín et al 2019a). Less commonly used RCF models in radiation therapy are the MD-V3 and HD-V2 models with dynamic range of 1–100 Gy and 10–1000 Gy, respectively (Devic et al 2016, Yamada and Parker 2022).
The active layer is symmetrically sandwiched between 125 µm thick matte polyester layers in EBT3 and EBT-XD models (Devic et al 2016, Butson and Niroomand-Rad 2017). The MD-V3 and HD-V2 models, however, are not symmetric. In the MD-V3 model, while the active layer is sandwiched between two protective layers, there is an adhesive layer only on one side between the active layer and the corresponding protective layer (Butson and Niroomand-Rad 2017). The structure of the HD-V2 model is composed of the active layer coated over a 97 µm-thick clear polyester substrate (Devic et al 2016). The active layer has nominal thickness of 28 µm, 25 µm, 15 µm, and 8 µm in EBT3, EBT-XD, MD-V3, and HD-V2 models, respectively (Devic et al 2016). The EBT3, EBT-XD, and MD-V3 have the same overall thickness of ∼0.28 µm, whereas the overall thickness of the HD-V2 film is ∼0.11 µm. The constituent monomer crystals in the active layer have different sizes in these models enabling them to cover different dose ranges. The response of RCFs have found to be energy independent in megavoltage beams (León-Marroquín et al 2019a, 2019b). However, their response to kilovoltage beams may show energy dependency (Villarreal-Barajas and Khan 2014, Hammer et al 2017, Massillon-Jl et al 2019). The objective of this work is to investigate and compare the response of four different RCF models (EBT3, EBT-XD, MD-V3, and HD-V2) to a kilovoltage and a megavoltage x-ray beam. The orientation dependency of the films as well as their absorption spectra are studied in this work.
2.1. Film preparation and analysisEBT3 (Lot# 03232302), EBT-XD (Lot# 01292401), MD-V3 (Lot# 05292401), and HD-V2(Lot# 02042104) RCFs were cut in 5 cm × 5 cm pieces and marked in their corner to maintain orientation during pre-exposure and post-exposure scanning. The films were scanned in transmission mode using a flatbed scanner (Expression 10000XL, Epson Americana Inc., Long Beach, CA, USA) in TIFF format with RGB colors, 48 bit (16 bit per color channel), spatial resolution of 300 dpi, and all color corrections offered by the scanner's software turned off. Films were placed at the center of the scanner in a reproducible manner. Films were handled according to the manufacturer's and AAPM's TG-235 recommendations (Niroomand-Rad et al 2020). The exposed films were scanned 48 h after irradiation to minimize time-dependent response of the film.
MATLAB® (MathWorks, Natick, MA, USA) was used to obtain the pixel values, at each color channel, representing the transmitted light intensity. Each film sample was scanned 3 consecutive times and the average was calculated and used for data analysis. The OD of each film sample for each color channel was measured according to equation (1), in which  and
and  are the pixel value of the digital image in the absence and presence of the film in the scanner, respectively. An optically opaque paper sheet was scanned to obtain the 'dark' background reading pixel value at each color channel,
  . The Net OD was measured according to equation (2) by subtracting the OD of the non-irradiated film (
 from that of the same film after irradiation (
 ),
),


A calibration curve for the red and green color channels for each film model was established by fitting the Net OD data using equation (3) in which a, b, and n are fitting parameters,

In order to measure the film sensitivity for each model and color channel, curve fitting was performed according to equation (4) in which A, B, and m are fitting parameters. The sensitivity is obtained through taking derivative of equation (4) with respect to D,


Optical spectroscopy was performed using a VIS spectrometer (WP-VIS-R-S-100, Wasatch Photonics, Durham, NC) over 400–800 nm spectral range with 0.4 nm spectral resolution. A tungsten halogen lamp (DH-2000, Ocean Optics) was used as the light source. The light source was expanded over a circular area with 1.5 cm diameter at the center of each film sample and then coupled to the spectrometer using a set of lenses. The absorbance was measured using equation (6), in which  and
and  are the intensity of the light, at each wavelength, in the absence and presence of the film in the experimental setup, respectively.
  is the spectrometer reading when its entrance aperture is closed. The net absorbance (
 ) was measured according to equation (7) by subtracting the absorbance of the non-irradiated film (
 from that of the irradiated film (
 ),
),


In order to investigate orientation dependency of the films, an un-irradiated film sample from each model was scanned in 16 different orientations with respect to the scanner, as illustrated in figure 1. Same scanner setting as described earlier was applied.
Figure 1. (a)–(d) Schematic of the structure of the EBT3, EBT-XD, MD-V3, and HD-V2 films, respectively, with different thickness of the active layer (AL), matte polyester (MP), and clear polyester (CP). Panels (1) through (16) demonstrate 16 different orientations of the film samples with respect to the scanner. The straight red–blue arrow represent an arbitrary polarization axis in the film. Letter E indicates the mark position at the corner of the film sample.
Download figure:
Standard image High-resolution image 2.2. Kilovoltage x-ray irradiationThe geometry of the experiments using a small animal radiation research platform (SARRP) (Xstrahl GmbH, Germany), equipped with an x-ray source, is shown in figure 2. The x-rays tube operates at 220 kVp voltage and 13 mA current. The SARRP had been calibrated according to AAPM's TG-61 (Ma et al 2001) and delivers dose rate of 3.67 Gy min−1 to phantom at the isocenter (35 cm distance from the source) under standard condition (2 cm depth in phantom, 33 cm source-to-surface distance (SSD), and full scatter) when the 0.15 mm Cu filter is in place without any other additional secondary collimator in place. RCF samples were placed at 2 cm depth in phantoms (RW3, PTW, Freiburg · German) (33 cm SSD) with 5 cm additional phantom beyond them. Two film samples from each film model were irradiated at different dose levels depending on the model: 1–10 Gy for the EBT3 model (1, 2, 3, 4, 5, 6, 7, 8, 9, and 10 Gy), 1–40 Gy for EBT-XD model (1, 5, 10, 15, 20, 25, 30, 35, and 40 Gy), 1–100 Gy for MD-V3 model (1, 5, 10, 20, 30, 40, 50, 75, and 100 Gy), and 1–300 for HD-V2 model (10, 25, 50, 100, 200, and 300 Gy). For doses greater than or equal to 50 Gy, irradiation was performed through delivering 25 Gy fractions with several minutes delay in between to avoid extreme load to the SARRP.
Figure 2. (a), (b) Geometry of the SARRP. The nominal source-to-axis (SAD) is 35 cm. Film samples were placed at 2 cm depth in phantom under 33 cm source-to-surface distance (SSD). (c) Geometry of the irradiation setup with a linac. Films were placed at 5 cm depth in phantom under 100 cm SSD and irradiated using a 6 MV beam.
Download figure:
Standard image High-resolution image 2.3. Megavoltage x-ray irradiationThe RCF samples, placed at 5 cm depth in phantom (Virtual Water®, Standard Imaging, Middleton, WI) with additional 20 cm phantom beyond them to provide sufficient backscattering, were irradiated using a 6 MV beam generated by a linac (TrueBeamTM, Varian, Paolo Alto, CA). The linac, calibrated according to AAPM's TG-51 (Almond et al 1999), delivers 1 cGy/MU at the depth of maximum dose (1.5 cm). The SSD was 100 cm and field size was 10 cm × 10 cm at the surface. Two film samples were irradiated at different dose levels depending on the model to match the dose levels delivered by the SARRP as mentioned in the previous section. The deliveries involving greater or equal to 50 Gy dose were done at 25 Gy fractions with several minutes delay in between in order to avoid extreme load to the linac.
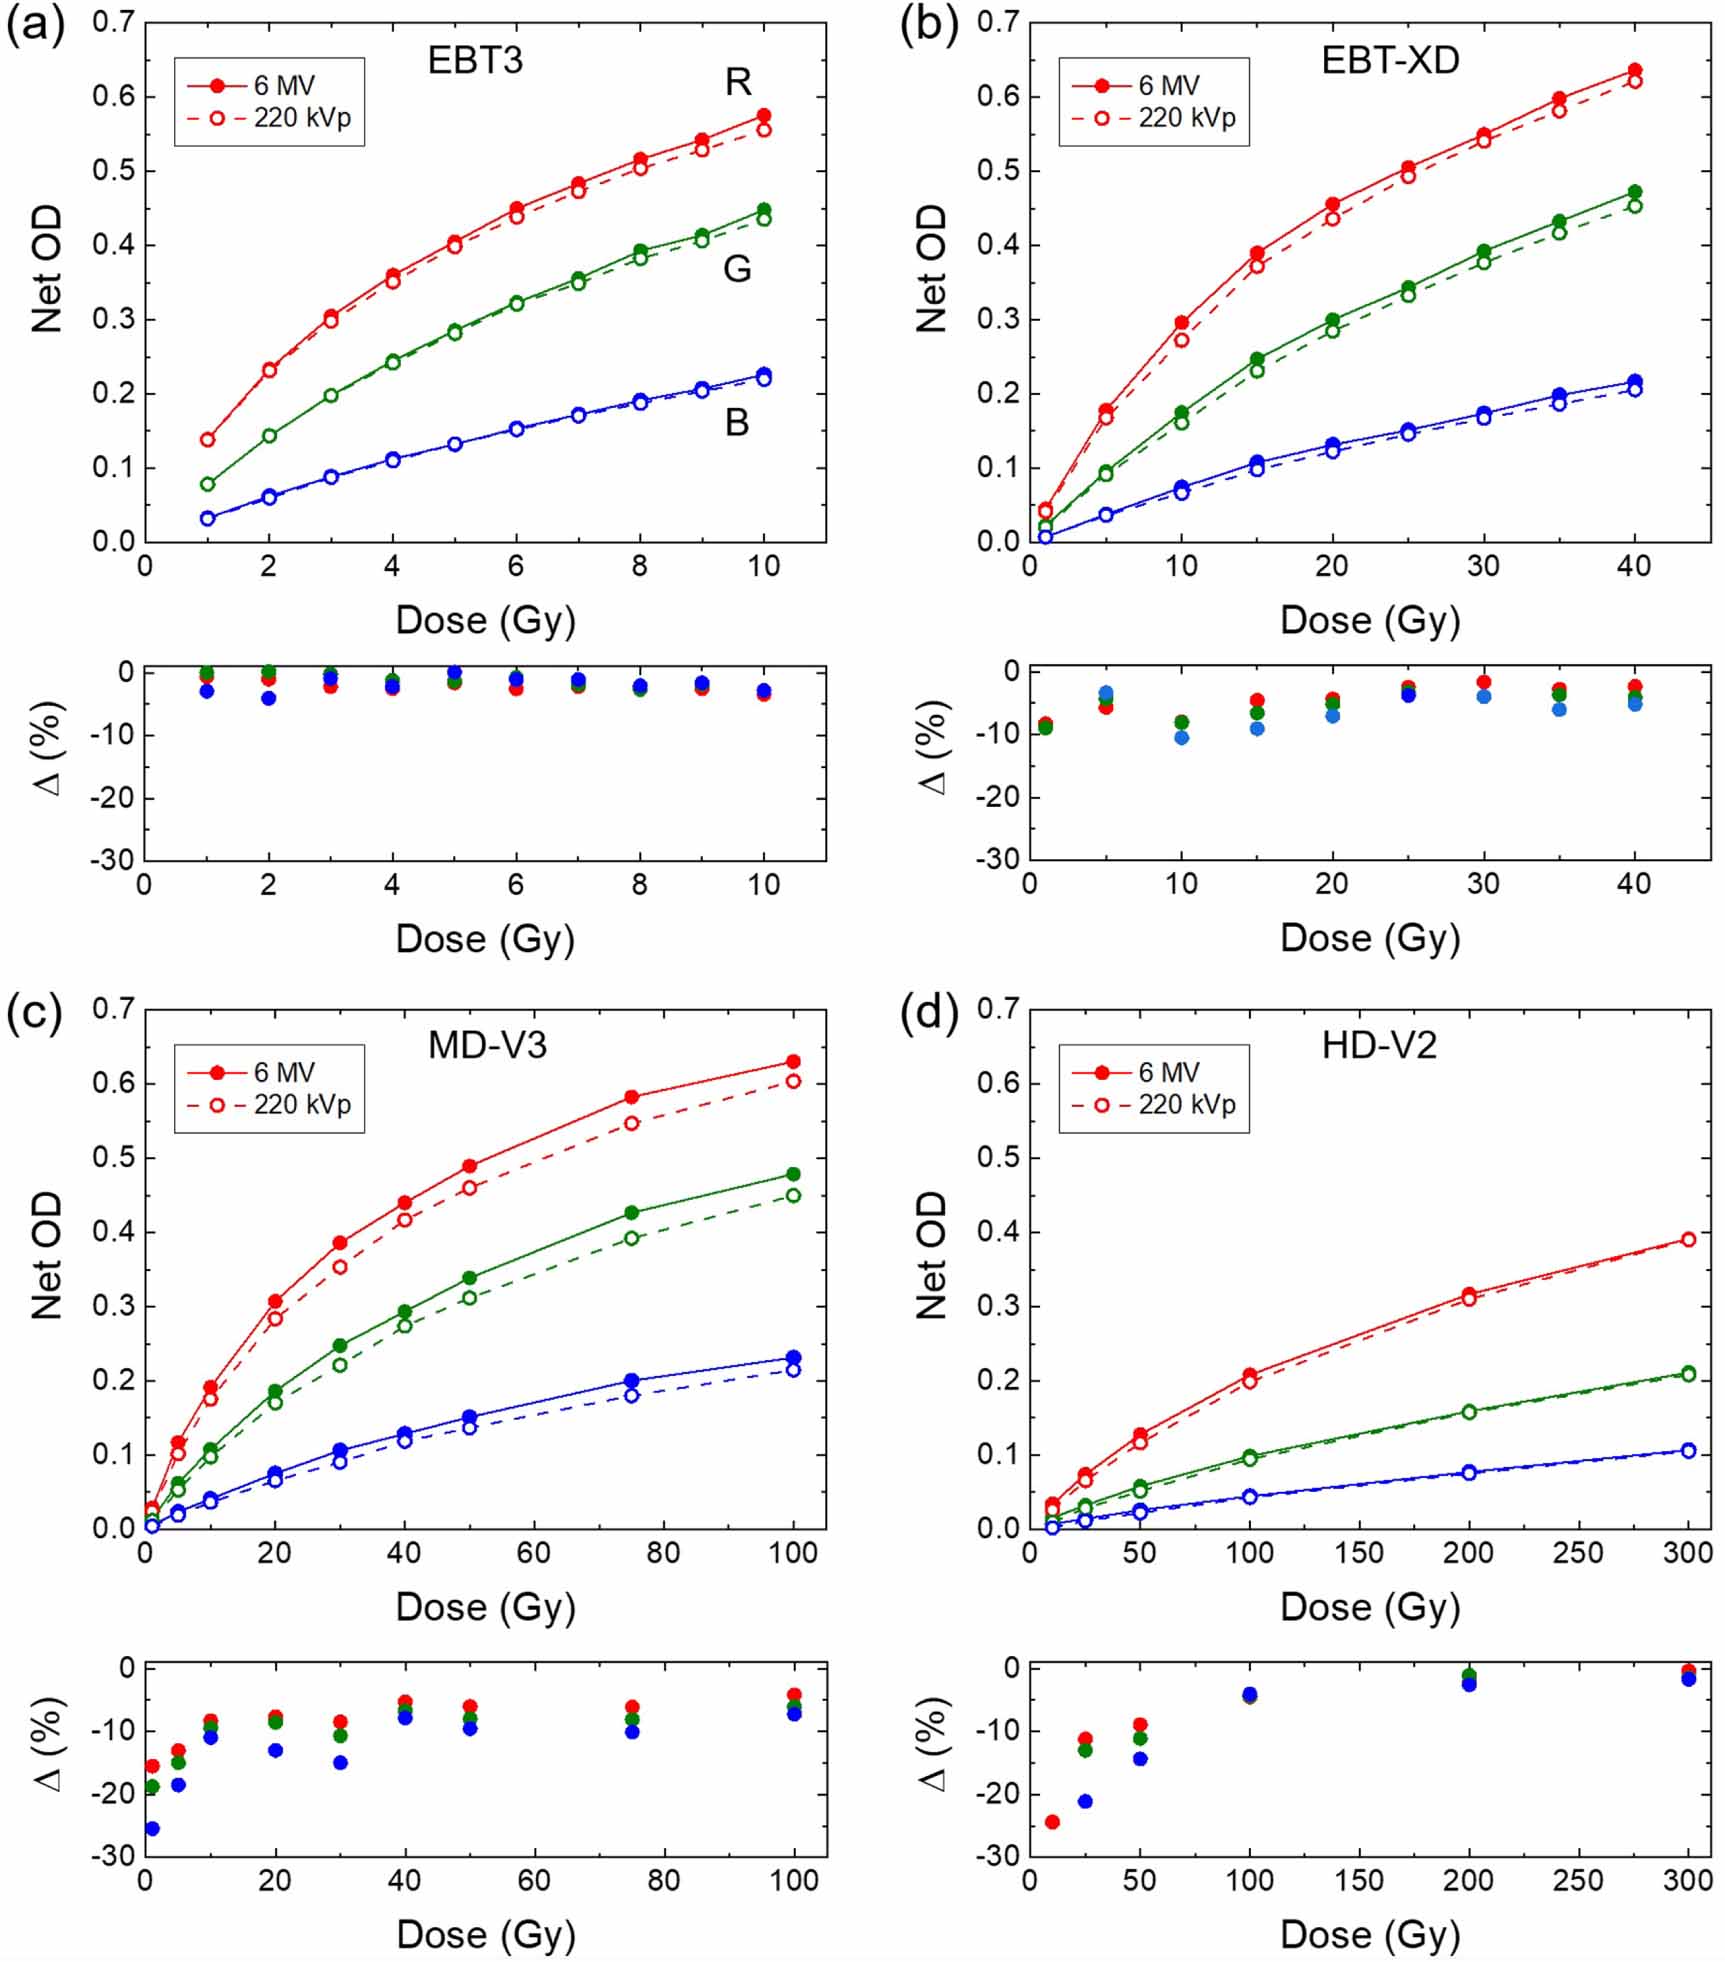
3.1. Energy dependencyFigures 3(a)–(d) shows the Net OD measured at red, green, and blue color channels of different film models irradiated using the 6 MV and 220 kVp beams. The insets show the percentage difference at each color channel for each film model and dose level. It can be seen that in all models, the films under-respond to the kilovoltage beam compared to the megavoltage beam. The difference varied depending on the film model. At lower dose levels compared to the dynamic range of the films, the response was less stable, as such the difference can also be attributed to the lower sensitivity of the films. The under-response of RCF to kilovoltage beams and ion beams has been attributed to the LET-dependency of the films through two mechanisms: radical recombination and response saturation (Kirby et al 2010, Grilj and Brenner 2018, Massillon-JL 2020). When the films are irradiated by a high LET beam, a significant portion of the produced densely spaced free radicals can recombine without initiating any polymerization process in the constituent monomers in the active layer. Since the film darkening (i.e. increase in the OD) is a result of polymerization, less polymerization results in a smaller increase in the OD (i.e. loss of signal). The other mechanism depends on the interplay between the density of ionization sites and the microcrystalline structure of the active layer of the film. The monomers are packed in rod-like crystals, the size of which depends on the film model. Within the crystal lattice, the monomers are spaced with some definite separation. When the films are irradiated by a high LET beam, all monomers (polymerization sites) near a single particle track get ionized and the film response saturates, leaving a portion of the particle's energy 'wasted' without contributing to film darkening (Kirby et al 2010, Grilj and Brenner 2018).
Figure 3. Net optical density of the red (R), green (G), and blue (B) color channels of the (a) EBT3, (b) EBT-XD, (c) MD-V3, and (d) HD-V2 radiochromic films irradiated at various dose level using a linac's 6 MV beam (solid circles/solid lines) and a SARRP with 220 kVp x-ray beam (hollow circles/dashed lines). Insets show the percentage difference between the Net OD at each color channel.
Download figure:
Standard image High-resolution imageA previous study reported up to approximately 5%, 6%, and 15% under-response in EBT3 films for the red, green, and blue color channels, respectively, irradiated using a 300 kVp x-ray beam compared to 60Co irradiation (Villarreal-Barajas and Khan 2014). Here we also observed under-responding of EBT3 films to 220 kVp beam compared to the 6 MV beam, however the exact amount of the under-response may be batch-dependent. Another study (Grilj and Brenner 2018) on the LET-dependency of EBT3 and MD-V3 films showed that the LET-dependency is more pronounced in the MD-V3 model compared to the EBT3 model, a trend that was observed in our work as well.
The difference in dynamic range of the films is evident in figure 3 as well, for example it takes ∼5 Gy for EBT3 model, ∼15 Gy for EBT-XD model, ∼30 Gy for MD-V3 model, and ∼300 Gy for HD-V2 model to reach Net OD ∼0.4 at the red color channel. Sensitivity plot for all color channel and all models is shown in figure 4. It can be seen that the red channel has the highest sensitivity and blue channel has the lowest sensitivity in all models. Films with higher sensitivity are more suitable for applications involving lower doses within the dynamic range of the film.
Figure 4. Sensitivity of the red (R), green (G), and blue (B) color channels of the (a) EBT3, (b) EBT-XD, (c) MD-V3, and (d) HD-V2 radiochromic films irradiated at various dose level by a 6 MV beam (solid circles/solid lines) and a 220 kVp x-ray beam (hollow circles/dashed lines).
Download figure:
Standard image High-resolution imageIt is worth mentioning that in all models, each 1% error in Net OD determination would lead to approximately 1%–2% error in dose measurement depending on the delivered dose level. As such, kilovoltage beams would require a separate calibration curve for accurate dosimetry.
3.2. Spectral propertiesThe absorption spectra of un-irradiated films are shown figure 5. The overall spectral shape and position of absorption peaks are similar in the EBT3 (primary peak at 633 nm), EBT-XD (634.1 nm), and MD-V3 (634.1) models. However, for the HD-V2 model, the peak absorption wavelength is at a much longer wavelength (677.5 nm). All of these model show several other local peaks in their absorption spectra.
Figure 5. Absorbance spectrum of non-irradiated EBT3, EBT-XD, MD-V3, and HD-V2 films.
Download figure:
Standard image High-resolution imageThe spectral response of the films irradiated using the 220 kVp x-ray beam are presented in figure 6. The irradiated EBT3, EBT-XD, and MD-V3 films show a primary (secondary) absorption peak at ∼635 nm (∼584 nm) whereas the HD-V2 model shows a primary absorption peak at 678.22 nm (irradiated at 10 Gy) and a secondary absorption peak at 619.64 nm (10 Gy). It can be seen in figure 6 that the peak position is slightly shifted depending on the wavelength, dose, and the film model. In the HD-V2 model, both primary and secondary peaks are blue-shifted with dose. For example, at 300 Gy dose, the primary and secondary absorption peaks are shifted by approximately 7.5 nm and 5 nm to 670.71 nm and 614.68 nm, respectively. This spectral behavior has been reported for HD-V2 films exposed by proton beams and radioactive sources (Albogamy et al 2015, Feng et al 2018). In the MD-V3 model, both primary and secondary peaks are red-shifted with increase in the dose; from 634.48 nm (at 5 Gy) to 642.43 nm (at 100 Gy) and from 584.3 nm (5 Gy) to 585.08 nm (100 Gy). The wavelength shift is more pronounce at the primary absorption peak. The observed red-shift in the MD-V3 model is in agreement with previous studies using 60Co irradiation (Yamada and Parker 2022). In all film models, it can be seen that the primary peak reaches to saturation sooner than the secondary peak.
Figure 6. Absorption spectra of (a) EBT3, (b) EBT-XD, (c) MD-V3, and (d) HD-V2 films irradiated using the 220 kVp beam at different dose levels, 1–10 Gy, 1–40 Gy, 1–100 Gy, and 1–300 Gy, respectively. Arrows indicate the direction of the shift in the wavelength.
Download figure:
Standard image High-resolution imageThe observed spectral shift in the position of the absorption peak does not have a critical impact on film dosimetry when a broadband light source is used to measure the OD of the films. However, when a monochromic light source, such as a laser beam (e.g. HeNe at 632.8 nm wavelength), is used to read the OD, this shift in the position of the absorption peak may impact the OD readout.
The absorption wavelength shift in conjugated polymers, fundamentally, can be related to the polymer length and topology (Samuel et al 1994, Callens et al 2016, 2017, Isa et al 2017). There is a correlation between conjugation length and absorption wavelength; the longer the former the longer the latter (Isa et al 2017). When the EBT-XD, and MD-V3 films are irradiated with more radiation dose, more polymerization processes occur leading to longer chains explaining the red-shift (bathochromic shift). In the HD-V2 model, however, further increase in dose may cause polymer chain scission, hence a blue-shift (hypsochromic shift) is observed. Also, since in the HD-V2 model, the active material is not sandwiched between two protective layers, instead it is coated on a single layer, it is possible that less confinement may cause more twist in the polymer chain. Such twists cause a loss in planarity which effectively reduce the conjugation length leading to a blue-shift. Such a blue-shift has also been observed in OrthoChromic film OC-1 model (OrthoChrome Inc., Hillsborough, NJ, USA) (Chen et al 2024), whose design composed of an active layer coated on a base substrate, i.e. not sandwiched between two layers. Different doping and composition of the constituent monomers in the HD-V2 model may also be responsible for the observed blue-shift.
3.3. Orientation dependencyThe OD of un-irradiated films scanned at 16 orientations are presented in figure 7. The change in the OD for the red channel can be up to ∼16%, ∼7%, ∼6%, and ∼7.8% in the EBT3, EBT-XD, MD-V3, HD-V2, models, respectively. The corresponding change for the green (blue) channel is approximately 13% (8%), 6% (4.3%), 6.4% (4.8 %), and ∼8.6% (5.8%). It can be clearly seen that the OD changes with the orientation in a sinusoidal manner in EBT3, EBT-XD, and MD-V3 models. This behavior stems from the polarization modulation of the transmitted light by the structure of the films (Lynch et al 2006, Alnawaf et al 2010, Schoenfeld et al 2015, Lárraga-Gutiérrez et al 2018). According to Malus's law, the intensity of the transmitted light passing a linear polarizer is  , in which
  is the angle between the polarization axis of the polarizer and that of the incident light beam with intensity
  (Hecht 2016). It can be seen that the orientation dependency agrees with a model based on a preferential polarization direction in the films. The film structure with needle shaped constituents crystals are to some extent analogous to that of a polaroid polarizer (Hecht 2016). A preferred elongation of the monomers acts like a polarizer with a preferential axis of polarization. In principle, using an 'un-polarized' (randomly polarized) light source for scanning the films would reduce the orientation dependency.
Figure 7. Orientation dependency of the optical density (OD) measured at different color channels for an un-irradiated (a)–(c) EBT3, (d)–(f) EBT-XD, (g)–(i) MD-V3, and (j)–(l) HD-V2 film. Dashed curves show sinusoidal squared fits. In MD-V3 and HD-V2 films, orientations 1–8 and 9–16 were separately fitted.
Download figure:
Standard image High-resolution imageIn the MD-V3, it can be seen that when the film is flipped (i.e. orientations 9–16), the OD significantly changes. Nevertheless, each set (1–8 and 9–16) still follows the sinusoidal pattern. The change in the transmission is due to the asymmetry introduced by the adhesive layer that exists only in one side of the active layer. In HD-V3 model, due to its asymmetric design, it can be seen that when the film is flipped, a noticeable change in OD is observed. Orientations 1–8 correspond to the case when the active layer (i.e. non-protected surface of the film) was faced the scanner. Within each group, 1–8 and 9–16, still a slight orientation dependency (e.g. ∼1.3% in the red channel) is observed which may be related to the fact that the constituent crystals of this model are smaller and less elongated, hence possessing a weaker polarizability capability. Within the same-face scans, the orientation dependency in the red color channel is approximately 16%, 7%, 3.3%, and 1.3%, in the EBT-3, EBT-XD, MD-V3, and HD-V2 film models, respectively. The corresponding values for the green (blue) channel are ∼13% (8%), ∼6% (4.3%), ∼3.2% (2.4%), and ∼1.5% (0.9%). The observed trend indicates that the size of constituent crystals play a role in the orientation dependency of the films; the longer they are the stronger the orientation dependency is.
All film models studied in this work, EBT3, EBT-XD, MD-V3, and HD-V2, show an under-response in terms of OD when irradiated at the same dose using 220 kVp x-ray beams compared to the case when a 6 MV beam is used for irradiation. The under-response in the OD, which depends on the film model, leads to a noticeable error in dose measurement if the calibration curve obtained using the same beam type is not used. Absorption spectra of the EBT3, EBT-XD, and MD-V3 showed similarity in terms of the overall spectral shape and position of the peaks. The absorption spectrum of the HD-V2 model showed a different overall shape. The position of the absorption peaks, depending on the film model, shift with dose. All film models showed orientation dependency following a model based on the existence of a preferred polarization axis in the films. If the orientation is not maintained during scanning, significant errors occur in dose measurement. The orientation dependency is more significant in film models with higher sensitivity composed of longer constituent nanocrystals.
The data that support the findings of this study are available upon reasonable request from the author.
The author has no conflict of interest to disclose.
Comments (0)