
Remember me

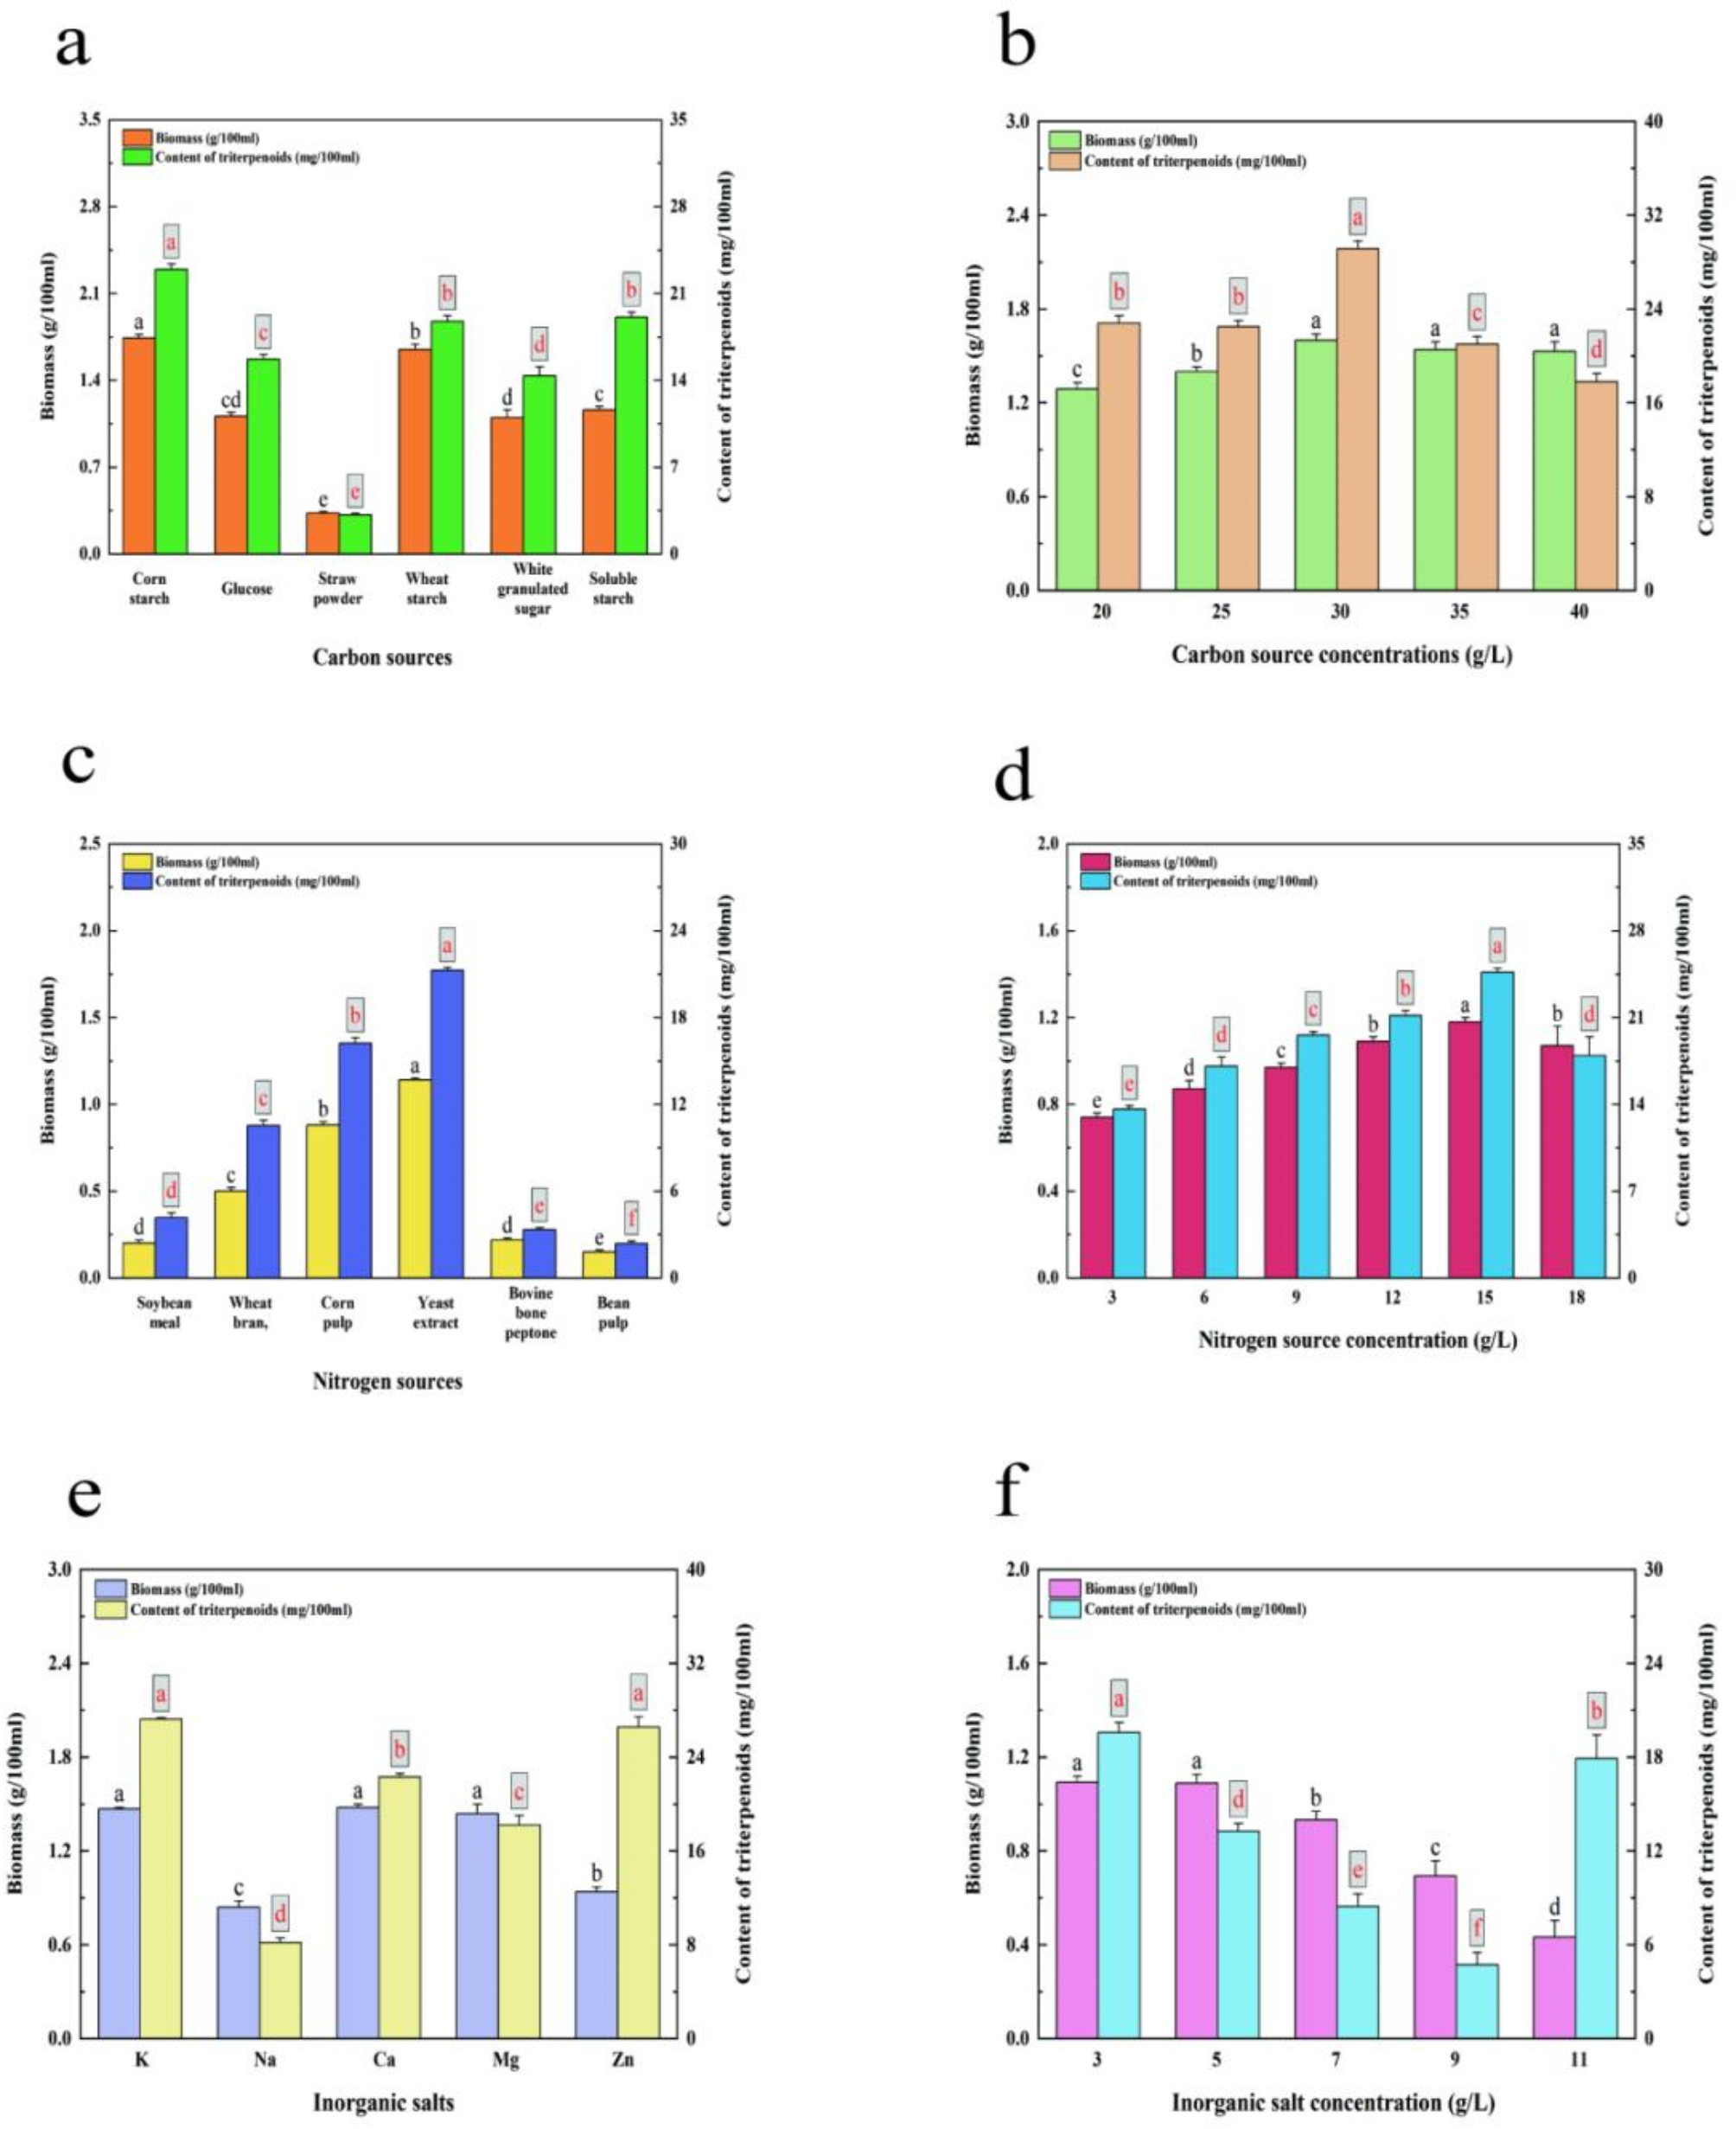


The results demonstrated that diverse nutrient sources and concentrations had notable impacts on both the triterpenoids content and mycelium biomass of TMB (Fig. 1).
Fig. 1
The impact of various medium components and concentrations on TMB fermentation was studied. (a) Carbon sources from various means. (b) Concentration gradients of corn starch. (c) Nitrogen sources from different origins. (d) Concentration gradients of yeast extract powder. (e) Various types of trace elements. (f) Concentration gradients of KH2PO4. Quantitative analysis was conducted for biomass and triterpenoids. All fermentations were carried out at 24 ℃ for seven days. All triplicate measurements were taken for the data presented as the mean ± standard deviation. Different letters indicate significant differences between groups (p < 0.05, according to the Duncan test)
Effects of different carbon sources and concentrations on the production of triterpenoids and mycelial biomass in TMBThe other elements were fixed, and different carbon sources were used for the fermented liquid culture of TMB. Glucose, white granulated sugar, corn starch, soluble starch, wheat starch, and straw powder were added to the basic liquid medium as 2% carbon sources, respectively, to determine the best carbon source in the media. The mycelial biomass (1.74 ± 0.03 g/100 mL) and total triterpenoids contents (22.94 ± 0.42 mg/100 mL) of TMB were the highest in corn starch as a carbon source (Fig. 1a), and significantly differed from other carbon sources. When straw powder was used as a carbon source, the mycelial biomass (0.33 ± 0.01 g/100 mL) and total triterpenoids contents (3.15 ± 0.1 mg/100 mL) were the lowest.
Additionally, due to its affordability and easy availability of raw materials, corn starch was selected as the main carbon source for our experiments. After selecting the ideal carbon source, we also screened its concentration. The experimental results showed that the triterpenoids content and mycelial biomass of TMB gradually increased with the increasing supplemental level of corn starch (Fig. 1b). When the supplemental level of corn starch was 30 g/L, both the triterpenoids content (29.15 ± 0.64 mg/100 mL) and mycelial biomass (1.6 ± 0.04 g/100 mL) reached their highest values for mycelium. Furthermore, increasing the concentration of corn starch resulted in a gradual decline in both the total triterpenoids content and mycelial biomass of TMB, rather than continuous enhancement.
Effects of different nitrogen sources and concentrations on the production of triterpenoids and mycelial biomass in TMBTMB was cultured in different nitrogen sources while keeping other elements in the liquid fermentation media constant. Bovine bone peptone, corn pulp, yeast extract powder, bean pulp, wheat bran, and soybean meal were also added to the basic liquid media in separate additions of 6 g/L each to determine the best nitrogen source in the media. The mycelium biomass (1.14 ± 0.01 g/100 mL) and triterpenoids content (21.26 ± 0.19 mg/100 mL) were highest when yeast powder was used as a nitrogen source, as shown in Fig. 1c, with significant differences compared to other nitrogen sources. Conversely, soybean dregs resulted in the lowest mycelium biomass (0.1 ± 0.01 g/100 mL) and total triterpenoids content (2.39 ± 0.16 g/100 mL). Therefore, yeast powder was selected as a nitrogen source for subsequent experiments. After selecting the optimal nitrogen source, we also screened the concentration gradients of the nitrogen source. The results demonstrated a gradual increase in both total triterpenoids content and mycelial biomass of TMB with an increasing amount of yeast powder (Fig. 1d). When the concentration of yeast powder reached up to 15 g/L, the mycelium exhibited the highest triterpenoids content (24.6 ± 0.32 mg/100 mL) and mycelial biomass (1.18 ± 0.02 g/100 mL).
Effects of different microelements and concentrations on the production of total triterpenoids and mycelial biomass in TMBOther elements in the liquid fermentation media were kept constant, and TMB was cultured using different trace elements. Moreover, separate additions of 3 g/L of potassium dihydrogen phosphate, magnesium sulfate, calcium chloride, sodium molybdate, and copper sulfate were made to the substrate to determine the optimal trace elements in the medium. The mycelium biomass (1.47 ± 0.01 g/100 mL) and total triterpenoids content (27.24 ± 0.11 mg/100 mL) of TMB were the highest when potassium dihydrogen phosphate was used as a trace element (Fig. 1e), and there were significant differences between all of them and some other trace elements. When sodium molybdate was used as a trace element, the mycelium biomass (0.84 ± 0.04 g/100 mL) and total triterpenoids content (8.18 ± 0.41 mg/100 mL) were the lowest.
Therefore, potassium dihydrogen phosphate was selected as the trace element added to the culture medium for follow-up experiments. After choosing the suitable trace elements, we also screened their concentration gradients. When the concentration of potassium dihydrogen phosphate increased, there was a gradual increase in both the total triterpenoids content and mycelial biomass in TMB (Fig. 1f). The highest values observed in total triterpenoids content were 26.67 ± 0.57 mg/100 mL and mycelium biomass 1.24 ± 0.03 g/100 mL with additional concentration of potassium dihydrogen phosphate (5 g/L). If the concentration of trace elements was further increased; however, instead of continuous enhancement, there was a gradual decline in both the triterpenoids content and mycelial biomass of TMB.
Effects of diverse cultural conditions on the production of total triterpenoids and mycelial biomass in TMBThe findings indicated that culture conditions (inoculum volume, liquid volume, and culture time) significantly affected both triterpenoids content and mycelial biomass of TMB (Fig. 2).
Fig. 2
Effects of different culture conditions on the fermentation of TMB. (a) The amount of inoculation. (b) The time of incubation. (c) The volume of liquid. All fermentation was carried out at 24 ℃. All data are in triplicate (mean ± standard deviation). Different letters indicate significant differences between lines (p < 0.05, according to the Duncan test)
The impact of varying inoculum volumes on the production of triterpenoids and mycelial biomass in TMBThe mycelial biomass and total triterpenoids content in TMB under different inoculum volumes are depicted in Fig. 2a. As the inoculation amount increased from 3 to 6%, both the mycelial biomass and total triterpenoids content in TMB discovered a gradual increase, and reaching their peak at an inoculation amount of 6%. The total triterpenoids content was measured as 23.03 ± 0.1 mg/100 mL, while the mycelial biomass was calculated as 1.29 ± 0.01 g/100 mL. However, upon further increasing the inoculation amount, a decline in triterpenoids content and mycelial biomass was observed.
Effects of different cultivation periods on the yield of triterpenoids and mycelial biomass in TMBThe mycelial biomass and total triterpenoids content of TMB were shown in Fig. 2b under different culture days. As the culture time progressed, both the mycelial biomass and total triterpenoids content in TMB displayed a gradual rise. The maximum value for total triterpenoids content reached on the 7th day was 26.67 ± 0.25 mg/100 mL, while for mycelium biomass it peaked on the 9th day was 1.8 ± 0.02 g/100 mL. Nevertheless, as the culture period extended, there was a slow decline observed in both triterpenoids content and mycelium biomass.
The impact of changing liquid loading on the production of triterpenoids and mycelial biomass in TMBThe mycelial biomass and triterpenoids content of TMB under different liquid volumes in the flask are depicted in Fig. 2c. As the liquid volume increased from 40 to 130 mL, there was a rapid increase in TMB mycelial biomass and triterpenoids content, reaching their peak at a liquid volume of 130 mL. The respective values for triterpenoids content and mycelium biomass were recorded as 25.06 ± 0.69 mg/130 mL and 1.32 ± 0.04 g/130 mL, respectively. Whereas, with the extra escalation in liquid volume in the flask, a gradual decline was seen in the triterpenoids levels and mycelium biomass.
The results of Plackett–Burman designThe results of the PBD experiment were presented in Table 3. Regression analysis and analysis of variance were used to analyze PBD. As shown in Table 4, a p-value below 0.0500 indicates a significant model item. Among the six influencing factors, culture days, yeast powder, KH2PO4, and liquid volume had p-values less than 0.0001, 0.0064, 0.0067, and 0.01, respectively, which made them the most crucial variables affecting the total triterpenoids content of TMB. Conversely, other variables’ p-values had a negligible impact on the total triterpenoids content and were considered statistically insignificant (Table 4).
Table 3 Experiment design and results of PBDTable 4 Analysis of variance of PBD resultsTo change the total triterpenoids content of TMB, we chose the three main factors (culture duration, yeast powder concentration, and KH2PO4 supplementation) that had the most significant effect on TMB triterpenoids production. These were then used in a BBD experiment. In addition, through the Pareto map (Fig. 3), we can also get the following information: among the three factors, the culture days have a significant positive effect on the production of total triterpenoids of TMB, while two factors (yeast powder and KH2PO4) have significant negative effects on the production of total triterpenoids in TMB.
Fig. 3
Response surface and isoline map interaction among culture days, yeast extract, and KH2PO4. (a) The response surface diagram shows the interaction between culture days and KH2PO4. (b) Response surface map interacted between culture days and yeast powder. (c) The response surface diagram showed an interaction between KH2PO4 and yeast powder. (d) Isoline map interaction found between culture days and KH2PO4. (e) Isoline map interaction between culture days and yeast powder. (f) Isoline map interaction inspected between KH2PO4 and yeast powder
Fig. 4
The pareto map shows the importance of factors and their impact on the fermentation process. The figure showed positive factors as orange bars and the negative factors as blue bars. The factor whose “effect t-value” is higher than the Bonferroni limit is considered to be highly significant, while the factor between the Bornferroni limit and the t-limit was considered to be moderately significant and lower than the t-limit. It has the least influence on the response value
Box-Behnken experimental resultsThe best levels of significant independent variables (X1 culture days, X2 KH2PO4, and X3 yeast extract) were determined by BBD design based on the above results, with the triterpenoids content as the only response variable. The experimental designs and results are available in Table 5. A three-factor and three-level BBD were employed to construct the second-order response surface. The quadratic equation model derived from the analysis of the experimental data is as follows:
$$ \begin Y & = 46.72 + 5.97X_ - 1.17X_ + 0.6963X_ \\ & \quad + 0.0075X_ X_ + 1.41X_ X_ + 0.7300X_ X_ \\ & \quad - 7.22X_ ^ - 4.44X_ ^ - 7.96X_ ^ \\ \end $$
Table 5 Experiment design and results of BBDY represents the predicted response value of total triterpenoids content, while X1, X2, and X3 illustrate the coded values for culture days, KH2PO4, and yeast extract powder, respectively.
The analysis of variance for total triterpenoids production in TMB is accessible in Table 6. The model’s F value is 42.33, indicating a good fit, while the lack-of-fit F value is 0.4609. This suggests that the model fits well with the experimental data. Additionally, the p-value (< 0.0001) and misfit value (0.1155) further support this conclusion. Further, the ANOVA regression model revealed a determination coefficient R2 of 0.9820 (Table 6), demonstrating a strong fit between the model and experimental data, making it reliable for further analysis purposes. The adjusted R2 is 0.9588, and the predicted R2 is 0.9049 (Table 6). The difference between them being less than 0.2 indicates reasonable consistency between experimental and predicted values, confirming the applicability and feasibility of the model. Furthermore, Table 6 provides coefficients calculated by regression analysis for each variable in the model’s equation. The simulation coefficients for X1, X12, X2,2 and X32 are all less than 0 0.0001. Thus, it has been proven that they play an important role in total triterpenoids production in TMB.
Table 6 Analysis of variance of PBD resultsIn addition, 3D response surface and 2D isoline maps were used to visually describe each variable (culture days, KH2PO4, and yeast extract), as well as the response variable (total triterpenoids yield) (Fig. 3). A three-dimensional response surface diagram and isoline map were drawn to illustrate the interaction between the two variables and determine the optimal concentration for maximum triterpenoids production (Fig. 3). Each graph displays an infinite combination of two independent variables while keeping the other variable at a constant level. When using RSM optimized medium, there was no significant interaction observed between the variables (X1X2, X1X 3, and X2X3) due to the relatively circular nature of the isoline map. The lack of importance of interaction terms is also supported by high probability values (p > 0.05). An interaction between culture days and KH2PO4, the content of total triterpenoids gradually increased with an increase in both culture days and the concentration of KH2PO4 within the range of 5-7.8 days and 3–4.74 g/L (Fig. 3a and d).
However, as culture days and KH2PO4 concentrations further increased, the triterpenoids content began to decrease. Figure 3b and e indicate the interaction between culture days and yeast extract powder. Initially, with an increase in culture days and yeast extract powder, the total triterpenoids content rise, and then gradually started decline. As shown in Fig. 3e and f, with an increase in the amount of KH2PO4 and yeast extract concentration, the triterpenoids content initially increased but later started reducing again. The highest level of triterpenoids content was examined at a KH2PO4 concentration of 4.74 g/L combined with a yeast extract concentration of 13.44 g/L.
Verified results by shaking flask fermentationAccording to optimization results of BBD, the maximum triterpenoids yield in TMB was predicted to be 48.03 mg/130 mL as culture days, KH2PO4 and yeast extract concentrations were 7.8 days, 4.74 g/L and 13.44 g/L, respectively. In order to verify the effectiveness of the empirical model, three parallel experiments were carried out by using the best prediction solution of BBD. Under the optimized conditions, the total triterpenoids yield of TMB reached 50.21 mg/130 mL (Fig. 5A), which was close to the predicted value of RSM. It is also indicated that the experimental value was in good agreement with the predicted value. Compared with the original medium, the total triterpenoids product of the optimized medium increased by 1.9 times, and the mycelial biomass of TMB was 2.23 g/flask (130/250 mL), which was 1.66 times higher than that of the unoptimized medium (Fig. 5B). Therefore, the model established in this paper is accurate and reliable in predicting the total triterpenoids content of TMB.
Fig. 5
Non-optimized and optimized experiment contrast. (A) The content of triterpenes. (B) Mycelium biomass. The bar presented the standard deviation of three repeats. *** showed statistical significance based on a two-tailed test (p < 0.0001)
Comments (0)