
Remember me
Mitochondrial dysfunction is a significant contributor to the promotion of vascular aging and vascular dysfunction that can lead to hypertension. For example, aging and inflammation promote mitochondrial radical oxygen species (ROS) production, which is linked to disinhibition of MAPK signaling (Kulawiec et al., 2009; Dikalov and Ungvari, 2013), while the release of cell-free mitochondrial DNA (mtDNA) into the circulation in response to inflammatory and noxious stimuli is associated with TLR9 activation and inflammatory signaling (McCarthy et al., 2015; McCarthy et al., 2018). Aging blood vessels tend to have reduced mitochondrial DNA copy number (mCN), while mutations in mtDNA contribute to maternal heritance patterns of hypertension (Schwartz et al., 2004; Wilson et al., 2004; Ungvari et al., 2008; Liu et al., 2009; Elango et al., 2011). Consistent with the premise that mitochondrial dysfunction is associated with hypertension, we have reported that patients with two forms of mitochondria-associated genetic variants exhibited higher rates of hypertension than the age-matched general population (Hannah-Shmouni et al., 2014; Pauls et al., 2020). One group had high heteroplasmy levels for common m.3243A>G mitochondrial encephalopathy, lactic acidosis, and stroke-like episode (MELAS) mtDNA variant. The other group had chronic progressive external ophthalmoplegia (CPEO) associated with variants in the POLG gene, which encodes the DNA Polymerase Gamma, Catalytic Subunit (POLG) that is responsible for replicating mtDNA. In particular, the CPEO population with POLG variants had high rates of hypertension that were refractory to combined anti-hypertensive drug therapy, suggesting that POLG variants were associated with structural changes in blood vessels involving smooth muscle hypertrophy or hyperplasia, rather than inducing elevated vascular tone.
While numerous POLG variants are associated with neuromuscular disorders and several with tumorigenesis (Graziewicz et al., 2004; Wong et al., 2008; Singh et al., 2009; Singh et al., 2015), little is known about the impact of POLG variants on vascular function. In the vasculature, mitogenic signaling in contractile, quiescent smooth muscle cells can lead to polyploidy via endoreduplication, if cell division is suppressed, or neointimal proliferation, when mitotic stimulation is sufficient and prolonged (Hixon et al., 2000; Hixon and Gualberto, 2003; Owens et al., 2004). Downregulation of the mitochondrial fusion promoting protein mitofusin2 and active mitochondrial division are involved in and are reportedly necessary for smooth muscle proliferation and vascular remodeling (Chen et al., 2004; Chalmers et al., 2012). Similarly, increased mitophagy is a key step in smooth muscle phenotypic switching from contractile to proliferative states (Pearce, 2024). Whether or how genetically impaired POLG function influences smooth muscle function or phenotype is currently not known. We hypothesized that the association of POLG-related diseases with drug-resistant hypertension could suggest that POLG variants promote smooth muscle hypertrophy and or hyperplasia promoting vascular remodeling.
To assess the role of POLG pathogenic variants and variants of unknown significance (VUSs), we created a series of exogenous expression vectors encoding wild-type POLG or clinically observed variants and carried out overexpression of these variants in A7r5 smooth muscle cells or HeLa cells in culture. The variants selected included the pathogenic p.Tyr955Cys (c.2864A>G) and the p.Arg964Cys (c.2890C>T) variant that predisposes carriers to nucleoside reverse transcriptase inhibitor-induced mitochondrial toxicity (Graziewicz et al., 2004; Bailey et al., 2009; Estep and Johnson, 2011). Both variants are known to reduce polymerase activity and accuracy, where the Y955C exhibits the more severe phenotype (Ponamarev et al., 2002; Bailey et al., 2009). Notably, a homozygous p.Arg964Cys (c.2890C>T) variant was also attributed to juvenile liver failure in the absence of neurological symptoms (Kadohisa et al., 2024). We further selected two VUSs found in our cohort of CPEO patients: p.Asn1098Ile (c.3293A>T) and p.Arg1138Cys (c.3412C>T). These VUSs are located in the 1F subcluster of the POLG polymerase domain, and neither alone is predicted to be dominant or be likely to cause POLG-related symptoms alone by the POLG Pathogenicity Prediction Server (www.mitomap.org). However, p.Arg1138Cys was reported in cases of progressive external ophthalmoplegia and sensory ataxic neuropathy, dysarthria, and ophthalmoparesis in trans with p.Ala467Thr (Wong et al., 2008). A related p.Asn1098Lys variant was reported in a case of Alpers–Huttenlocher syndrome (Iodice et al., 2016). These reports suggest the pathological potential of the p.Arg1138Cys and p.Asn1098Ile variants, but their specific impacts on POLG function have not been reported previously. Using these variants, we assessed predictions of the POLG/DNA interaction with AlphaFold, cell proliferation with endpoint assays and live imaging, and analyses of mitochondrial membrane potential, radical oxygen species generation, and oxygen consumption. Subsequently, we refer to variants by single-letter abbreviations for compactness (i.e., Y955C, R964C, N1098I, and R1138C).
2 Methods2.1 Chemical, reagents, and abbreviationsChemicals and drugs were purchased from Sigma-Aldrich unless otherwise noted. Laminin (CACB354232) was purchased from VWR Scientific. Dulbecco’s modified Eagle medium (DMEM, cat# 10569-010 & 10567-014), fetal calf serum and antibiotics (15140-122), Hoechst-33342 (H3570), and Lipofectamine 3000 (L3000008) were sourced from Thermo Fisher Scientific. Paraformaldehyde (RT-15710) was obtained from Electron Microscopy Sciences (Hatfield, PA). Normal goat serum (G9023) was obtained from EMD Millipore. Dulbecco’s phosphate-buffered solution (PBS) (in mM: 2.67 KCl, 1.47 KH2PO4, 138 NaCl, and 8.1 NaH2PO4) was used. Additional reagents are described as they are used in the specific methods sections. Abbreviations: ΔΨm: mitochondrial membrane potential, AA: antimycin A, ANOVA: analysis of variance, ACTB: beta actin, CPEO: chronic progressive external ophthalmoplegia, ddPCR: droplet digital PCR, DMEM: Dulbecco’s modified Eagle’s medium, DM: differentiation media, dsDNA: double-stranded DNA, ERK: extracellular signal-regulated kinase, EGFP: enhanced green fluorescence protein, FBS: fetal bovine serum, FCCP: carbonyl cyanide 4-(trifluoromethoxy)phenylhydrazone, Fiji: Fiji is just ImageJ, FOV: field of view, GFP: green fluorescent protein, GM: growth media, H2B-RFP: histone 2B red fluorescent protein, IKKα/ß: IkappaB kinase α/ß, MAPK: mitogen-activated protein kinase, mCN: mitochondria DNA copy number, MELAS: mitochondrial encephalomyopathy with lactic acidosis and stroke-like episodes, mtDNA: mitochondrial DNA, N1098I: POLG p.Asn1098Ile variant, NCBI: National Center for Biotechnology Information, ND1: mitochondrially encoded NADH dehydrogenase 1, NEB: New England Biolabs, NLS: nuclear localization sequence, OCR: oxygen consumption rate, Oligo: oligomycin A, PBS: phosphate-buffered solution, PCR: polymerase chain reaction, PFA: paraformaldehyde, POLG: polymerase gamma, R964C: POLG p.Arg964Cys variant, R1138C: POLG p.Arg1138Cys variant, ROI: region of interest, ROS: radical oxygen species, TLR9: toll-like receptor 9, TMRM: tetramethylrhodamine methyl ester, VUS: variant of unknown significance, WT: wild-type gene, and Y955C: POLG p.Tyr955Cys variant.
2.2 Cell culture and transfectionHeLa cells stably co-expressing a chromatin marker (H2B-RFP) were generously sourced from the Gerlich lab (Institute of Molecular Biotechnology of the Austrian Academy of Sciences) (Steigemann et al., 2009). A7r5 cells were purchased from the American Type Culture Collection (ATCC, CRL-1444). Prior to experiments with A7r5 and HeLa cells, cultures were tested for mycoplasma contamination with the Mycoplasma PCR Detection Kit (ABM, G238) and were confirmed to be mycoplasma-free. Cells were grown at 37°C in a humidified 5% CO2 incubator with antibiotic-free DMEM (Gibco, 10569-010) supplemented with 10% fetal bovine serum (FBS) (Seradigm, 89510-186 or Corning, 35-077-CV) for growth media (GM) (Kim et al., 2021). The A7r5 differentiation medium (DM) was the low-glucose (1 g/L) variation of DMEM (10567-014) supplemented with 1% FBS, as previously described (Kim et al., 2021). Stable transfection of HeLa-H2B-RFP was maintained with 0.5 μg/mL puromycin (ABM, G264) selection antibiotic, and HeLa cells were grown in GM or in the same media with 1% serum (DM). Cells were passaged at ∼80% confluency, and all experiments were performed between passages 5 and 25 for A7r5 and 11 and 36 for HeLa. Cells were seeded on multi-well plates, allowed to attach for 24 h, and then transfected the following day with 0.2 µg (96-well), 1 µg (24-well), or 3.75 µg (6-well) of DNA per well using a 1:1 ratio of Lipofectamine 3000 (Invitrogen, L3000-008) and a 1 µg: 2 µL DNA: P3000 ratio for 24 h (or 6 h for Figure 8) before the medium was replaced with fresh GM or DM. The number of replicate wells that were transfected is given in figure legends. To assess the impact of over-expression of wild-type POLG, in most experiments, untransfected wells were also observed as a form of negative control.
2.3 Molecular cloningWe introduced variants into the human POLG (NM_002693) coding sequence on a pCMV6 backbone (RC204456, OriGene) using the Q5® Site-Directed Mutagenesis Kit (E0552S, New England Biolabs (NEB)). First, 12.5 µL of the master mix was combined with ∼1 ng of plasmid DNA and 10 µM forward and reverse primers (see Table 1) with nuclear-free water to make up the volume to 25 µL, followed by thermocycling at 98°C 30 s (activate hot start polymerase), and then 25 cycles of 98°C 10 s, Tm 30 s, 72°C 300 s (30 s/kb) and then 72°C for 120 s. The PCR product (1 µL) was combined with 5 µL of 2x KLD (kinase, ligase, and DpnI) buffer, 1 µL of KLD enzyme mix, and 3 µL of nuclease-free water, which was mixed by trituration and incubated at room temperature for 5 min before being transformed into high-efficiency NEB 5-alpha competent E. coli by heat shock treatment and plating on kanamycin+ (50 μg/mL) agar plates. Plasmid DNA was extracted from 2 to 4 colonies (Qiagen DNEasy miniprep) and sent for Sanger sequencing (Genewiz). We amplified two mutant colonies to create plasmid stocks with an endotoxin-removing Midiprep kit (E.Z.N.A.® Endo-Free Plasmid DNA Midi Kit Cat #D6915-03 or Promega PureYield Midiprep Cat # PR-A2492).

Table 1. Cloning primers.
To create POLG-expression constructs with self-cleaving nuclear-targeted EGPF, we cloned the POLG (or variants) coding sequences and a P2AT2A (Addgene 87829) sequence 5′ of the EGFP3xNLS on pEGFP-C1 EGFP-3XNLS (Addgene 58468) by Gibson assembly. The POLG sequence, P2AT2A sequence, and pEGFP-C1 EGFP-3xNLS backbone were separately amplified with primers (10 µM) designed using NCBI’s primer blast (Table 1) and Q5® Hot Start High-Fidelity 2X Master Mix (M0494S) in 25 µL reactions using 10 ng of the template and 34 cycles of the annealing temperatures listed in Table 1. Amplicons were verified for the correct size by agarose gel electrophoresis and sequenced by Sanger sequencing (Genewiz). We amplified these amplicons with primers containing overlapping sequences for Gibson assembly (Table 1) and combined the column purified fragments at a ratio of 1:1:5 (backbone: POLG: P2AT2A) using NEB’s Gibson Assembly Master Mix (E2611S). Bacterial transformation, sequence verification, and plasmid amplification were performed as described for site-directed mutagenesis.
2.4 IncuCyte live-cell imagingWe plated cells on clear 24-well plates or Greiner 96-well plates (655 090) as illustrated in the relevant figures and loaded cells with either 0.5 µM SiR-DNA (Cytoskeleton, CY-SC007) or a 3000x dilution of SPY-650 DNA (Cytoskeleton, CY-SC501) 2–3 h before beginning multi-day imaging with an IncuCyte (Sartorius, 2022A Rev1) imaging system. We collected images at ×10 magnification (1.24 µm/pixel) with green (GFP), orange (H2B-RFP), and near infra-red (far-red nuclear dyes) filters. Imaging continued for 2–3 days at 20- to 30-min intervals. After live-cell imaging was complete, we fixed cells with 4% paraformaldehyde (PFA) and washed and stored them in phosphate-buffered solution (PBS) for future imaging to determine the transfection efficiency. Uncalibrated 16-bit images were exported, compiled into time lapse stacks in Fiji, the nuclei were segmented using StarDist, and we used an ImageJ macro to extract nuclear intensity information for all imaged channels. HeLa cells were segmented with the Versatile Fluorescent Nuclei model, and A7r5 cells were segmented with a custom-trained model based on the Versatile Fluorescent Nuclei model. Nuclear ROIs were filtered for the minimal and maximal size and intensity, and ROIs passing these criteria were summarized at the level of the number of cells per FOV per frame using a custom-written JMP script that fit the growth curves to a 3-parameter exponential growth model (cell number = plateau x ekt), where t = time, k = growth rate, and doubling time is then ln (2)/k.
2.5 Nikon live-cell and fixed imagingWe imaged multi-well plates and slides with a motorized Nikon TiE microscope with an Andor Zyla 5.5 sCMOS camera, Sutter Lambda XL light source, and Lambda 10-3 shutters and filter wheels. Dyes were selectively imaged with a quad-band Sedat filter set with excitation and emission filters on separate wheels and a quad-band dichroic (DA/FI/TR/Cy5-4X4M-C-000, Semrock) (Kim et al., 2021). Imaging bands are optimized for Hoechst, GFP/Alexa488, TMRM/Alexa555/MitoSOX, and Alex647. The Nikon Imaging Systems (NIS) Elements software (v4.51.01) controlled image acquisition using Nikon’s Jobs to automate multi-well plate imaging. We imaged cells with a 10 × 0.4 NA objective or a ×20 Super Fluor 0.75 NA objective. Over the course of our experiments, cells were seeded at densities ranging from 1,000–4,000 cells per well on a 96-well plate (29–118 cells/mm2). For TMRM and MitoSOX experiments, cells were plated at 7,000 cells per well. For analyses of drug treatment on POLG’s mitogenic effects, cells were plated at 2,000 cells per well. For drug treatments, drugs were diluted at least 1,000-fold from stock solutions dissolved in water [indomethacin (I7378, Sigma-Aldrich), MitoTempol (ab144644, Abcam)] or DMSO [wedelolactone (W4016, Sigma-Aldrich), PD 98059 (513000, EMD Millipore)]. Vehicle controls were not included as growth effects of POLG variants were compared to wild-type transfected cells.
2.6 ImmunocytochemistryA7r5 cells were plated on 96-well plates (Greiner, 655090) at 1,000–4,000 cells/well or glass coverslips (Fisher Scientific, 12-545-80) treated with 1 M hydrochloric acid (Sigma-Aldrich, 258148) and coated with 50 μg/mL Poly-L-lysine (MilliporeSigma, P2636) and 10 μg/mL laminin (Corning, 354232) that were plated in 24-well plates at 50,000 cells/well. Cells were transfected and assayed 48–72 h after removal of transfection mixtures. We fixed cells with 4% PFA in PBS and permeabilized with 0.1% Triton X-100 (Sigma, T8787-100 mL) and blocked with 2% goat serum (EMD Millipore S-26-100 mL) with 1% bovine serum albumin (Sigma, A-7960) before being stained with anti-DNA (Millipore, CBL186, 1:300) and/or anti-Myc (4A6 clone, EMD Millipore 05-724, 1:500-1:1000) or anti-Flag M2 (Sigma, 1804, 1:500-1:1000) overnight at 4°C. Primary antibodies were labeled with 1:1000 dilutions of goat-anti-mouse IgM Alexa 488 (Thermo, A21042) or 1:1000 dilution of goat-anti-mouse IgG1 Alexa-647 (Thermo, A21240).
2.7 Mitochondrial membrane potential and mitochondrial ROS productionWe plated cells on 96-well plates at 6,000 cells/well and transfected them with 0.15–0.20 µg DNA (pPOLG:P2AT2A:EGFP3xNLS or the Y955C or R964C variants) the following day with a 1:1 ratio of Lipofectamine 3000, as mentioned above. Additional wells were not transfected as negative controls. Media was replaced with fresh GM the following day (∼24 h post-transfection), and cells were stained and imaged ∼48 h post-transfection. We labeled cells with 25–50 nM tetramethylrhodamine methyl ester (TMRM) (Thermo, T6668) and 3 μg/mL Hoechst 33342 (Thermo, H3570) in HEPES-buffered saline (in mM: 140 NaCl, 5 KCl, 2 CaCl2, 1.5 MgCl2, 10 glucose, and 10 HEPES, at pH 7.4) for 30 min in a 37°C cell culture incubator prior to imaging. Preliminary experiments indicated that TMRM quenching was not evident below 300 nM TMRM (not shown). We treated cells with 0.3 µM carbonyl cyanide 4-(trifluoromethoxy)phenylhydrazone (FCCP) (Sigma, C2920) or 10 µM oligomycin (Sigma, O4876), as indicated in figures. Drugs were present during pre-labeling and imaging. We measured mitochondrial ROS in parallel with mitochondrial membrane potential on additional 96-well plates, while labeling cells with 5 µM MitoSOX (Thermo, M36008) in HEPES-buffered saline for 30 min before imaging. We included 1 µM antimycin A (Sigma, A8674) at the time of dye addition. We imaged plates on the Nikon TiE microscope with the ×20 Super Fluor objective in a microscope enclosure that was heated to 30–32°C. We automatically acquired six predefined, unbiased fields of view in quadruplicate wells using the Nikon Perfect Focus system and NIS Elements Jobs for automated acquisition. The fluorescence intensity was analyzed as described in the Image Analysis section. Briefly, we created nuclear regions of interest based on intensity thresholds and expanded these ROIs to the lesser of 133 µm or equidistant boarders (i.e., Voronoi tessellation boundaries) from nuclear edges. In preliminary experiments, cells were imaged every 30 min for 5 h, and results in the first 30 min were comparable to those at 5 hours.
2.8 SeahorseWe determined the optimal plating density range in preliminary experiments (Supplementary Figure S4). For POLG analyses, A7r5 cells were plated in 6-well plates at 250,000–300,000 cells/well in GM and transfected the next day (pPOLG:P2AT2A:EGFP3xNLS or the Y955C or R964C variants) to achieve high transfection efficiency, while minimizing cell death. At 24-h post-transfection, the cells were passaged from the 6-well plate into uncoated Seahorse XF96 microplates (Agilent, 101085-004) at a density of 10,000 cells/well in GM or DM supplemented with CloneR2 (STEMCELL Technologies, 100-0691) to support cell survival and attachment. After 2 days of growth, cells were changed to Seahorse XF DMEM assay medium (Agilent Technologies, 103575-100) supplemented with 10 mM glucose, 1 mM pyruvate, and 2 mM L-glutamine and incubated for 1 hour in a 37°C non-CO2 incubator. We assessed the oxygen consumption rate (OCR) using the Seahorse XF Cell Mito Stress Test (Agilent, 103015-100) on a XFe96 Extracellular Flux Analyzer (Agilent) at 3-min increments starting at baseline, followed by the sequential addition of 1 µM oligomycin, 1 µM FCCP, and 1 µM rotenone/antimycin-A. The cells were then fixed with 4% PFA, stained with 3 μg/mL Hoechst-33342, and imaged at five locations per well with a ×20 objective on the Nikon TiE microscope to normalize the OCR per cell.
2.9 Image analysisWe performed all image analyses using Fiji (Schindelin et al., 2012). For Nikon-acquired images, automated cell segmentation employed threshold-based selection of Hoechst-labeled nuclei and expansion of nuclear ROIs by Voronoi tessellation, as we have previously described (Kim et al., 2021). We employed our custom Fiji macro roiBatchAnalysis_v3.8.ijm (https://github.com/dpoburko/ImageJ_macros/blob/master/roiBatchAnalysis_v3.8.ijm). We used a rolling background subtraction with a radius 1.5 times the largest expected nuclear diameter (∼50 µm for A7r5) and applied a single-intensity threshold for all images acquired in a single set-up staining that captured the maximal number of nuclei, while minimizing the coalescence of neighboring nuclei. We created ROIs surrounding but not including cell nuclei by dilating nuclear ROIs and excluding the inner nuclear ROI with the maximum dilation described in the Results section. Where basal background intensity needed to be ignored, the macro analyzed 32-bit images with pixels below a user-defined threshold set to not-a-number. For a batch (folder) of images, all ROIs for each cell (based on its nucleus) are saved to a single row of a .csv file for downstream analysis in JMP. For movies generated from the IncuCyte, we generated nuclear ROIs using the StarDist plugin for Fiji (Schmidt et al., 2018; Weigert and Schmidt, 2022), which was implemented using a custom-written macro to analyze folders of multi-frame images.
2.10 Droplet digital PCRWe performed droplet digital PCR (ddPCR) as described in Li et al. (2018). We extracted total genomic DNA from A7r5 and HeLa cells with a DNeasy Blood & Tissue Kit (Qiagen, 69504). PCRs contained 2–4 ng of genomic DNA, 1 µL of HindIII restriction enzyme (Thermo, FD0504), 2 µL of pre-mixed forward and reverse primers for each target at 12.5x the final concentration, 12.5 µL QX200 ddPCR EvaGreen Supermix (Bio-Rad, #1864034), and DNAse-free water to make up 25-µL reactions. Primer specificity was assessed by UCSC’s in silico PCR server (https://genome.ucsc.edu/cgi-bin/hgPcr) and by the amplification of a single population of droplet intensity. The final concentration of primers was 25 nM for ND1 and 180 nM for ACTB. See Table 1 for primer sequences. We cycled reactions in a C1000 touch thermocycler (Bio-Rad) using the protocol: 95°C for 5 min (HotStart), 40 cycles of 95°C for 30 s → 54°C for 90 s, 4°C for 5 min (stabilization), 90°C for 5 min (inactivation), and hold at 4°C. Reaction plates were cooled to room temperature or kept at 4°C overnight before reading on the QX200 droplet reader. For duplex reactions, positive droplets were gated in the 2D view using Quantsoft (v1.7).
2.11 Data processing, statistical analysis, and figure generationNumerical data were compiled and analyzed using JMP® (version 17.0.0, SAS Institute Inc., Cary, NC, 1989–2023). We used JMP’s ANOVA platform to perform one-way and factorial ANOVAs, with Dunnett post hoc tests to compare means against a control level, Tukey’s Honest Significant Difference test for adjusted, pair-wise comparisons, and linear contrasts (with Bonferroni adjustment) for comparisons of specific means in factorial ANOVAs. Results of ANOVAs in the text report least square mean values ± standard error. Figures show individual data points, with means shown as the thick, colored line and box plots with median (line), quartiles (box), and 1.5 times the interquartile range. No outliers were removed from the analyses. Outliers are shown unless noted in figure legends. Graphics and figures were compiled in PowerPoint (Microsoft), with cartoon illustrations created in BioRender. 3D models of proteins and DNA were created in the PyMOL molecular graphics system (v 2.5.4, Schrodinger). The number of experimental replicates is described in figure legends.
3 Results3.1 Location of variants relative to pathogenic variantsTo gauge the 3-dimensional location of the investigated variants relative to known pathogenic variants, we illustrated their side chains on the crystal structure of human POLG bound to DNA (PDB: 8g5j) using PyMOL (Figures 1A, B). R1138 is the most distal from the catalytic site of the polymerase domain, while Y955, R964, and N1098 are oriented toward the nascent DNA strand. To model potential changes in the morphology of the POLG:DNA interaction, we used AlphaFold Server to predict the structure of double-stranded DNA (sequence from 8g5j) in a trimeric complex with POLG and two POLG2 subunits. The predicted structure closely matched the published crystal structure with expectedly lower certainty for more mobile portions that were not resolved in the crystal structure (Figure 1C). Y955C removes a polar contact with E895 of the neighboring helix (Figure 1D), accompanied by a predicted remodeling of polymerase domain helices and a ∼28 Å shift of the 1,056–1,066 helix (Figure 1D, opaque red vs. transparent red for WT) into the catalytic site. The R964C variant showed little obvious structural change, where DNA-interacting residues (shown in yellow) appear to maintain their relationship with the DNA strand (Figure 1E). In three of five AlphaFold models, substitution of the polar N1098 with hydrophobic I1098 caused the 1,056–1,066 helix to move from the exterior aspect of the polymerase domain into the active site of the polymerase domain (Figure 1F, opaque red helix vs. transparent). By comparison, when we modeled the disease-associated N1098K, the top two models showed little change in the morphology of the catalytic site, lateral displacement, or disruption of the 328–336 helix in two models (shown in orange in Figures 1E, G) along with shallower seating of the DNA strand, and obstruction of the active site by the 1,056–1,065 helix in the fifth model (Supplementary Figure 1). AlphaFold showed modest variations in the low-certainty, lateral aspect of the polymerase domain for the R1138C variants but did not predict clear changes within the catalytic site (Figure 1G).
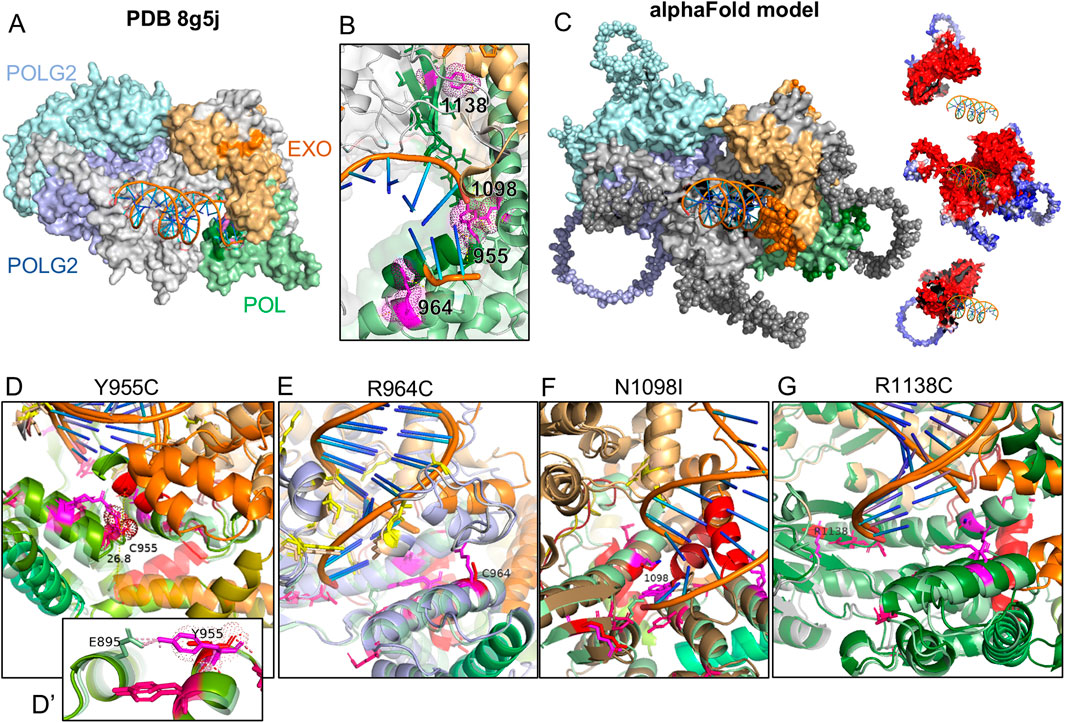
Figure 1. AlphaFold modeling of POLG variants and impact on the POLG/POLG2/dsDNA complex. (A) Crystal structure PDB8g5j of the human POLG holoenzyme complexed with DNA. (B) Zoomed view of the catalytic domain and residues of interest (magenta). Blues: POLG2s, gray: POLG, orange: POLG exonuclease domain, green: polymerase domain. (C) AlphaFold-predicted structure of human POLG (NP_001119603) complexed with two POLG2 subunits (NP_009146) and a short sequence of DNA. Residues shown as spheres were presumably too mobile to be resolved in the crystal structure. Insets of POLG and POLG2s illustrate model confidence (blue low; red high). (D–G) Catalytic domains modeled with POLG variants. Wild-type is shown as partially transparent. WT helices between Q976 and L1083 are colored green-olive–orange–red-brick. Residues associated with PEO are shown in hot pink. The variant in each panel is shown in red, with the WT residue in magenta.
3.2 High content imaging of mtDNA and ploidy in cultured cellsWe have previously demonstrated that the A7r5 rat aorta smooth muscle cell line is a useful culture model to assess calcium signaling and phenotypic switching (Kim et al., 2021). Here, we use this model to study the effects of POLG loss-of-function variants on smooth muscle phenotype and metabolism. For end-point analyses of cell proliferation, mtDNA content, and transfection efficiency, we plated A7r5 cells on 12-mm glass coverslips or Greiner µclear 96-well plates (Greiner 655-090) and transfected them with constructs expressing Myc and FLAG®-tagged human POLG or variants created by site-directed mutagenesis. Following the post-transfection growth period, we fixed cells and immunestained them for doubled-stranded DNA (dsDNA) and the Myc or FLAG-tag on the exogenous POLG and then stained them with Hoechst-33342 to label nuclei and assess nuclear DNA content. Notably, Hoechst-33342 was not visible within mitochondria. Figure 2A shows images for the wild-type (WT) POLG and the Y955C variant. Zoomed regions illustrate dsDNA in Myc-labeled mitochondria-shaped organelles in transfected cells (Figure 2A). Myc staining of exogenous POLG correctly localized to polarized mitochondria labeled with MitoTracker Orange CMTMRos (Figure 2C). We estimated cellular levels of mtDNA by quantifying the summed intensity of dsDNA puncta per cell in Voronoi ROIs that exclude the Hoechst-defined nuclear ROIs, as previously validated (Figure 2B) (Li et al., 2018). Briefly, the distribution of puncta intensities was fitted to a 10x Gaussian distribution to estimate the mean quantal nucleoid intensity for a given experiment, and then the sum of puncta intensities per cell was divided by that value (Figure 2B).
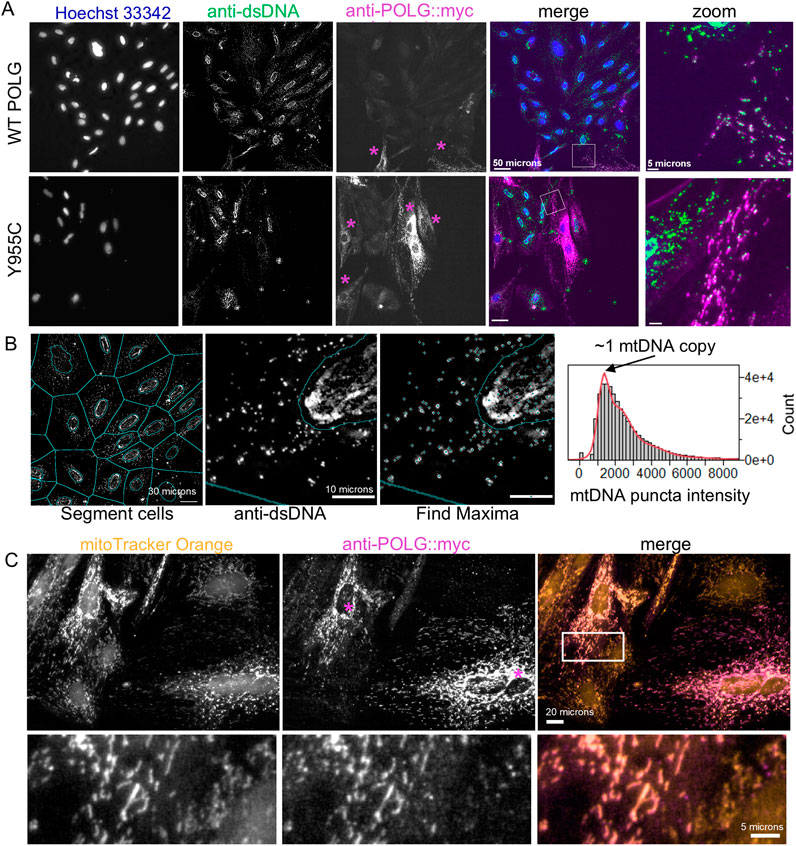
Figure 2. Image-based estimation of mitochondrial DNA copy number and localization of exogenous POLG. (A) A7r5 cells transfected with wild-type or Y955C POLG variants and then fixed and labeled with anti-dsDNA and anti-Myc (i.e., Myc-tagged POLG) and Hoechst-33342. “Zoom” panels are enlarged regions in box in “merge” panels. (B) Automatically generated cellular ROIs are generated by dilating Hoechst-defined nuclear ROIs by 4 pixels and then expanding to the edges of the Voronoi tessellation boarders with neighboring cells. dsDNA puncta are identified as local maxima and assigned to the cellular ROIs that exclude the nucleus. For each set of staining, the distribution of puncta intensities is fitted to a 10x Gaussian model, assuming that the most abundant puncta represent nucleoids with a single mtDNA copy. mCN is estimated as the puncta intensity divided by this quantal intensity. (C) A7r5 cells were stained with MitoTracker Orange (50 nM) and then fixed and labeled with the anti-Myc antibody to confirm that exogenous POLG is localized to the mitochondria, as expected. In (A, C), purple asterisks indicate cells that are immune-reactive for Myc (POLG).
3.3 POLG variants induce a mitogenic effect that is proportional to the loss of mtDNA in end-point analysesWe hypothesized that over-expression of loss-of-function POLG variants would reduce mCN in transfected cells and influence their cell-cycle activation. Figure 3A shows the experimental scheme. We normalized the cell density to the mean of WT POLG-transfected wells on each plate for each media condition. We normalized mCN in a similar fashion to minimize the plate-wise variance in mCN. Staining for cytosolic dsDNA puncta in cells in transfected cultures (combining GM and DM-treated cells) was reduced by 27% by Y955C, 20% by R964C, and 14% by N1098I over-expression (Figure 3B), while untransfected cultures showed mCN that was equivalent to WT-transfected cultures. In these same cultures, the cell density normalized to the density of WT-transfected cells on a per-experiment basis was increased by 42%–75%. Notably, untransfected cultures showed higher density than cultures transfected with WT POLG, as expected due to the toxicity and stress associated with transfection. The differences were persistent when the dataset was separated for cells grown in GM or DM (Figure 3C). While the number of experiments performed in DM was insufficient to reach significance, the trends in mCN and cell density closely matched those seen in GM.
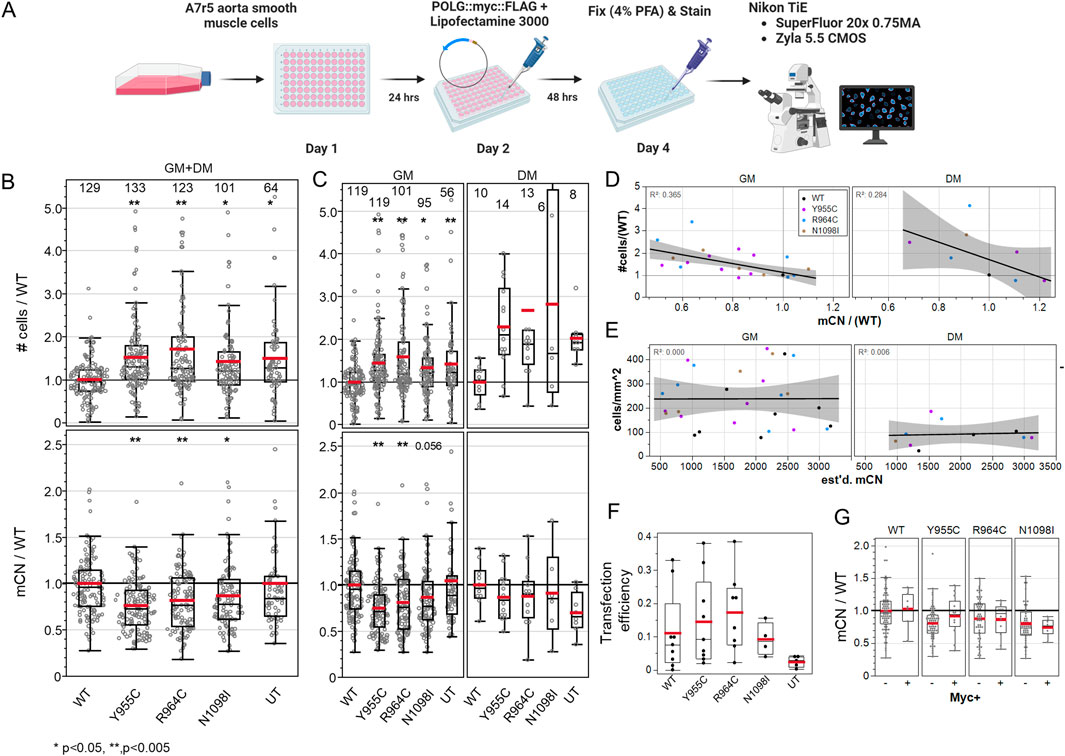
Figure 3. A7r5 cell growth and mitochondrial DNA copy number are affected by POLG variants. (A) Illustrated experimental outline. (B) Summary of all A7r5 cell density and mCN measures per field of view normalized to the mean value of wild-type fields of view per plate for each media. Numbers above columns show the number of fields of view analyzed. *p < 0.05 and **p < 0.005 for Dunnett’s post hoc tests versus wild-type. UT–untransfected. (C) Data in (B) separated by media condition. (D) Linear regression of plate-wise means of the normalized cell density as a function of normalized mCN with R2 correlation coefficients in upper left corners. GM and DM indicate media conditions. (E) Linear regression of the absolute cell density and estimated mCN. (F) Fractions of cells positive for Myc immunoreactivity. (G) Normalized mCN per FOV when split between Myc-negative and Myc-positive cells. # Cells analyzed: 25,733 in GM, 1,461 in DM. FOVs: 489 in GM, 49 in DM. Plates: 7 GM, 2 DM.
The normalized cell density correlated well with relative changes in the loss of mtDNA immunolabeling across the POLG variants at plate-level means (R2 = 0.37 GM, 0.28 DM) (Figure 3D). To assess the possibility that reduction in mCN was caused by cells being small in more dense cultures, we plotted absolute cell density against our estimates of absolute mCN and found that there was no correlation (R2 = 0.00–0.01), suggesting that mCN was not simply a function of cell density (Figure 3E). This was even more evident in the single field-of-view plot for each plate, where plates with a higher cell density did not show lower mCN (Supplementary Figure 2A). We further examined whether POLG-associated changes in mCN might be better correlated with the mean Voronoi ROI size (i.e., smaller in more dense cultures), but here, the correlation was very poor (R2 = 0.05 GM, 0.08 DM) (Supplementary Figure 2B). Finally, we examined the MitoTracker Orange staining as a measure of the total mitochondrial mass per cell, as a correlate of mCN. We employed ImageJ 32-bit thresholding that does not count sub-threshold pixels toward the total mitochondria area per cell and observed a poor correlation in GM-treated cells (R2 = 0.09) but a good correlation in a smaller sample of DM-treated cells (R2 = 0.65).
A surprising observation was the level of changes observed in mCN given the transfection efficiency (i.e., cells staining positive for the POLG-Myc tag, ∼10–20%) (Figure 3F). While we had expected extensive loss of mCN in transfected cells, we observed that the decrease in mCN staining was similar in Myc-negative and Myc-positive cells in the same wells (Figure 3G). This suggested that some form of diffusible factor could be impacting cell growth and dsDNA immunolabeling.
3.4 POLG variants did not induce signs of polyploidy or endoreduplicationCellular depletion of mtDNA to create Rho0 cells is reported to induce mitotic abnormalities and accumulation of aneuploid cells and cell-cycle dysregulation (Donthamsetty et al., 2014), but whether this occurs in cells with modest reductions in mCN is not clear. We plotted total nuclear Hoechst intensity versus nuclear size (area) to gate cellular ploidy levels, as previously described (Figure 4A) (Kim et al., 2021). Consistent with the notion that mtDNA replicates in preparation for cell division, we observed increases in the mtDNA immunoreactivity (∼20%) in cells gated as 2N and 4N cells in the S-phase (Figure 4B). Although 4N and 8N cells had increased mtDNA labeling compared to 2N cells, the increase was much less than 2-fold and 4-fold relative to 2N cells, suggesting that polyploid cells have relatively lower mCN per nuclear genome equivalent. In this experiment, we measured the changes in mCN caused by the Y955C, R964C, and N1098I variants and observed reduced mCN (on a cell-wise basis) in all gated populations, with less clear differences in the less numerous 2N and 4N S-phase cells (Figure 4C). In contrast, no difference was evident in the fraction of cells in any gated population as a function of the transfection of POLG variants (Figure 4D), whereas cells grown in differentiation media exhibited the expected increase in the fraction of cells in the S-phase and decreased fraction of cells in the G2 and M phases, as observed by the reduction in “4N” cells (Figure 4E).
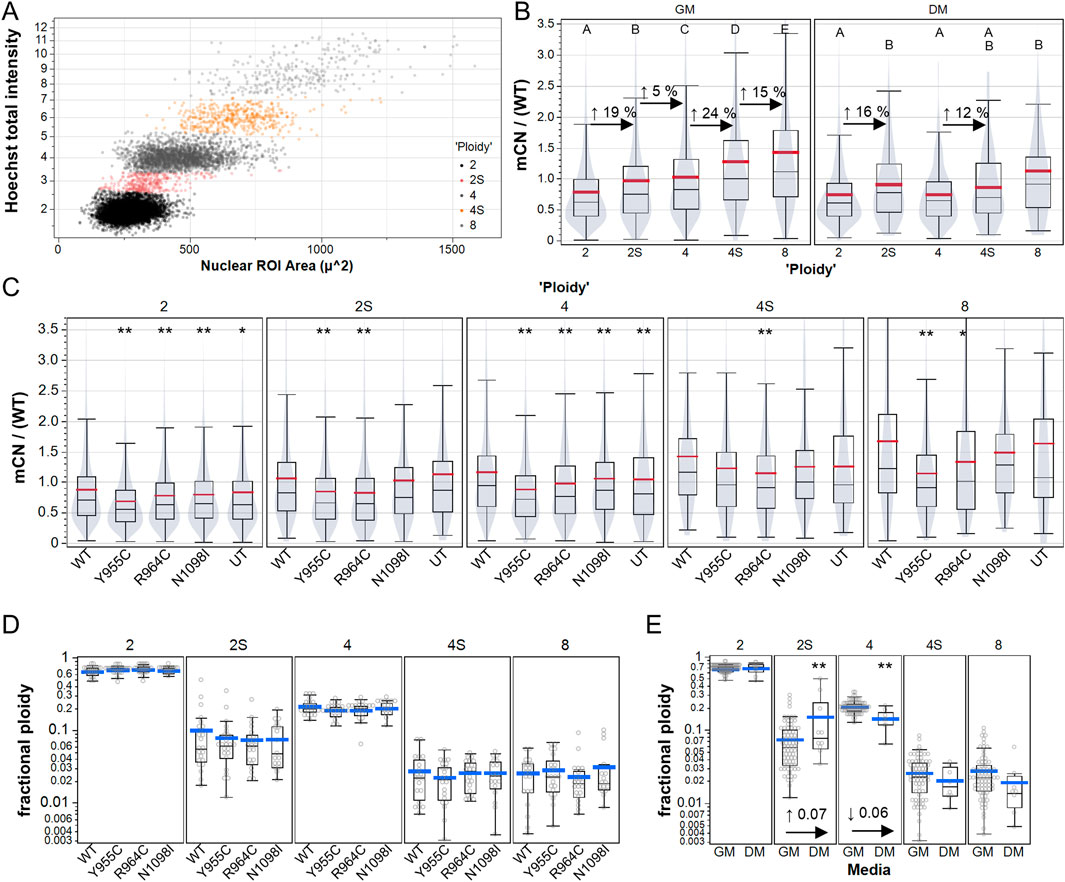
Figure 4. High content analysis of A7r5 mCN over cell cycle and polyploidy. (A) Example of manual gating of integrated Hoechst-33342 intensity and nuclear area to label A7r5 cells as follows: 2: diploid G0/G1, 2S: diploid S-phase, 4: diploid G2/M or tetraploid G0/G1, 4S: tetraploid S-phase, and 8: tetraploid G2/M or octoploid G0/G1. (B) Mitochondrial DNA copy number (mCN/WT) shown for all transfection conditions over gated cell cycle and ploidy groups. For each media condition, means that share a letter above the dataset are not different (p < 0.05) by Tukey’s honest significant different test. (C) Impact of POLG variants on mCN in each ploidy group, where ** indicates p < 0.005 for Dunnett’s post hoc tests versus wild-type. In B and C, violin plots indicate that data are summarized at the single-cell level. (D, E) Fraction of cells per field of view in each ploidy category for (D) each POLG variant and for (E) all POLG variants separated by media conditions. ** indicates p < 0.005 in comparison of DM vs. GM for each category. # Cells analyzed: 25,733 in GM, 1,461 in DM. FOVs: 489 in GM, 49 in DM. Plates: 7 GM, 2 DM.
3.5 POLG variants’ impact on the absolute mtDNA copy numberTo further validate whether the POLG variants reduced mCN, we quantified mCN by droplet digital PCR at 48 h post transfection (Figure 5A) using primers that were designed to selectively amplify rat mitochondrial ND1 and primers that target a nuclear site immediately 5′ of the ACTB gene that we previously reported to amplify three loci in the rat genome (Li et al., 2018). A 2D plot of the intensity of EvaGreen-labeled droplets revealed four distinct droplet populations: droplets with no template, with only ND1-containing DNA, with ACTB only, and with both ND1 and ACTB templates (Figure 5B). We performed a two-way ANOVA on a subset of our data, in which GM- and DM-treated cultures were isolated in parallel to assess whether WT POLG overexpression affected the absolute number of copies of mtDNA per cell. DM-treated (576 ± 53) and GM-treated (584 ± 54) cultures had equivalent absolute mCN. Similarly, mCN in cultures transfected with WT POLG (574 ± 58) was equivalent to that in untransfected cultures (587 ± 48), which were measured in technical quadruplicates from three independent experiments (Figure 5C). Notably, between-experiment variance (coefficient of variance 0.37) was greater than within-experiment variance (average CV 0.20). To assess whether POLG variants affected mCN, we normalized mCN to the WT transected values for each media condition for each experiment. As with imaging experiments, Y955 and R964C reduced mCN in GM-treated cultures by 28% ± 3% and 19% ± 3%, respectively, as assessed by one-way ANOVA, followed by a Dunnett’s test against WT as the control level. Although N1098I did not reduce mCN in either of the media, Y1138C reduced mCN in GM. In DM-treated cultures, both Y1138C and untransfected cells showed 18%–20% increases in mCN (Figure 5D).
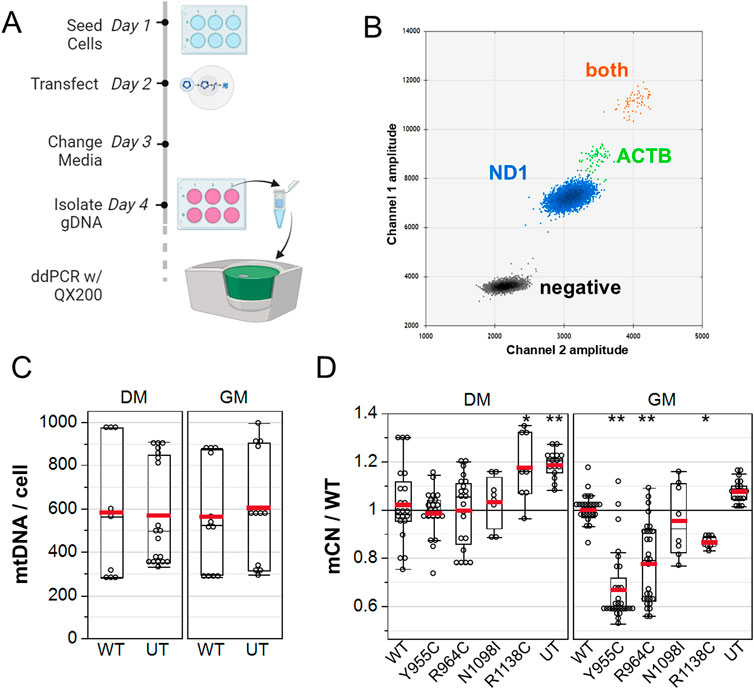
Figure 5. ddPCR analysis of A7r5 mitochondrial DNA copy number. (A) Illustration of the experimental protocol. (B) 2D droplet intensity plot of EvaGreen supermix duplex assay. Gray: –droplets containing no template. Blue: droplets with only mitochondrial DNA detected with ND1 primers. Green: droplets with only nuclear DNA detected with ACTB primers. Orange: droplets containing both mitochondrial and nuclear DNA. (C) Summary of absolute mitochondrial DNA copy number per cell for A7r5 grown in GM versus DM. (D) mCN normalized to mean WT results for each transfection condition in each media. UT is untransfected. *p < 0.05 and **p < 0.005 for Dunnett’s post hoc tests versus wild-type. Data show technical quadruplicates of seven independent experiments (two included N1098I and R1138C).
3.6 POLG variants minimally affect ΔΨmWe assessed mitochondrial membrane potential microscopically by labeling cells transfected with the pPOLG-P2AT2A-EGFP3xNLS variants with TMRM, where nuclear GFP facilitated identification of transfected cells without the need for post hoc anti-Myc/FLAG immune-labeling, where ROIs were generated and seeded again around Hoechst-stained nuclei (Figure 6A). We performed three independent experiments with technical quadruplicate wells. Visual inspection of images suggested that NLS-GFP-positive cells did not exhibit obvious mitochondrial depolarization (Figure 6A). We fit the distribution of nuclear EGFP intensity in untransfected cells with a triple Gaussian distribution and used the mean plus three standard deviations of primary distribution as the threshold to label transfected cells (Figure 6E). This indicated an average transfection efficiency of ∼25% (Figure 6E bottom panel).
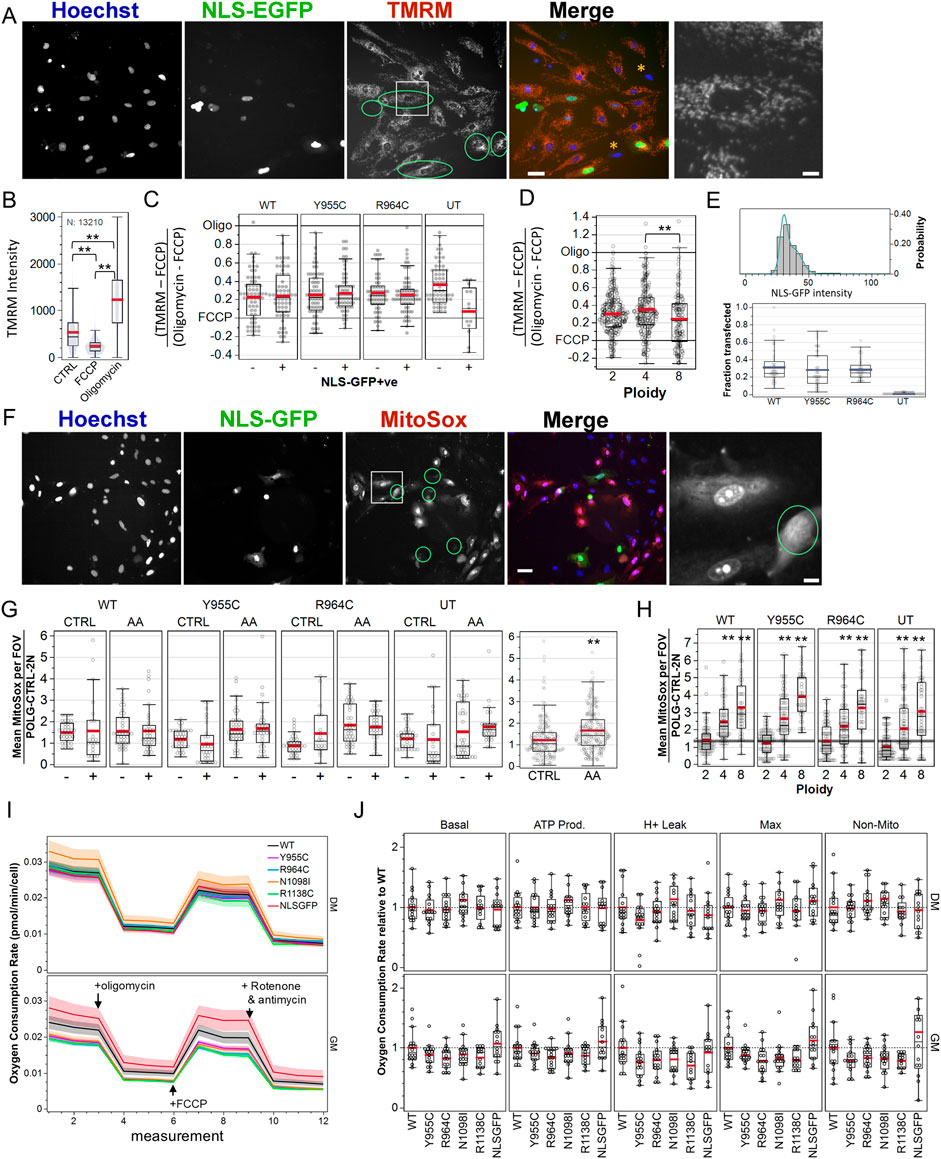
Figure 6. Loss-of-function POLG variants minimally affect mitochondrial membrane potential, ROS production, and cellular respiration in A7r5 cells. (A) Example image of A7r5 cells transfected with pPOLG:P2AT2A:EGFP3xNLS labeled with Hoechst 33342 and TMRM (25 nM) and treated with oligomycin (10 µM). The green circle overlays highlight transfected cells, and the white box is zoomed in on the far right. Orange asterisks highlight cells with minimal TMRM staining. Scale bars: 50 µm for composite images and 10 µm for zoomed images. (B) Average TMRM intensity for all 13,210 cells in one of two experimental replicates. **p < 0.005 for Tukey’s honest significant different test. (C, D) TMRM values in the control-treated well, where each cell was normalized as its TMRM intensity less the mean FCCP value and divided by the difference between the mean of oligomycin- and FCCP-treated wells. Data are compiled from four fields of view in each quadruplicate well in each of two independent experiments. (E) Example distribution of nuclear GFP mean intensity and triple Gaussian fit. Cells with mean intensity higher than mean + (3 x SD) of first Gaussian peak are defined as transfected. Summary statistics of the transfection efficiency are shown below. (F) Representative images of MitoSOX (5 µM) in cultured transfected with WT pPOLG:P2AT2A:EGFP3xNLS treated with antimycin A (1 µM). Green circle overlays represent transfected cells, and the white box is zoomed in on the far right. Scale bars: 50 µm for composite images and 10 µm for zoomed images. (G) MitoSOX intensity was measured using nuclear regions of interest and normalized to the means of control-treated, WT-transfected cells on each of two independent experiments, imaging four fields of view in each quadruplicate well. AA indicates wells treated with antimycin A (1 µM) to stimulate ROS production. **p < 0.005 for two-sample t-test. (H) Data in (G) are re-plotted by simplified cell ploidy. ** indicates p < 0.005 for Dunnett’s post hoc tests versus 2N. (I) A7r5 oxygen consumption rates per cell in Seahorse XFe Mito Stress Test. Lines show mean plus standard error bands for two independent experiments with 6–8 technical replicates each. Oligomycin (1 µM), FCCP (1 µM), rotenone, and antimycin A (1 µM) were added, as indicated with the arrows. (J) Oxygen consumption rate normalized to POLG separately for GM and DM conditions. One outlier ( > 3) in the GM for non-mitochondrial OCR for NLSGFP (4.283) and one well corresponding to five points in N1098I DM were removed for clarity but not removed from statistical analysis. For each experimental paradigm (TMRM, MitoSOX, and Seahorse), data show the results of two independent experiments, with technical quadruplicate wells for TMRM and MitoSOX and eight technical replicates per Seahorse plate.
Separate wells contained untreated cells and cells treated with FCCP (0.3 µM) to depolarize mitochondria and oligomycin (10 µM) to inhibit the F1F0-ATP synthase and hyperpolarize ΔΨm (Figure 6B). We then normalized TMRM 32-bit thresholded intensity in control wells to the mean value of wells treated with FCCP and oligomycin for each of three independent experiments to account for plate-wise differences in the TMRM intensity (Figure 6C). We restricted the analysis to cells that were gated for ploidy 2N–8N and summarized the normalized TMRM values by field of view (FOV) and performed a two-way ANOVA with POLG variants and NLS-GFP expression (i.e., + or –) as random-effects variables. The POLG variant was not a significant factor (p = 0.76), with least square mean ± standard error of WT 0.23 ± 0.02, Y955C 0.26 ± 0.02, R964C 0.27 ± 0.02, and untransfected 0.22 ± 0.04. Retrospective power analysis indicated that a difference of 0.04 would be 50% likely to be detected, suggesting that the absence of differences was unlikely due to the underpowered experiment. There was a significant interaction effect between the POLG variant and NLS-GFP labeling (p < 0.001). Linear contrasts failed to detect differences between NLS-GFP + or – cells for POLG, Y955C, or R964C (p > 0.4 for each). Instead, we found a difference between untransfected cells (NLS-GFP negative vs. the small number of false-positives). Thus, POLG variants did not affect ΔΨm.
We made two notable ancillary observations. First, approximately 50% of the cells in most fields of view in transfected wells (∼30% in untransfected wells) showed less TMRM staining that was unrelated to nuclear size (i.e., not coincident with apoptotic nuclear condensation) and not associated with Hoechst staining intensity (i.e., probably not linked to cell cycle). These are indicated by orange asterisks in Figure 6A. Second, TMRM staining intensity in 4N cells was marginally (but not statistically) higher than that in 2N cells, but significantly higher than that in 8N cells (Figure 6D). The 4N population includes both genuinely tetraploid cells and diploid cells in the G2/M phase, with the latter being a majority of this population and presumably accounting for this elevation.
3.7 POLG variants do not increase ROS productionMitochondrial dysfunction is often assumed to result in excess production of radical oxygen species (ROS). We assessed ROS production microscopically by labeling cells transfected with the pPOLG-P2AT2A-EGFP3xNLS variants with MitoSOX and Hoechst labeling (Figure 6F). We performed two independent experiments with technical quadruplicate wells. As a positive control to stimulate ROS production, an equal number of wells served as the control or were treated with 20 µM antimycin A (AA) to inhibit complex III. Again, results were summarized at the level of cell means per FOV, where FOV values were normalized to the per plate mean of the WT-transfected, control-treated, 2N cells. Due to the high concentration of MitoSOX used (5 µM), the majority of the signal was localized to the cell nucleus. We performed a three-factor ANOVA for variant, NLS-GFP positivity, and drug treatment (control vs. AA). Variant (p = 0.39) and NLS-GFP positivity (p = 0.37) did not affect MitoSOX intensity. Drug treatment significantly affected ROS (p < 0.0001), with control values at 1.22 ± 0.06 and antimycin A at 1.66 ± 0.05 (Figure 6G right panel). A significant interaction between drug treatment and variant (p = 0.038) was largely due to the significant difference between MitoSOX signal in control-treated and antimycin A-treated Y955C- and R964C-transfected groups (Tukey’s honest significant difference test, p < 0.05).
As with TMRM, MitoSOX labeling was negligible in some cells and high in others (examples in Figure 6F). In a three-factor ANOVA drug treatment (p < 0.0001), NLS-GFP positivity (p = 0.004), drug x plasmid (p = 0.001), and drug x NLS positivity (0.0002) were significant factors or interactions in the fraction of cells gated as “high” for MitoSOX (i.e., above background intensity). “Plasmid” was a marginal factor (p = 0.059) [data not shown]. Control-treated cells were 50.2% ± 2.1% high vs 62.2% ± 2.0% in AA-treated cells, while NLS-GFP-positive cells were 59.5% ± 2.0% high vs 51% ± 2.2% for GFP-negative cells. Notably, WT-transfected cultures (61.0% ± 3.0% high) had a larger fraction of cells with high MitoSOX labelling than Y955C (52.7% ± 2.7% high), R964C (57.3% ± 2.9%), or untransfected (50.6% ± 3.0%) cultures. Overall, this analysis indicated that over-expressing Y955C or R964C did not result in elevated ROS generation, specifically in the transfected cells or in their neighboring cells.
However, we did observe that elevated mean MitoSOX intensities (in nuclear ROIs) were pronounced in 4N and 8N cells relative to 2N cells (Figure 6H). Here, cell means were additionally summarized by ploidy level. Neither plasmid (p = 0.29) nor plasmid–ploidy (p = 0.24) were significant factors in a two-way ANOVA, while ploidy (p < 0.0001) was a significant factor for MitoSOX intensity. Normalized MitoSOX intensities for 2N, 4N, and 8N were 0.95 ± 0.08, 2.05 ± 0.08, and 2.64 ± 0.10, respectively, in control-treated cells. This illustrated the assay’s ability to detect differences in cellular ROS production.
3.8 POLG variants do not impair population-level cellular respirationThe Seahorse XF Cell Mito Stress Test allowed us to explore the effect of the POLG variants on key parameters of mitochondrial metabolism in A7r5 VSMCs by sequentially inhibiting the ATP synthase activity, uncoupling respiration, and then inhibiting complexes I and III to measure basal respiration, ATP-linked respiration, proton leak, maximal respiration, and non-mitochondrial oxygen consumption (Figure 6I). We normalized these metrics for cell density, counting post hoc Hoechst and NLS-GFP labeled nuclei using the Nikon TiE. The average cellular density was greater in GM conditions compared to DM conditions, with the transfection efficiency remaining consistent with those of previous experiments, at approximately 20% (Supplementary Figure 4A, C). Metabolic measurements were stable over a wide range of cellular plating densities (Supplementary Figure 4B). Additionally, baseline OCR, when normalized per cell, was comparable between plasmids and showed a slight increase in DM conditions (Supplementary Figure 4C). This may indicate a shift toward a more oxidative phenotype in the “low” (5 mM) glucose media. To further compare between transfection conditions, we normalized OCR measures to the WT mean per plate for each media condition and compared the OCR as a function of transfected plasmids by one-way ANOVA for each category of respiration by media (Figure 6J, six outliers > 2.3 for NLS-GFP GM and N1098I DM are not shown). While mean values for POLG variants tended to average ∼10–20% below the WT-transfected conditions, for those groups with an ANOVA p-value <0.05 (GM: basal OCR p = 0.026, ATP production p = 0.02, max. respiration p = 0.002, and non-mitochondrial resp. p = 0.04), post hoc Dunnett’s tests against WT failed to show any differences between WT and the POLG variants.
To further assess the collective effect of the POLG variants, we compared WT OCR values to those of the variants for each media condition (Supplementary
Comments (0)