Experimental animal, cell culture, and transfection
Adult lampreys (Lethenteron reissneri) were captured at the Yalu River, Liaoning Province in China and cultured in the circulating water of a laboratory aquarium at 4 °C. The experimental treatment of lampreys and all of the experimental procedures received approval from the Animal Welfare and Research Ethics Committee of the Institute of Liaoning Normal University (Permit number: LL2024007).
The HEK293T cell line was purchased from the ATCC cell bank (Manassas, VA) and cultured in RPMI-1640 medium (Hyclone, South Logan, UT, USA) supplemented with 10% (v/v) fetal bovine serum (GIBCO, USA). The cells should be placed in a humid incubator with 5% CO2 at 37 °C to grow. According to the instruction, plasmids and DNA were transiently transfected into HEK293T cells using Lip3000 P3000 (Molecular, USA).
Cloning of Lr_AFF3 gene and expression plasmids
The H_AFF family members were identified through the Ensembl database (https://asia.ensembl.org/index.html), and their homologous protein sequences were obtained from the NCBI protein database (https://www.ncbi.nlm.nih.gov/). On the basis of these protein sequences, querying is done by using blast-p in our laboratory’s L. reissneri database and obtaining the Lr_AFF3 sequences of high relevance. Finally, identifying the Lr_AFF3 sequences is done through the Basic Local Alignment Search Tool (BLAST) from NCBI.
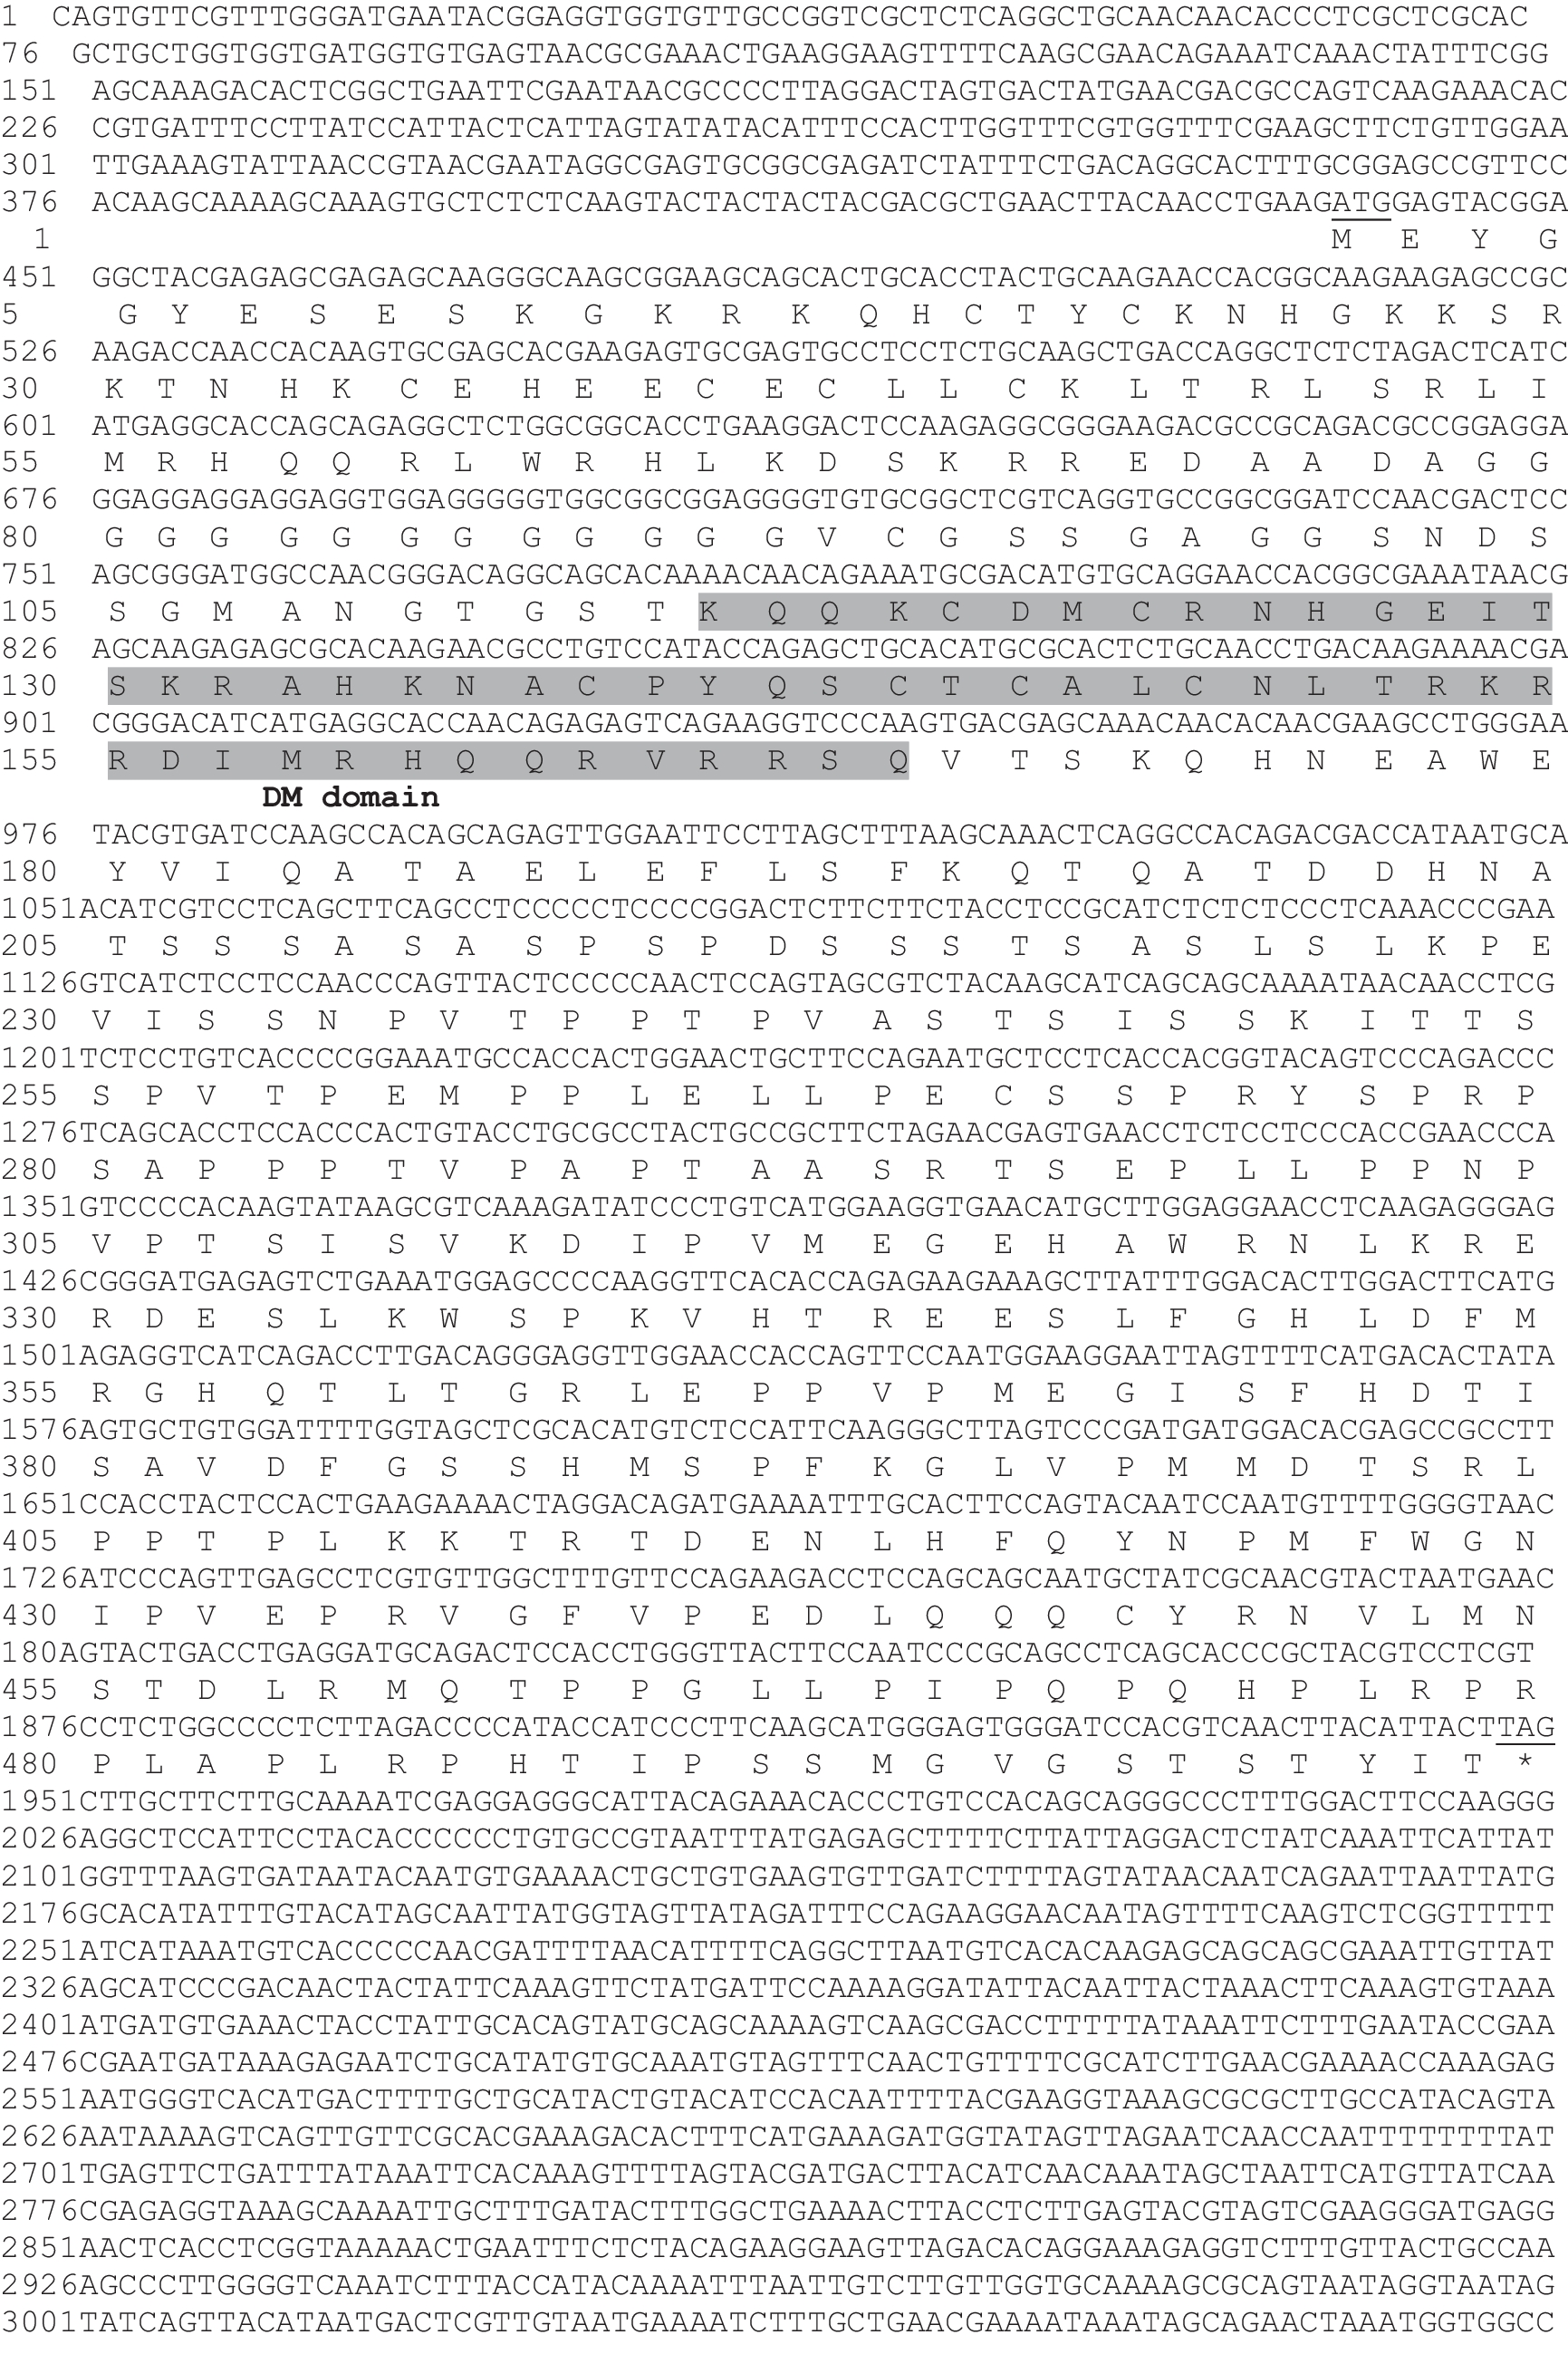
To obtain a full-length open reading frame (ORF), total RNA was first isolated from the tissues of lamprey with the help of RNAiso (TaKaRa Biotechnology, Dalian, China) reagent. The total RNA was then transcribed into cDNA. Finally, the ORF sequence of Lr_AFF3 was obtained using specific primers (Table 1) (TaKaRa Biotechnology, Dalian, China). For the expression of Lr_AFF3 in HEK293T cells, PCR fragments encoding for 182–560 aa of NHD, 1457–1744 aa of CHD and 1–1744 aa Lr_AFF3 fused with the 3′Flag tag were inserted into pcDNA3.1( +) (Invitrogen) and designated pcDNA3.1-Flag-Lr_NHD, pcDNA3.1-Flag-Lr_CHD, and pcDNA3.1-Flag-Lr_AFF3, respectively (Table 1).
Table 1 List of PCR primers in this studyPhylogenetic analysis, conserved motif, and domain analysis
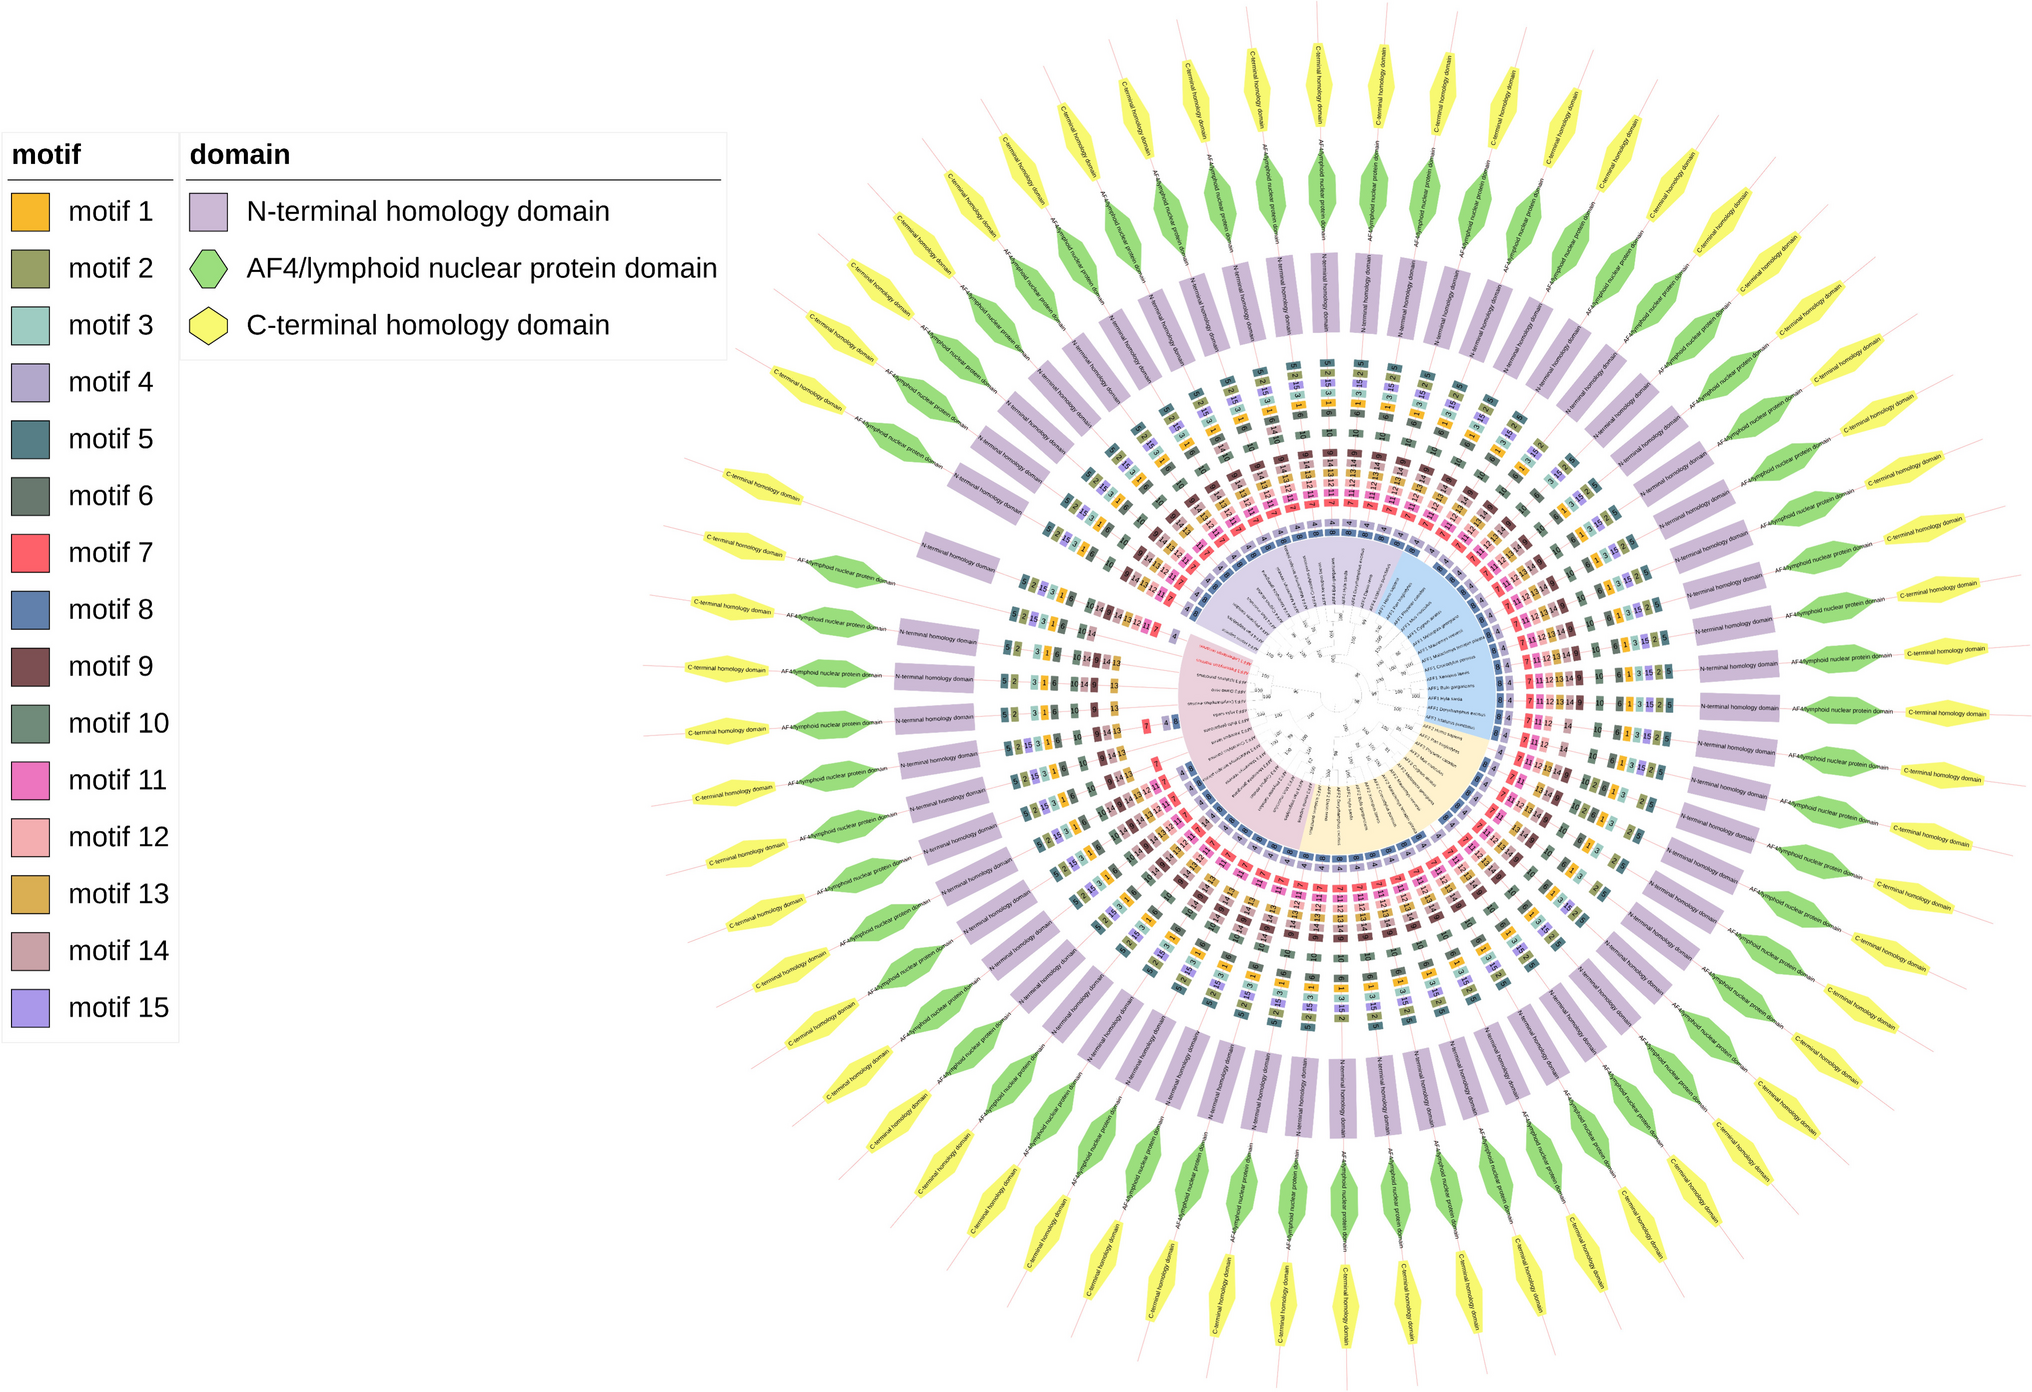
Phylogenetic analysis was conducted on AFF protein sequences from various species retrieved from the protein database of NCBI (https://www.ncbi.nlm.nih.gov/) (Supplementary Table 1). Constructing the phylogenetic tree of the AFF family is done by using the Neighbor-joining method (Saitou and Nei 1987) of MEGA 7.0.26 software (Kumar et al. 2018). The conserved motifs of the AFF proteins were analyzed through MEME version 5.5.3 (https://meme-suite.org/meme/index.html), selecting 15 motifs as the basic parameters. The use of the TBtools software obtains the imaged information of the conserved motifs. The use of Online SMART (http://smart.embl-heidelberg.de/) and Conserved Domain Search Service (CD Search) from NCBI predicts conserved protein domains. In the end, the beautification and visualization analysis of the figure was obtained by the ITOL (https://itol.embl.de/login.cgi).
Gene structure analysis, synteny analysis, and 3D structure prediction
To gain insight into the evolution of the AFF genes family, we utilized Genomicus (http://genomicus.biologie.ens.fr/Genomicus) to construct and analyze the adjacent genetic environment of AFF gene in both jawless and jawed vertebrates. The exon and intron structures of AFF genes from different species were obtained with the help of Ensembl database (Hunt et al. 2018). Among the species analyzed were human, chimpanzee, mouse, African ostriche, crocodile, toad, zebrafish, and lamprey. The use of the SWISS-MODEL (http://swissmodel.expasy) and UniProt (https://www.uniprot.org/) predicts the 3D structure of Lr_AFF3 and H_AFF4, for which the model’s PDB ID is 6r80.1A.
3-[4,5-Dimethylthiazol-2-yl]-2,5-diphenyl tetrazolium bromide (MTT) assay
Cell proliferation was measured using a 3-[4,5-dimethylthiazol-2-yl]-2,5-diphenyl tetrazolium bromide (MTT) assay. HEK293T cells were induced with FGF2 protein, pcDNA3.1-Flag-Lr_NHD, pcDNA3.1-Flag-Lr_CHD, pcDNA3.1-Flag-Lr_AFF3, and pcDNA3.1( +) plasmid, respectively. Transfected HEK 293 T cells were inoculated into 96-well plates with five duplicate wells per treatment and cultured for 0, 24, 48, and 72 h in a humidified incubator. MTT reagent (Sangon Biotech, Shanghai) was added to each well and incubated for 4 h in a CO2 incubator. Next, aspirate the culture medium and add the formazan solubilzation solution (100 μL) to each well. After stirring on a shaker for 10 min, the absorbances were measured at 570 nm with a microplate reader.
5-Ethynyl-2′-deoxyuridine (EdU) assay
The EdU Cell Proliferation Kit (Bio Basic Inc., Canada) was used to perform the EdU experiment. HEK293T cells induced by FGF2 protein, pcDNA3.1-Flag-Lr_NHD, pcDNA3.1-Flag-Lr_CHD, and pcDNA3.1( +) plasmid were seeded in a 12-well plate and cultured for 48 h. Each experiment had three repeated wells. Add 300 μL of 10 μM EdU medium to each well and incubate for 2 h. The cells were fixed in 4% polyformaldehyde cell fixative for 30 min. After that, add 2 mg/mL glycine and keep for 5 min. After washing with PBS, cells were incubated for 30 min with 100 μL of prepared staining reaction liquid. The staining solution was discarded; the cells were washed with 0.5% TritonX-100 for 10 min, followed by washing with PBS for 5 min. Then, add diluted Hoechst staining solution to each well and incubate for 20–30 min at room temperature. Finally, wash off the staining solution with PBS and use the fluorescence microscope to observe cell proliferation assessment.
Statistical analysis
Remove the maximum and minimum values from the five values in each period of the MTT colorimetric experiment to obtain the average value and process the data by Excel spreadsheet and GraphPad Prism 9 software. The experiment ultimately analyzed the experimental results by plotting a line graph. The EdU experiment analyzed the images under a fluorescence microscope. All data were displayed as mean ± standard deviation (SD). Differences between the groups were analyzed using Student’s t-tests. The significance level was established at P < 0.05 (* P < 0.05, ** P < 0.01).


Comments (0)