
Remember me

Designed by researchers after reviewing domestic and international literature, including gender, age, BMI, education level, marital status, family history, smoking status, drinking status, premorbid personality, sleep duration, exercise frequency, type of household registration, per capita monthly income, payment method, duration of illness, medication adherence, and medication side effects. About definition of general data: BMI was calculated by weight (kg)/height² (m²), accurate to one decimal place, set as a continuous variable in this study. Family history is defined as the presence of a history of mental illness in two generations of the patient [20]. Smoking status is defined as not less than 1 cigarette/day and duration not less than 6 months as smoking, otherwise non-smoking [21]. Drinking status is defined as consuming not less than 50 g alcohol/occasion at least once a week, otherwise occasional or non-drinking [21]. Exercise frequency is defined as high-frequency exercise if exercising not less than 1 time/week and total exercise duration more than 60 min per week, otherwise low-frequency exercise. Per capita monthly income is grouped based on 2023 data from the National Bureau of Statistics [22] and type of household registration. Medication status is categorized as regular or irregular (hidden or missed medication in the past month). In this study, medication non-adherence refers to patient-related irregular medication (e.g., forgetting to take medication or self-initiated discontinuation) [23]. Drug adverse reactions include extrapyramidal symptoms, cardiovascular reactions, excessive sedation, gastrointestinal reactions, salivation, weight gain, liver function abnormalities, neuroleptic malignant syndrome, hematological changes, and significant ECG changes [23].
Family apgar index scale (APGAR)The APGAR scale [24] measures individual satisfaction with family function, including adaptation, partnership, growth, affection, and resolve. Each item is scored 0, 1, or 2 for “hardly ever,” “sometimes,” or “almost always,” respectively, with a total score ranging from 0 to 10. Scores of 7–10 indicate good family function, 4–6 moderate dysfunction, and 0–3 severe dysfunction.
Social support rating scale (SSRS)The SSRS scale [25] measures social support across subjective support (4 items), objective support (3 items), and support utilization (3 items), totaling 10 items with a score range of 13–66. Scores < 20 indicate low social support, 20–30 general support, 31–40 satisfactory support, and > 40 high support.
Life events scale (LES)The LES scale [26] captures the impact of positive/negative events and their duration, including 48 common life events and 2 blank items for additional events. Participants report occurrences, timing, nature, mental impact, and duration of each event.
Data collection methodsThe research team consisted of two psychiatrists with over 10 years of clinical experience and four psychiatric clinical nurses. All team members underwent standardized training on screening criteria, questionnaire content, instructions, assessment sequence, and evaluation methods.
Before the study began, schizophrenia patients were screened based on inclusion and exclusion criteria. First, patient records were reviewed systematically to ensure that they had been in a state of remission for at least the past six months and met the inclusion criteria. Over the next six months, psychiatrists assessed patients monthly using the PANSS to monitor for relapse. Researchers explained the purpose and significance of the study to eligible participants, obtained informed consent, and had participants sign the consent form before completing the questionnaire.
The questionnaire comprised two parts: General Information Survey: Completed by participants or their family members and verified through the hospital’s medical record system. Clinical and psychosocial data collection: Scores for APGAR scale, SSRS scale, LES scale, medication adherence, medication side effects, and PANSS scale were collected face-to-face during participants’ monthly outpatient visits.
Relapse patients were followed up until the relapse occurred, while non-relapse patients were followed until the end of the study. Patients who did not attend follow-up visits were confirmed as dropouts via telephone.
To minimize bias, a double-blind approach was employed during data collection. Psychiatrists were responsible solely for administering the PANSS, while psychiatric clinical nurses collected all other data without knowledge of the patients’ group assignments. Similarly, data analysts were blinded to the group allocation.
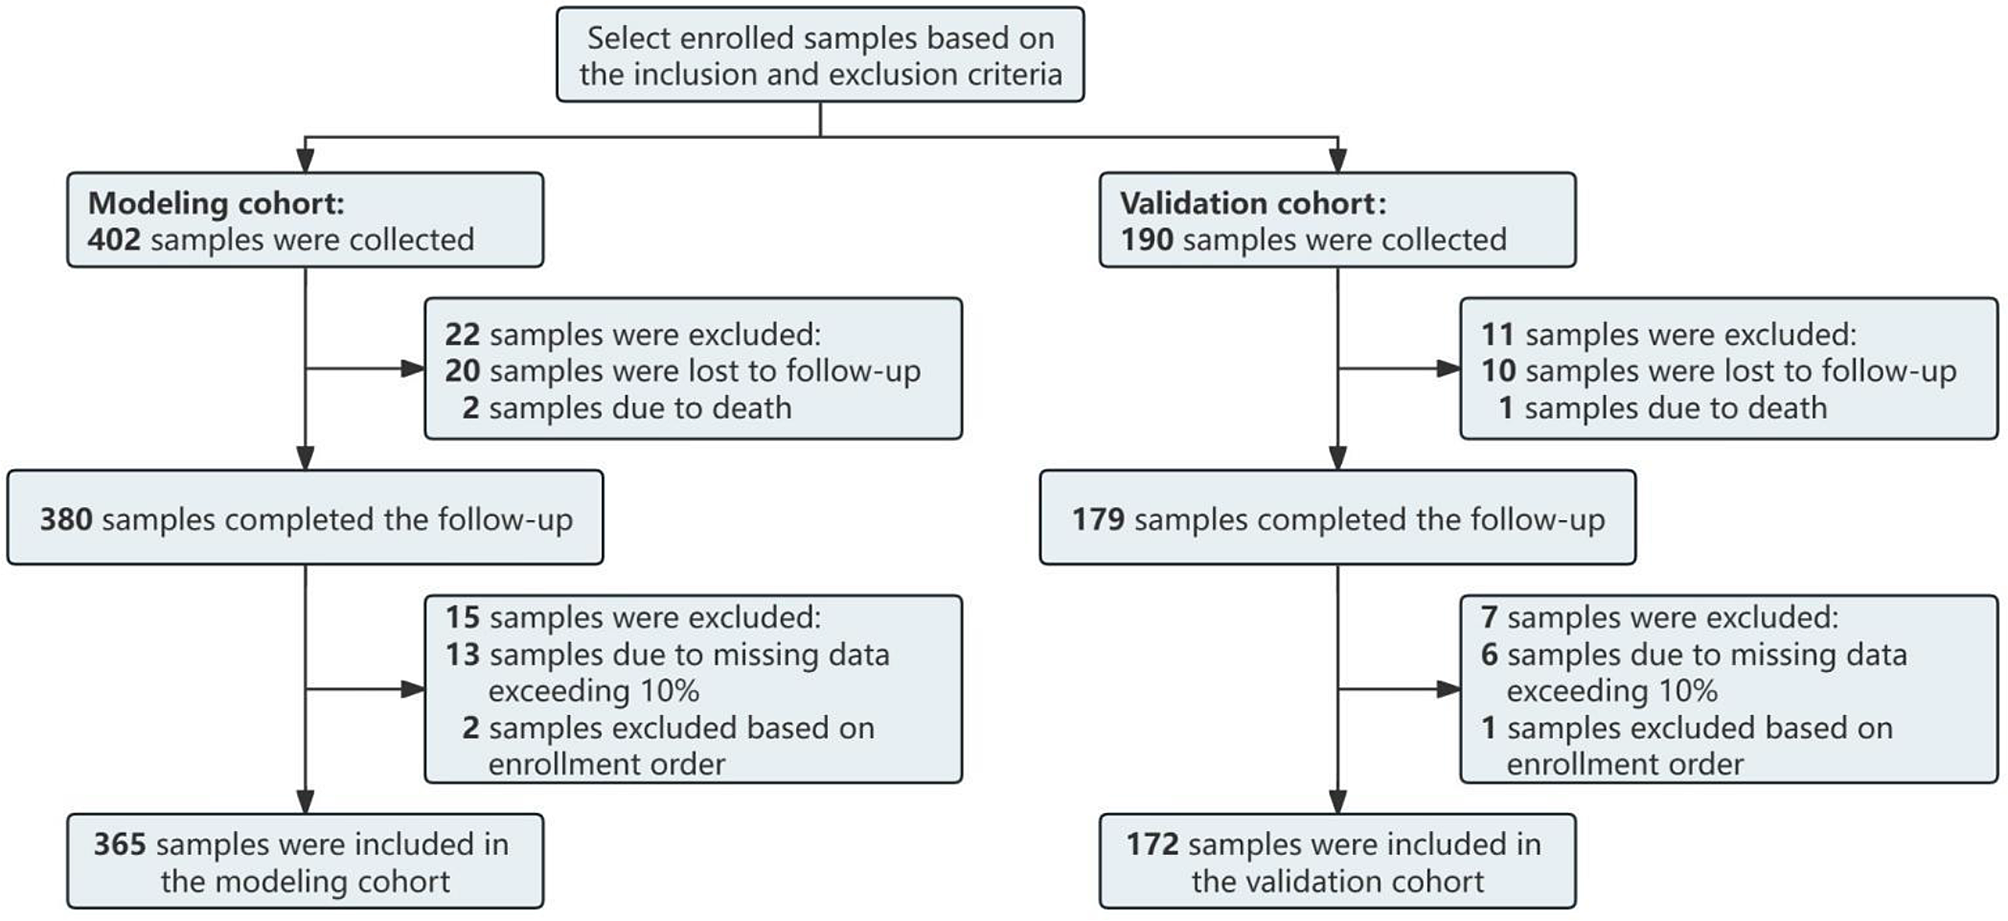
Sample size estimationFor modeling cohort, based on Riley’s [27] standards for multivariable prediction model sample size calculation, with a recurrence rate of 15.4% [28] for ESCZP, and 8 candidate variables from Lasso regression analysis (Fig. 1-A), a C-statistic of 0.821 [29] was used for calculation with R’s “pmsampsize” package, requiring at least 365 cases for modeling.
For spatial external validation cohort, we estimated the sample size using the C-statistic of the spatial external validation cohort, setting C at 0.9. The standard error of the C-statistic, SE(C), was set to be ≤ 0.0255 to ensure that the confidence interval width is ≤ 0.1. Based on the preliminary results, the proportion of correct outcome events in the spatial external validation cohort was set at 36.50%. Using this information in the following formula [30], the minimum sample size required for external validation was calculated to be 172 cases.
$$\:SE\left(c\right)\approx\:\sqrt-1\right)\left(\frac\right)+\frac-1\right)c}\right)}^\varphi\:\left(1-\varphi\:\right)}}$$
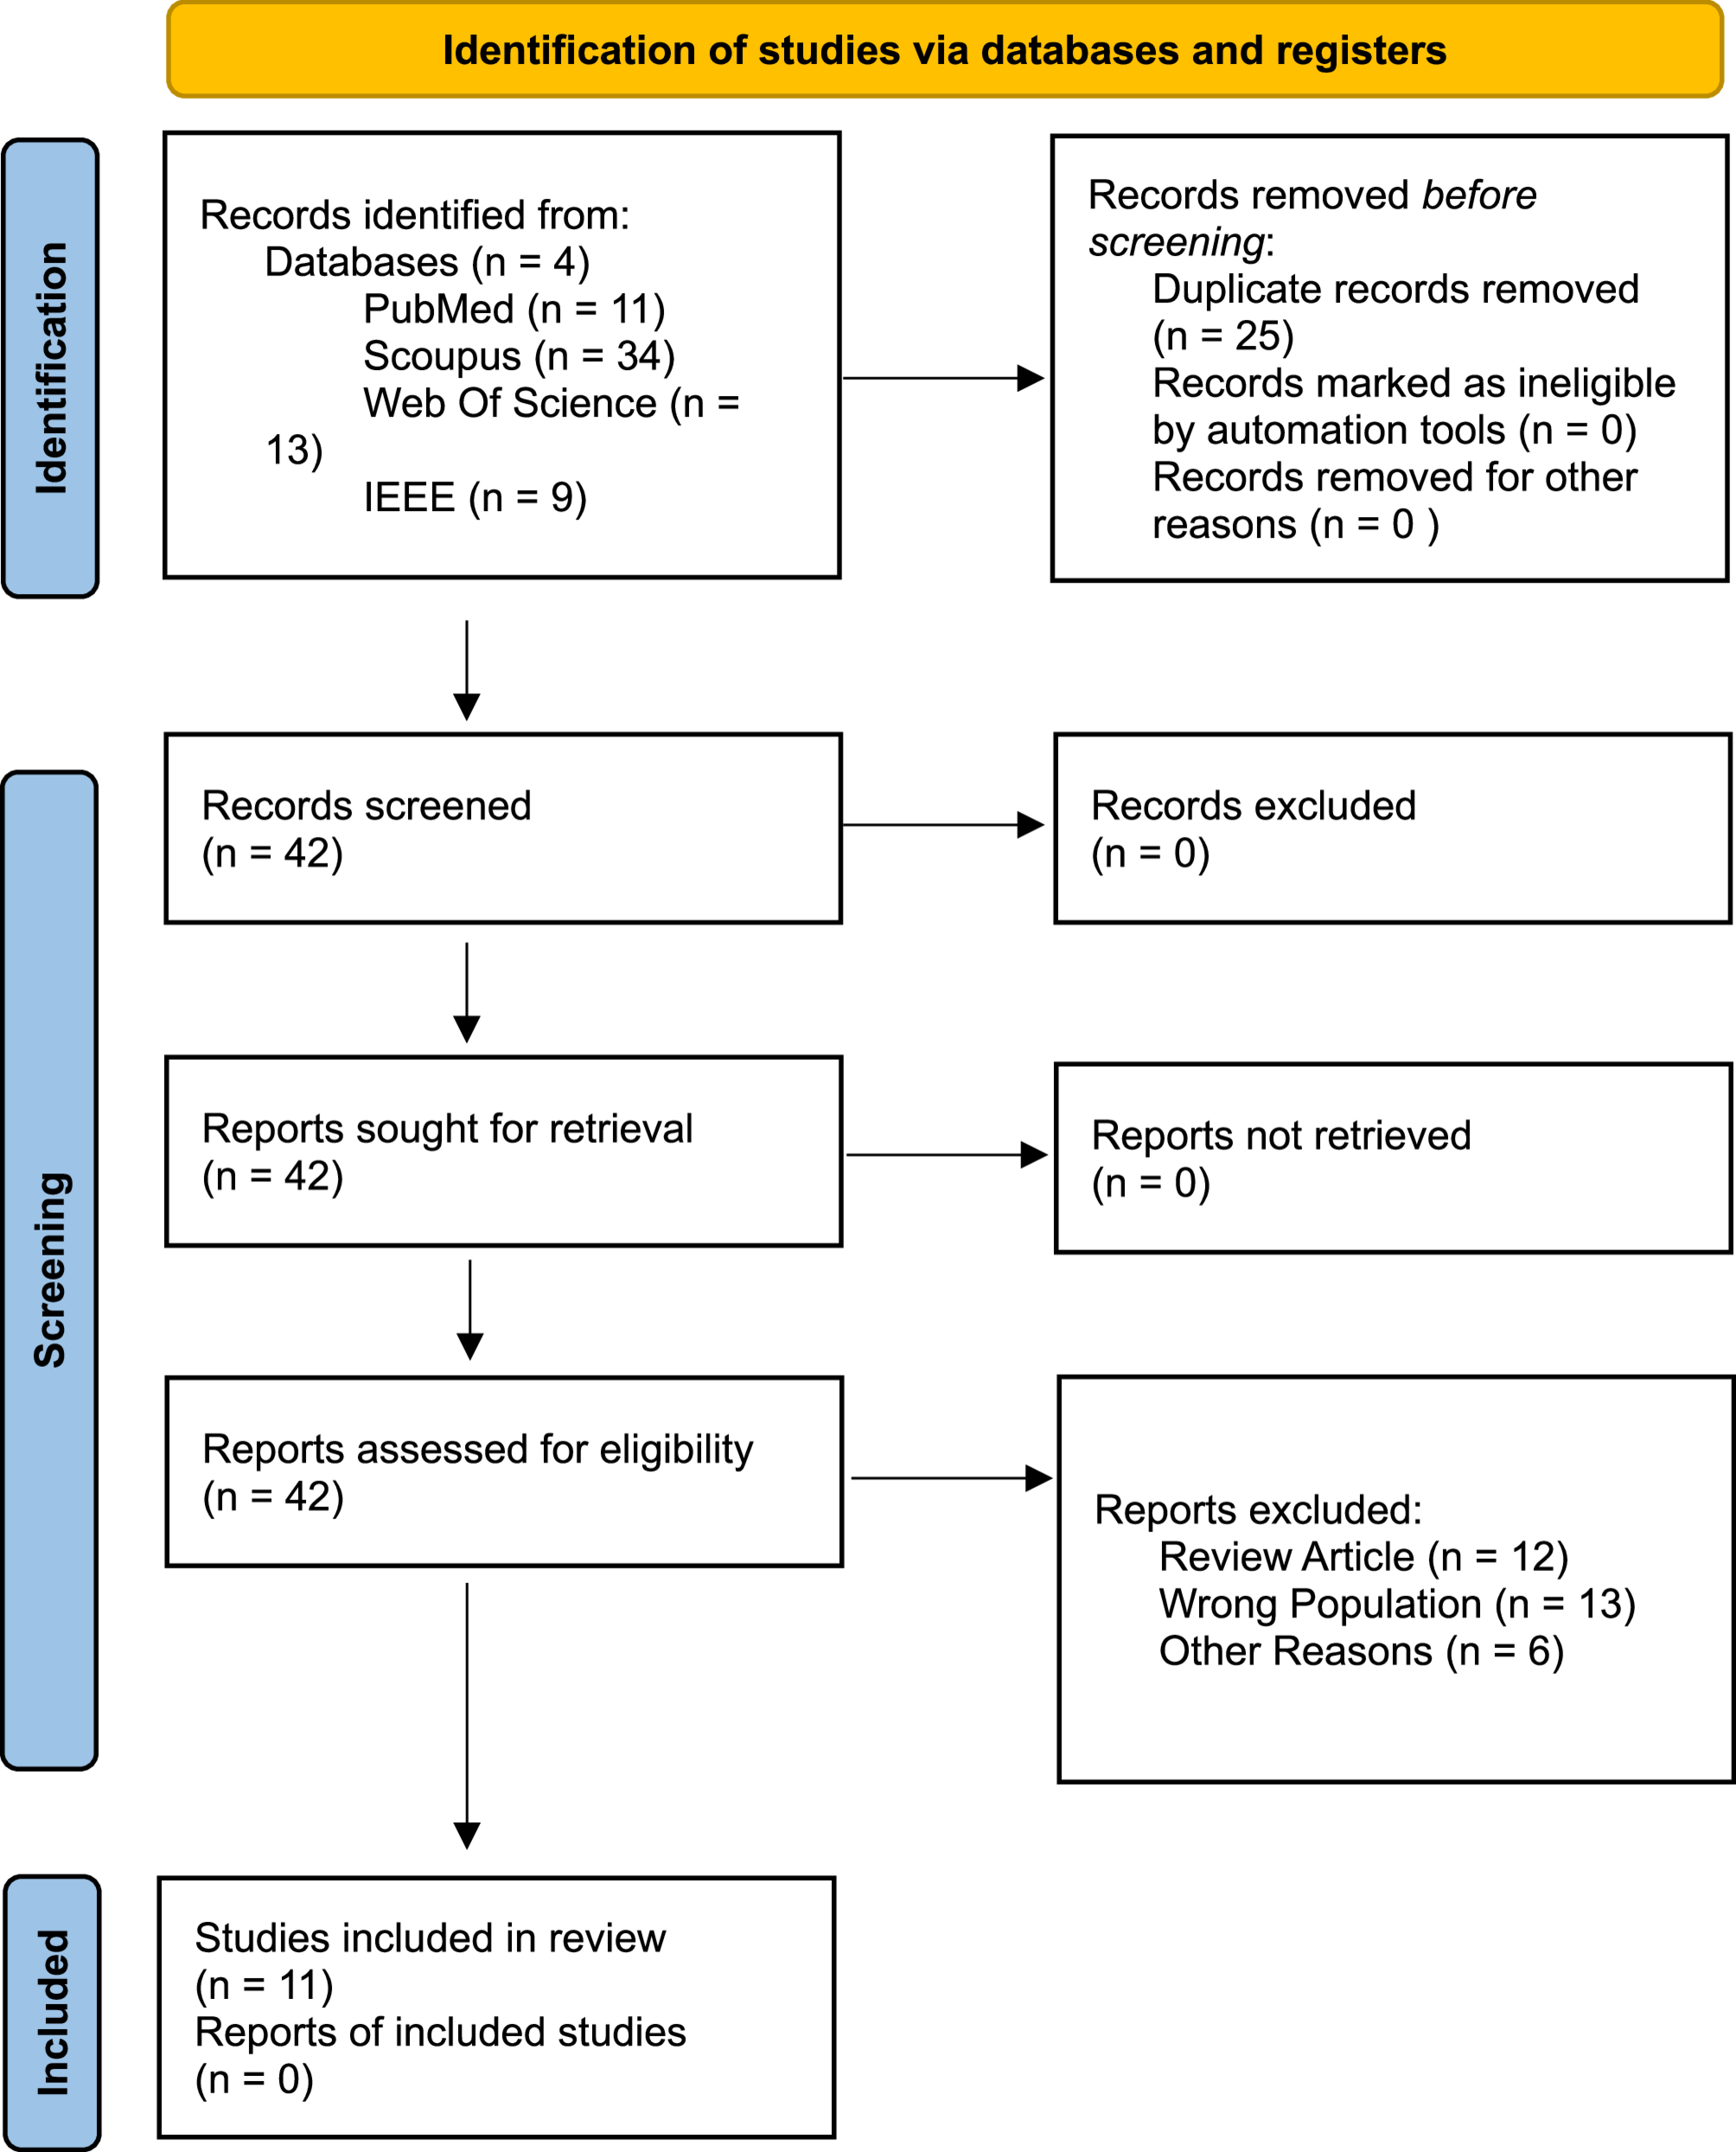
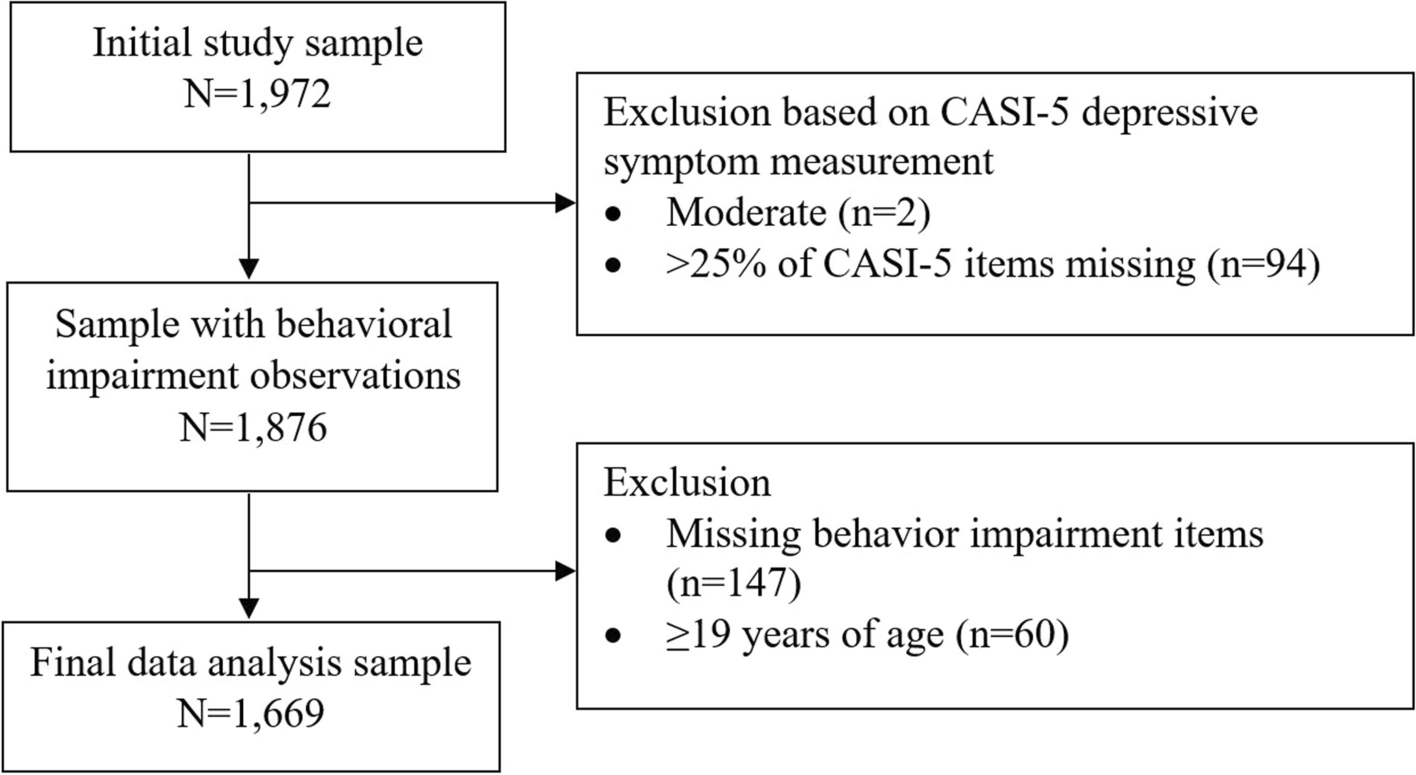
Considering the patients’ age, disease specificity, and non-adherence, the required sample size was increased by 10%. Samples with more than 10% missing data were excluded. To prevent oversampling, the remaining samples were retained in the order of inclusion until the required sample size was met. For missing data, five imputed datasets were constructed based on the existing data using the multiple imputation method [31] to ensure data completeness.The sample selection process is shown in Fig. 1.
Fig. 1
Sample selection flowchart
Comments (0)