
Remember me
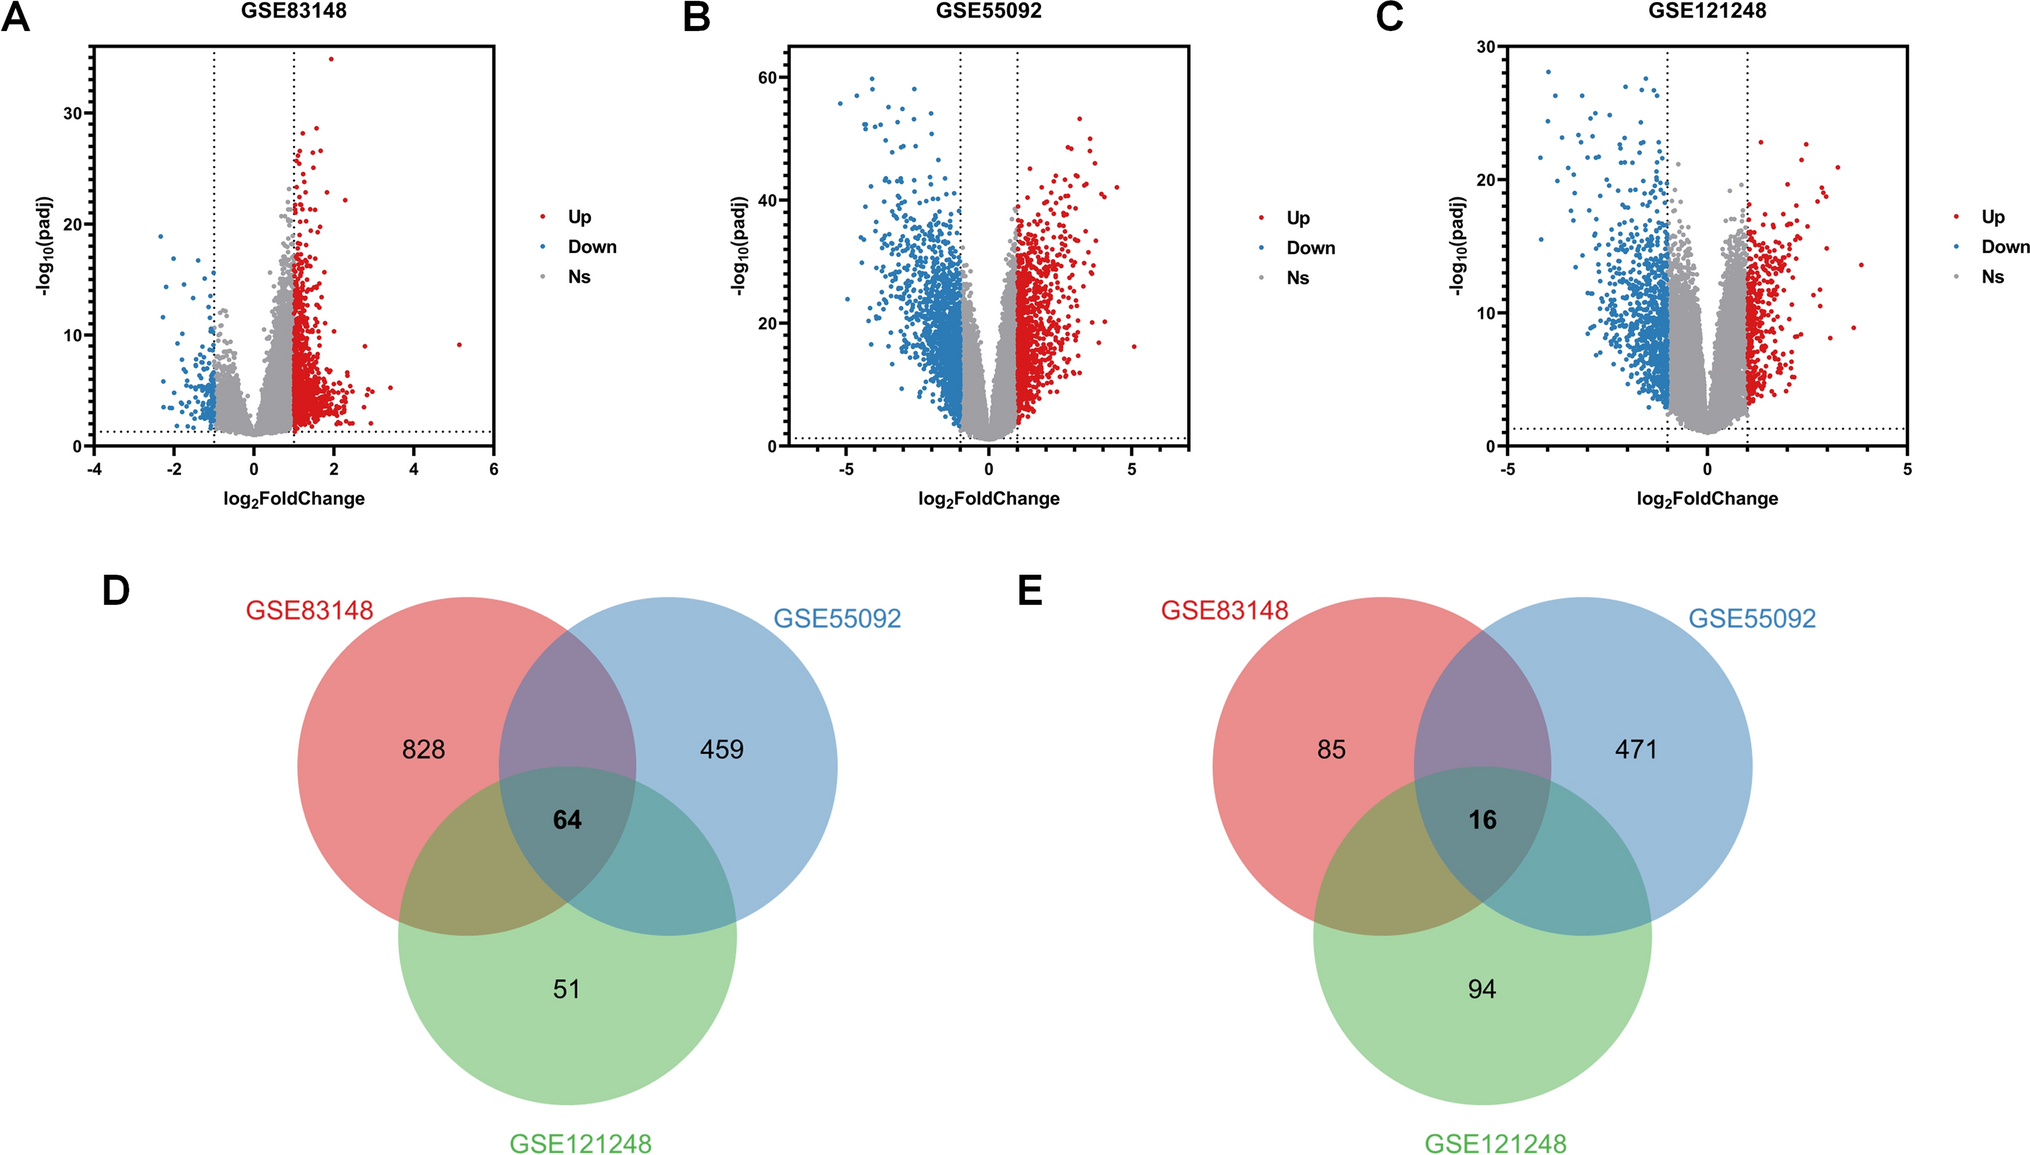
We filtered with |LogFC|> 1.5 and false discovery rate (FDR) < 0.05 to obtain differentially expressed genes (DEGs), resulting in a heatmap (Fig. 1A) and a volcano plot (Fig. 1B, Supplementary Table 3). Integrating TCGA and GEO expression data and conducting batch correction to extract differential gene expression, we obtained 14 prognostic ANRGs, including DAPK2, BIRC5, IGF1, PIK3CG, MMP9, FASLG, PRKCQ, HAVCR2, SPIB, PIK3R2, CDC25C, LCK, SPTA1, and IKZF3 (Fig. 1C). The correlation between these genes is displayed in Fig. 1D. Copy number increases more frequently than deletion frequency in genes like PIK3CG, SPTA1, FASLG, MMP9, BIRC5, IGF1R, DAPK2, and LCK. The copy number increase frequency of IKZF3, PIK3R2, SPIB, CDC25C, HAVCR2, and IGF1 genes is fewer than the deletion frequency (Fig. 1E). The copy number circle map (Fig. 1F) depicts the distribution of related genes on the chromosome. Using the STRING database, we ran a protein–protein interaction (PPI) network analysis to illustrate the relationship between these nodes of anoikis-related genes (Fig. 1G). We then used GeneMANIA to build a network of 14 prognostic genes and their 20 interacting genes closely associated with anoikis (Fig. 1H). These results describe the landscape of ANRGs-related genes in SKCM.
Fig. 1
The Landscape of Anoikis-Related Genes in Skin Cutaneous Melanoma. A Heat map depicting the top 50 genes with the most significant differences. B The volcano map of the DEGs. C The forest plot shows the top 14 ANRGs (p < 0.01) through univariate Cox regression analysis. D The network diagram illustrates the correlations between the top 14 ANRGs. E Copy number variations (CNVs) of 14 ANRGs in TCGA-SKCM. F The Circos plot displays the chromosome region and alteration of ANRGs. G Protein–protein interaction network. H The GGI network was built using GeneMANIA
3.2 Construction of gene subtypesIn this study, we utilized 14 prognosis-related differentially expressed genes (DEGs) (p < 0.01) for Consensus Clustering using the Consensus Cluster Plus R software package to investigate the role of anoikis-related genes in SKCM. K-means clustering classified the patients into two clusters (Fig. 2A). We selected the number of clusters k from 2 to 9, which was chosen to be 2 (Fig. 2B, Supplementary Fig. 1A B). According to the K-M survival curve, the prognosis of the two subtypes was significantly different. Our research revealed that patients with subtype B had a significantly better prognosis than those with subtype A (Fig. 2C, p < 0.001). The accuracy of this clustering was verified using PCA, t-SNE, and UMAP (Figs. 2D–F). Through the analysis of a heat map of the expression of ANRGs and the related clinicopathological characteristics of two subtypes, it was found that three genes (PIK3R2, BIRC5, and CDC25C) were up-regulated in subtype A, while the rest were down-regulated (Fig. 2G). These genes may modify these cells via anoikis, thereby impacting the immune infiltration of melanoma patients (Fig. 2H). The differential enrichment of KEGG pathways between clusters B and A was investigated using the GSVA package, and the general distribution of 14 ANRGs in the clusters was evaluated. Cluster B exhibited significantly higher levels of enrichment in 20 KEGG pathways, including primary immunodeficiency, leishmania infection, viral myocarditis, and asthma (Fig. 2I), suggesting that anoikis may influence prognosis by affecting these KEGG pathways. GSEA analysis revealed that subtype A was considerably enriched in five pathways: antigen processing and presentation, autoimmune thyroid disease, cell adhesion molecules cams, chemokine signaling pathway, and cytokine-cytokine receptor interaction (Fig. 2J).
Fig. 2
Consensus Cluster Analysis. A A heat map representing the consensus clustering solution (k = 2) for 23 genes in SKCM data is presented. B The empirical cumulative distribution function (CDF) picture shows the constant distribution of the various K values. C Kaplan–Meier analysis results of two molecular subtypes. D–F PCA (D), tSNE (E), and UMAP (F) distinguish two subtypes based on the expression of ANRGs. G. Heat map of clinical information and gene expression profiles of the two molecular subtypes based on 14 ANRGs. H The patterns of immune infiltration in the two subtypes. I. Kaplan–Meier analysis results of 2 molecular subtypes based on 14 ANRGs. J. GSEA analysis identifies potential signaling pathways in cluster A
3.3 Construction of the prognostic modelAfter the GEO and TCGA merging, the overall dataset was randomly divided into training and validation datasets (at a 5:5 ratio) to construct the prognostic model. Specific parameters of the risk score were obtained from the training set, and the risk score was calculated using the following formula:
$$\begin }\, = & \left( \right)}*IGF1\, \\ & + \left( \right)}*FASLG\, \\ & + \left( \right)}*PIK3R2 \\ \end$$
Based on the median risk score, SKCM patients in the train dataset, validation dataset, and all datasets were classified into high-risk and low-risk groups, and it was found that the prognosis differed significantly between the two groups (p < 0.001). The K-M survival curves for the training dataset, validation dataset, and all datasets demonstrated that patients in the low-risk group had a significantly better prognosis than those in the high-risk group (p < 0.001), indicating that the risk score can be used as a prognostic indicator (Fig. 3A–C).
Fig. 3
Construction and Validation of Prognostic Model Related to Anoikis. A–C Kaplan–Meier analysis of DSS in melanoma patients in the training dataset. D–F The time-dependent ROC curves of DSS for 1 (D), 3 (E), and 5 (F) years. G A heat map showing the patient's predictive 3-gene signature in the TCGA database. H An alluvial diagram of subtype and living status. I A box plot of risk scores in clusters A and B. J The forest plot summarizes the multivariable Cox regression analyses of the clinical features and the risk score in SKCM patients. K A nomogram plot based on risk score and clinicopathological factors
The area under the time-dependent ROC for 1, 3, and 5 years was greater than 0.6 for the training dataset, indicating that our model predicts patient survival with high accuracy (Fig. 3D–F). Additionally, a heat map was generated to show the expression of PIK3R2, IGF1, and FASLG in the high-risk and low-risk groups in the prognostic model (Fig. 3G). The association between the two clusters, the high-risk and low-risk groups, and the final survival status was demonstrated by plotting the Sankey diagram (Fig. 3H). It can be observed that Cluster A predominantly consists of individuals with a high risk, while Cluster B exhibits an opposite pattern; however, their prognosis does not exhibit any significant differences. When conducting risk difference analysis, the risk scores were found to be significantly higher in cluster A (p < 0.001) (Fig. 3I). Furthermore, the independent prognostic analysis showed that the risk score could be an independent prognostic factor for additional clinical features (Fig. 3J). Using risk scores and staging, column line plots were generated to analyze the probability of survival for 1-, 3-, and 5-year time-dependent ROC curves (Fig. 3K and Supplementary Fig. 2).
3.4 Correlations between ANRGs and prognosis in SKCM patientsWe performed a stratified survival analysis of clinicopathological factors for patients in TCGA-SKCM, including age (> 65 years vs. ≤ 65 years) (Fig. 4A, B), gender (female vs. male) (Fig. 4C, D), N (N0-1 vs. N2-3) (Fig. 4I, J), T (T0-2 vs. T3-4) (Fig. 4K, L), and M (M0 vs. M1). Age (Fig. 4E, F) and gender (Fig. 4G, H) were stratified for analysis in the GSE65904 patients, who only provided age and gender information. Kaplan–Meier survival analysis revealed that, except for the M1 group (p 0.05), the high-risk group had a lower DSS than the low-risk group (Fig. 4, Supplementary Fig. 3B). Additionally, it is hypothesized that the M1 group is related to the small sample size due to the trend (Supplementary Fig. 3B).
Fig. 4
Correlations Between Anoikis and Prognosis in SKCM Patients. A–L The DSS Kaplan–Meier curve of statistically significant subgroups for age (> 65 years vs. = 65 years) (A and B), gender (female vs. male) (C and D), N (N0-1 vs. N2-3) (I and J), T (T0-2 vs. T3-4) (K and L) in SKCM patients, and age (> 65 years vs. = 65 years) (E and F), gender (female vs. male) (G and H) in GSE65904 dataset
3.5 Comparison of drug sensitivity between high- and low-risk groupsWe evaluated 150 drugs based on the IC50 concentration difference between the high-risk and low-risk groups. In the high-risk group, we chose BI-2536 (Fig. 5A), ERK_2440 (Fig. 5B), ERK-6604 (Fig. 5C), Lapatinib (Fig. 5D), NVP-ADW742 (Fig. 5E), and SB505124 (Fig. 5F). In the low-risk group, we selected six drugs: 5-fluorouracil (Fig. 5G), AGI-5198 (Fig. 5H), AGI-6780 (Fig. 5I), alisertib (Fig. 5J), BMS_345541 (Fig. 5K), and AMG-319 (Fig. 5L).
Fig. 5
Drug Sensitivity Analysis. A–F The high-risk group had higher sensitivity to BI-2536 (A), ERK_2440 (B), ERK-6604 (C), Lapatinib (D), NVP-ADW742 (E), and SB505124 (F) than the low-risk group. G–L The sensitivity of the low-risk group to 5-Fluorouracil (G), AGI-5198 (H), AGI-6780 (I), Alisertib (J), BMS_345541 (K), and AMG-319 (L) was higher than that of the high-risk group
3.6 Immune activity with different risk scores and Single-cell sequencing analysisThe infiltration levels of 22 immune cell phenotypes in high-risk and low-risk groups were examined. The infiltration of M0 macrophages, M2 macrophages, resting Mast cells, activated Mast cells, follicular helper T cells, Tregs, resting natural killer (NK) cells, and activated Dendritic cells was significantly higher in the high-risk group. However, the infiltration of B memory cells, Plasma cells, CD8( +) T cells, activated CD4( +) T memory cells, resting CD4( +) T memory cells, gamma delta T cells, activated NK cells, M1 macrophages, and resting Dendritic cells was much lower in the high-risk group than in the low-risk group (p < 0.05) (Fig. 6A). The prognostic model was constructed using three genes, including IGF1, FASLG, and PIK3R2, which exhibit varying expression patterns between high- and low-risk groups and are strongly associated with multiple immune cell infiltrations (p < 0.05) (Fig. 6B). Using single-cell data analysis, we downscaled 7186 cells into 23 subpopulations (Fig. 6C) and subsequently annotated them into nine major cell types (Fig. 6D). Our findings revealed that the FASLG gene was predominantly expressed in Exhausted CD8( +) T (Tex) cells, NK, and Tprolif cell subpopulations (Figs. 6E and F), with CD8( +) T cells showing the highest level of connection with FASLG (Fig. 6B). The cell dimensionality reduction map indicated that FASLG was most abundant in the c1 cluster. T-cell depletion refers to the impaired states in antigen-specific CD8( +) T cells, which persist but fail to eradicate the pathogenic danger [23].
Fig. 6
Results of Anoikis at the Single-Cell Level. A. Comparison of immune cell components between the high-risk and low-risk groups.. B. Correlation between immune cells and three hub ANRGs. C. Single-cell sequencing data were reduced in dimension to 23 clusters. D. Annotated results of major cell types. E. Result of FASLG dimension reduction in UMAP. F. Violin plot of FASLG expression on major cell lineages. G. Cell communication between Tex-C1 cells and other clusters. H. Down-regulated HALLMARK gene sets in different clusters. I. Down-regulated KEGG gene sets in different clusters
Currently, the primary mechanisms of regressive tumor effects are PD-1 and, more recently, additional pathways such as Lag-3, TIGIT, and Tim-3, which directly target and reinvigorate Tex cells [24]. We further explored the cellular communication between cluster 1 of Tex (Tex-C1) cells and other cells individually (Fig. 6G), with network nodes representing cell types, network edge thickness indicating the total number of ligand-receptor pairings, and line colors corresponding to ligand cell types. Our results showed that Kras-signaling-up, coagulation, myogenesis, and epithelial-mesenchymal transition were down-regulated in Tex-C1 cells (Fig. 6H). Furthermore, KEGG enrichment analysis of Tex-C1 cells revealed that the lysosome and melanogenesis signaling pathways were down-regulated (Fig. 6I). These findings suggest that FASLG in SKCM is involved in the mechanism of Tex-C1 cell activity via these signaling pathways.
Comments (0)