Participants
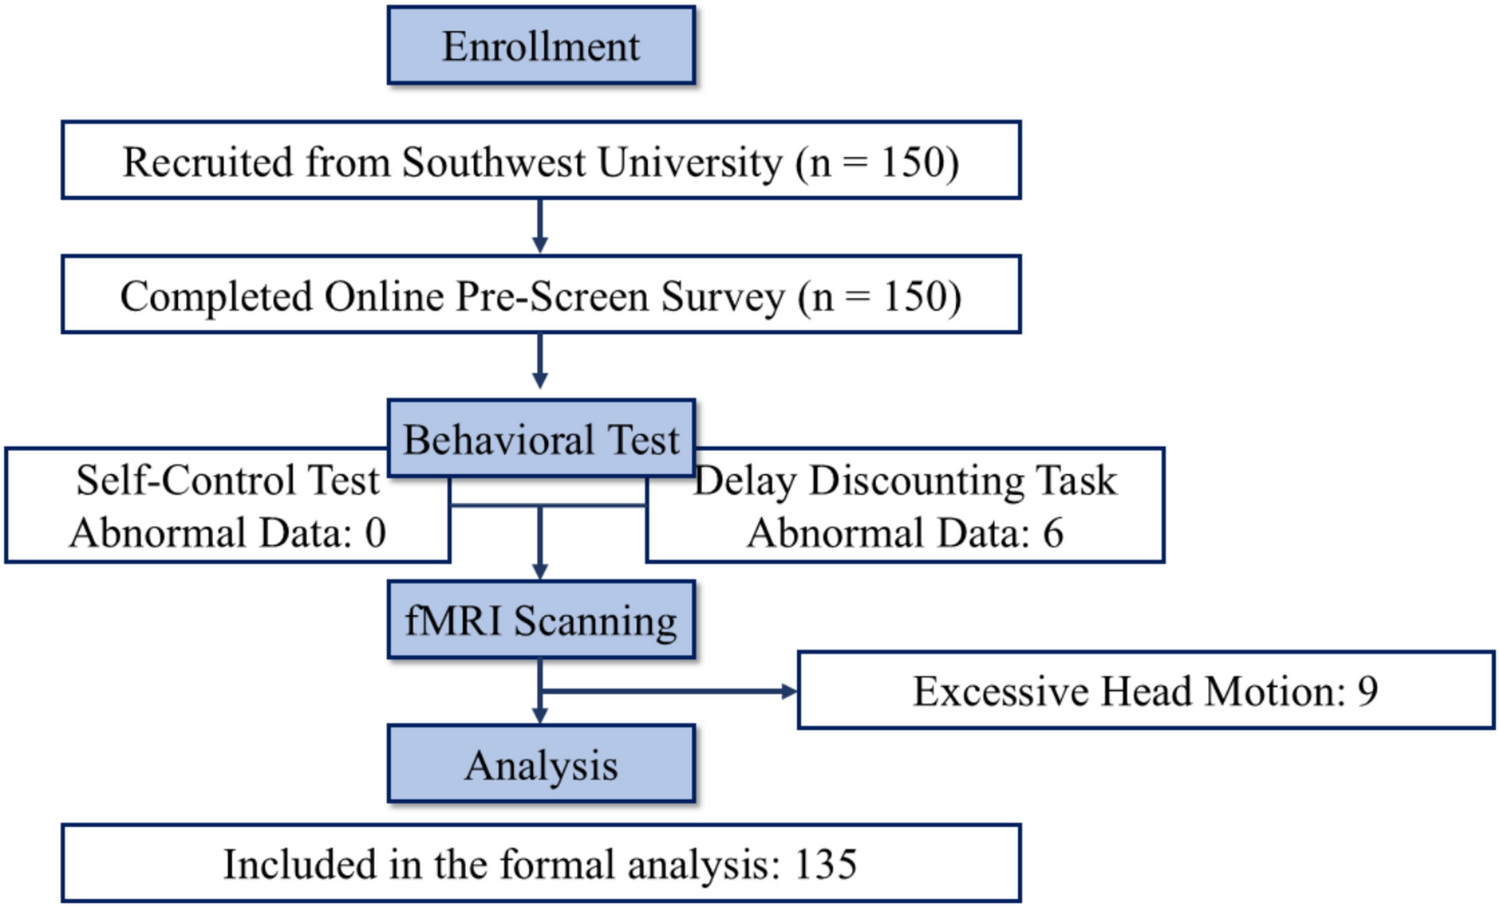
Sixty-two young adults in total (aged between 20 and 32 years) took part in this prospective observational cross-sectional study: 33 low-risk preterm (Mage = 25.33 years; SDage = 2.92) and 29 full-term (Mage = 26.41 years; SDage = 2.24) subjects. A group of preterm young adults at lower risk of exhibiting major disabilities was recruited at Cruces University Hospital (Barakaldo, Spain) by chain-referral sampling from September 2018 to April 2021. This group of 33 young adults born preterm at 30–36 weeks of gestation and with the following inclusion/exclusion criteria were considered to be at lower risk of adverse neurodevelopmental outcomes as previously reviewed by our research group (Fernández de Gamarra-Oca et al. 2021): (1) 30- to 36-week gestational age (GA), (2) absence of brain pathology identified by neonatal cranial ultrasound, (3) lack of substantial neonatal morbidity (i.e., congenital neurological, cardiac, respiratory or digestive malformations, necrotizing enterocolitis, or septic shock), and (4) ranging in age at time of evaluation from 20 to 40 years. A full-term group of 29 subjects was recruited, with the inclusion criteria for these participants being as follows: (1) > 37-week GA, and (2) ranging in age at time of evaluation from 20 to 40 years. The exclusion criteria for both low-risk preterm and full-term groups were a history of acquired brain injury, cerebral palsy or any other neurological impairment, congenital malformations, and chromosomal abnormalities.
MeasuresSocial-emotional assessment
Social-emotional functioning was measured according to the following domains, with the instruments used to measure each domain being described below. All instrument scores (i.e., theory of mind and moral competence total scores, delay gratification ratio, internalizing and externalizing problem scores and cognitive reappraisal and expressive suppression punctuations) were standardized by transforming them into z-scores to create a composite score to measure social-emotional functioning (henceforth referred to as social-emotional outcomes). Cronbach’s alpha (reliability) coefficient was 0.78.
Theory of mind was measured using the Happé’s Strange Stories Test (Happé 1994) by selecting four of the original stories to represent a lie, white lie, misunderstanding, and pretense. The participant is asked to deduce the thoughts and intentions of the characters in each narrative. For example, in the mentalizing story involving a double bluff, a 2-point answer might be the prisoner tried to trick the army by telling the truth, and so the army will look on the opposite side to the one he says. A 1-point answer for the same story would demonstrate partial understanding: reference the results or a simple bluff. A 0-point answer would be incorrect, such as since the prisoner was afraid, he wanted to reveal the truth.
Moral competence was evaluated by means of the Moral Judgment Test (MJT) (Lind 1978), characterizing the ability to make morally upstanding decisions and judgments in two dilemma situations—the “workers’ dilemma” (i.e., refers to labor rights and professional ethics) and “mercy killing dilemma” (i.e., refers to euthanasia in a medical setting). The MJT specifically assesses the respondent’s ability to score arguments (for and against a protagonist’s action in a dilemma situation) in terms of moral quality rather than opinion agreement. For most participants, this is a tough task; only a few responders score greater than 40 on the C-scale from 0 to 100.
The Delay-Discounting Test (DDT) (Kirby and Maraković 1996), also called the Monetary Choice Questionnaire, assessed delayed gratification by participants answering 21 questions, such as the following: “Would you rather have €85 in 14 days or €30 now?”.
The Adult Self Report (ASR) was employed as a measure of emotional-behavioral functioning (Achenbach et al. 2003). The questionnaire provides scores for the following scales: anxious/depressed, withdrawn, somatic complaints, thought problems, attention problems, aggressive behavior, rule-breaking behavior, and intrusive behavior. Internalizing and externalizing problems were also obtained from the sum of these scales.
The 10-item Emotion Regulation Questionnaire (ERQ) measures participant predisposition for both cognitive reappraisal and expressive suppression of their emotions (Gross and John 2003). Participants respond to each item on a Likert-type scale, ranging from 1 (strongly disagree) to 7 (strongly agree).
General cognitive assessment
The Raven’s Advanced Progressive Matrices (RPM) test was used to assess analogical reasoning as general non-verbal cognition (Raven and Court 1998), while the Peabody Picture Vocabulary Test III (PPVT-III) was employed to measure receptive language, since it characterizes general verbal cognitive performance (Dunn and Dunn 1981).
Socioeconomic status (SES)
The occupation and educational domains of participants and their parents were taken into account separately using the Hollingshead Index (Hollingshead 2011). The participants’ self-SES (i.e., participants’ ongoing occupation and highest level of education) and familial SES (i.e., the average of parents’ retrospective occupation and highest level of education) were thus two distinct measures that were obtained.
Image acquisition
3-dimensional MRI datasets were obtained from the Magnetic Resonance Imaging Unit OSATEK, Galdakao Hospital (Galdakao, Spain) for 64 participants; however, two were eventually excluded due to difficulties in the acquisition process. The radiologist (J.M.O.) reported that all MRI images were non-pathological. Hence, there was a final sample of 33 low-risk preterm and 29 full-term young adults. A single session was used to acquire both sequences. T1-weighted images were also obtained from a Philips 3T Achieva dStream (axial orientation, 3 min 58.9 s session, 160 slices, TR/TE = 8.1/3.7 ms, 288 × 248 matrix, 8° flip angle, 1 mm slice thickness, no gap), and resting-state functional MRI (rs-fMRI) was also acquired: 8 min session, 315 whole-brain gradient echo-planar images, 44 axial slices, TR/TE = 1500/30 ms, FOV = 240 × 240 × 132 mm2, and voxel size = 3 × 3 × 3 mm3.
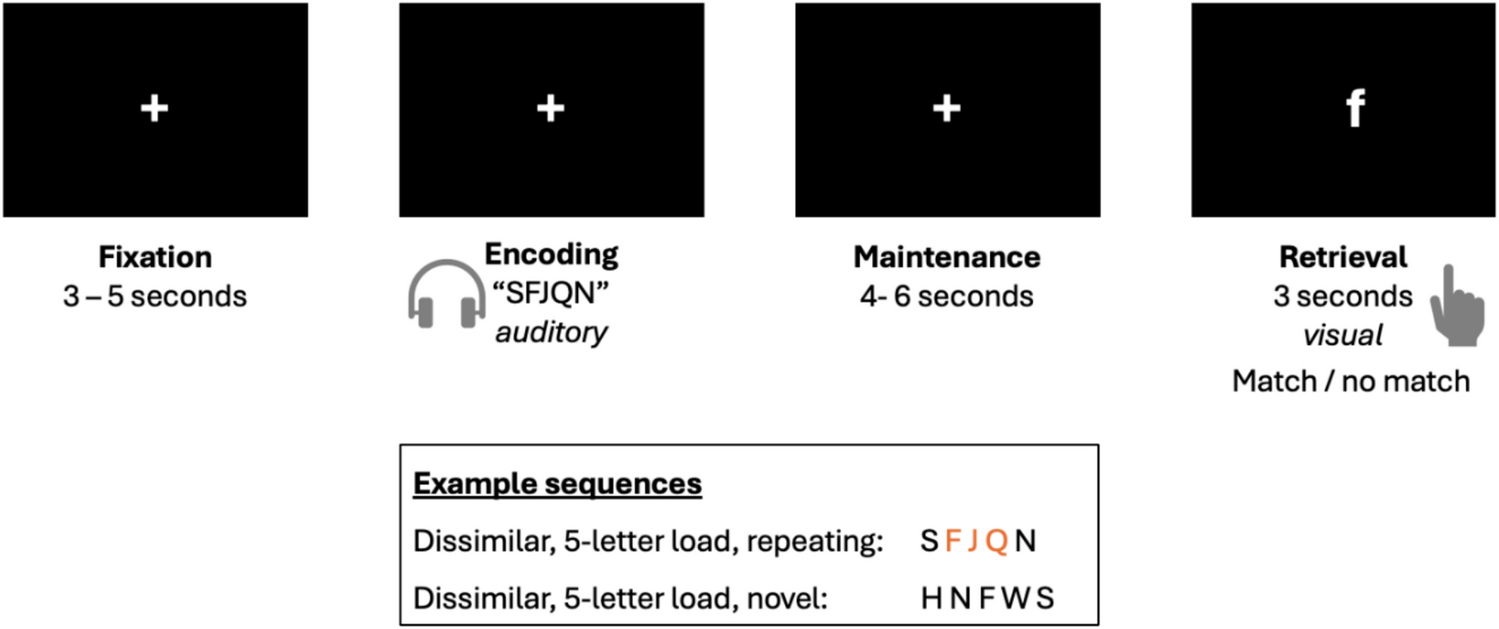
Before acquiring rs-fMRI, the participant’s head was restrained from movement and protected from scanner noise using foam padding and earplugs. Subjects were told not to perform any specific cognitive or physical tasks, keep their eyes closed, and avoid falling asleep. After scanning, participants completed the Amsterdam Resting-State Questionnaire (ARSQ) (Alexander Diaz et al. 2013), which is a 27-item self-report survey covering seven dimensions of resting-state cognition (i.e., discontinuity of mind, theory of mind, self, planning, sleepiness, comfort, and somatic awareness).
Image preprocessingWhole and subnuclei amygdala volumes
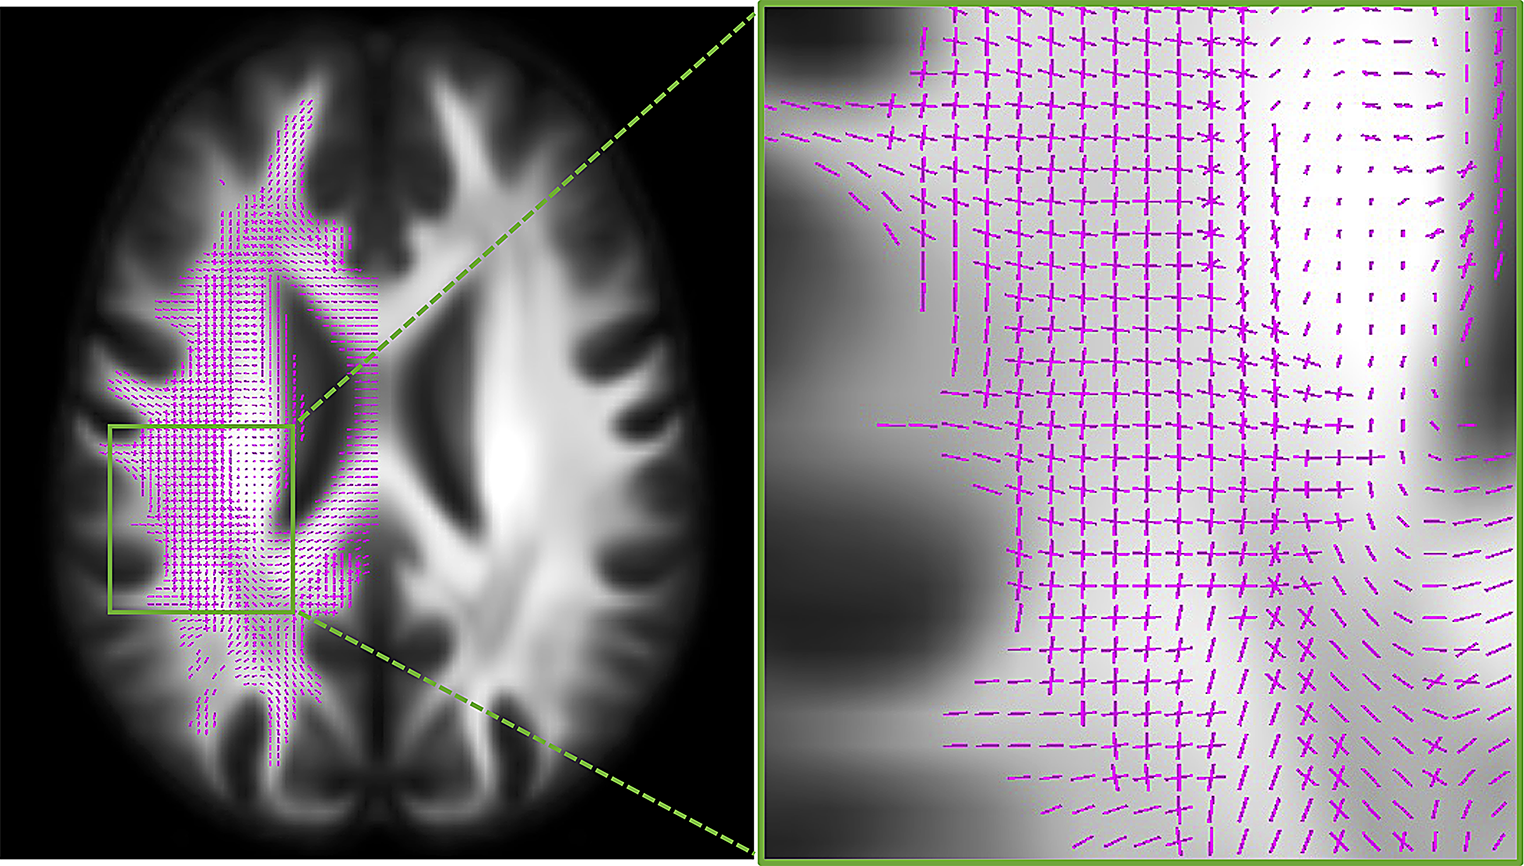
FreeSurfer (https://surfer.nmr.mgh.harvard.edu/) (version v6.0.0) was used in order to obtain whole and subnuclei amygdala volumes from 3-dimensional T1-weighted MRI scans (Fischl 2012). T1-weighted image processing included several procedures: intensity non-uniformity correction, skull stripping, affine transformation to an MNI template, intensity normalization, removal of non-brain tissue, linear and non-linear transformations to a probabilistic brain atlas, and the labeling of subcortical/allocortical structures. Spatial localization priors were used to determine the correct label voxel-per-voxel, and skull stripping, intensity normalization, white matter segmentation, and surface extraction errors were all manually corrected where necessary. Subsequently, the amygdala was segmented automatically based on the Saygin et al. (2017) atlas into central, lateral, basal, accessory basal, cortical, medial, and paralaminar nuclei, as well as into the corticoamygdaloid transition area and anterior amygdaloid area.
Resting-state functional connectivity (FC)
FC analyses were carried out using the CONN Functional Connectivity Toolbox version 21.a (Whitfield-Gabrieli and Nieto-Castanon 2012). Each subject’s 315 functional images were realigned and unwarped, their slice-timing corrected, coregistered with structural data, spatially normalized into standard MNI space (Montreal Neurological Institute, Canada), and their outliers detected (ART-based scrubbing; to eliminate any influence of outlier scans on the BOLD signal, noise components are employed as potential confounding effects). During outlier detection (intermediate level, 97th percentile: 0.9 mm 5 s.d.), potential outlier scans of frame-wise displacements > 0.9 mm or BOLD signal changes > 5 s.d. were detected and flagged as potential outliers. Finally, they were smoothed with an 8-mm Gaussian kernel full with half maximum (FWHM) to increase the signal-to-noise ratio. No outliers were detected in this sample. The default preprocessing pipeline for volume-based analysis (to MNI space) was used for all preprocessing steps, and the structural data were normalized and segmented into GM, WM, and CSF. The anatomical CompCor method was used to reduce noise by extracting the principal components (5 each) from the WM and CSF time series. The subject’s estimated motion parameters and other artificial effects, such as BOLD signals in WM and CSF, which were included as additional confounds, were then removed by a denoising process that was implemented using linear regression and band-pass filtering (0.008–0.09 Hz) (Weissenbacher et al. 2009).
Statistical and imaging analysis
Normal distribution of data was assessed using the Kolmogorov–Smirnov test (K–S), while the Mann–Whitney U test was used to analyze differences in GA, and self- and familial SES. Furthermore, the Chi-squared test was required to assess differences in two qualitative sociodemographic characteristics: gender and handedness. Student’s t-tests were also performed to compare birthweight (BW) and age at time of evaluation between the groups.
A multivariate analysis of covariance was conducted to compare different social-emotional domains (adjusted for age and self-SES), whole amygdala volumes (adjusted for age, self-SES, and eTIV), and amygdala subnuclei volumes (adjusted for age, self-SES, and left/right amygdala volume), while partial eta squared was employed to calculate effect sizes; around 0.01 is considered a small size effect, 0.06 medium, and above 0.14 is considered large. Moreover, bivariate correlation analyses were performed to assess the relationships between social-emotional outcomes and amygdala volumes (i.e., whole and subnuclei volumetric values). For all preceding analyses, the SPSS version 28 was used, and significance level set at 0.05.
Regarding FC statistical analysis, cluster-level inferences in region of interest (ROI)-to-ROI analyses based on Threshold Free Cluster Enhancement (TFCE) approach was used (Smith and Nichols 2009). This approach is used for thresholding ROI-to-ROI parametric maps while appropriately controlling the family-wise error (FWE) rate using TFCE analyses with a FWE corrected p < 0.05 at cluster level, with the post hoc test FDR corrected p < 0.05 at connection level. Between-group differences were assessed (with age and self-SES used as covariates) with Cluster-level ROI-to-ROI based on TFCE and the ROIs selected based on the Harvard–Oxford Structures Atlas (http://fsl.fmrib.ox.ac.uk/fsl/fslwiki/Atlases) were as follows: (a) left amygdala, (b) right amygdala, and (c) MedFC. In addition, Pearson correlation analyses (i.e., each group independently) between the strength of FC and social-emotional data were also assessed with the same approach (Cluster-level ROI-to-ROI based on TFCE) and with the selected ROIs.


Comments (0)