
Remember me
Multiple myeloma (MM) is a common malignant disease, with an estimated 176,404 new cases and 117,077 new deaths due to MM, accounting for 0.9% of new cases and 1.2% of new deaths due to all cancers globally.[1] Regarding regional differences, developed countries often have a higher disease burden of MM than developing countries. For example, the age-standardized incidence, mortality, and disability-adjusted life year (DALY) rates of MM were 8.25, 5.47, and 106.79 per 100,000 in the United States in 2019, which were significantly higher than those in China (1.32, 0.94, and 24.43 per 100,000, respectively).[2]
A previous study reported that there were an estimated 16,500 new cases and 10,300 deaths from MM in China in 2016, while the age-standardized incidence and mortality rates increased by 33.7% and 4.7%, respectively, from 2006 to 2016.[3] However, MM is often integrated into “lymphoma” when the disease burden is analyzed in China.[4] To date, updated epidemiologic data focusing on MM are limited: so this study aimed to determine the characteristics of the disease burden of MM at national and provincial levels in China.
MethodsMetadata about MM at the national and provincial levels in China were retrieved using the Global Burden of Disease (GBD) citation tool from the Global Burden of Disease, Injuries, and Risk Factors Study 2019 (GBD2019) database available at http://ghdx.healthdata.org/gbd-2019. The National Bureau of Statistics of China provided national age-specific population data (http://data.stats.gov.cn).
The disease burden of MM in China was estimated by incidence, mortality, prevalence, years of life lost (YLLs), years lived with disability (YLDs), and DALYs with a 95% uncertainty interval (UI), the generally used methodological approaches of GBD 2019 described in previous studies.[2,6] Briefly, cause-specific mortality estimates and YLLs were generated by standardized data on death causes. Incidence estimates were generated by mortality estimates and mortality to incidence ratios using the sociodemographic index (SDI) as a covariate. Prevalence estimates and YLDs were generated by incidence estimates and survival data. DALYs were generated by summing up the YLLs and YLDs.
Temporal trends in the disease burden of MM were examined by fitting joinpoint models (version 4.6.0.0; National Cancer Institute, USA), with annual percentage changes used to express the change over time, and Z tests were used to assess statistical significance. The attribution for change in the incidence and mortality from 1990 to 2019 was estimated according to the methods used in a previous study.[5–6]
Results Disease burden of MM in 2019It was estimated that the DALY number of MM was 347,453 with an age-standardized DALY rate of 17.05 (95% UI, 12.31–20.77) per 100,000. There were 18,793 new cases, 13,421 deaths and 55,549 cases with age-standardized incidence, mortality and prevalence rates per 100,000 of 0.93 (95% UI, 0.67–1.15), 0.67 (95% UI, 0.50–0.83) and 2.70 (95% UI, 1.87–3.38), respectively.
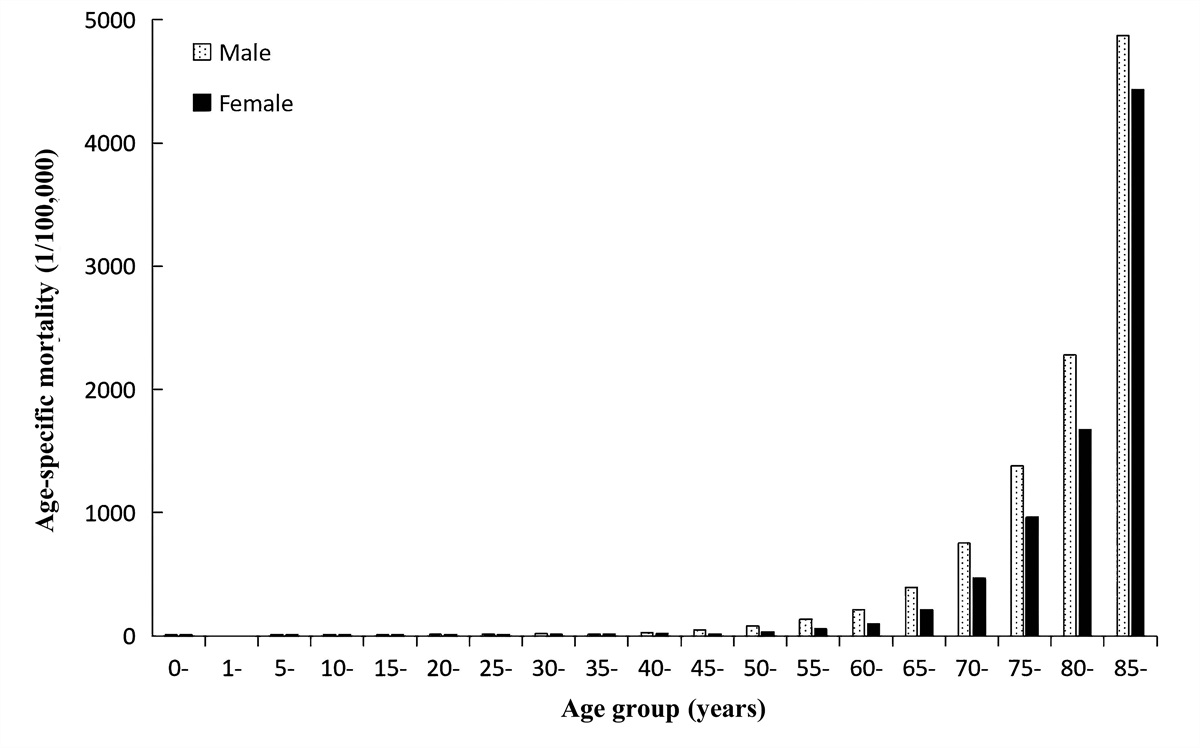
As illustrated in Figure 1, the disease burden of MM clustered in age groups older than 40 years. The DALY number was more than 10,000 in the 40 to 44 years age group, and reached the peak (57,038) in the 65 to 69 years age group, while the age-specific DALY rates per 100,000 were more than 50.00 in the 55 to 59 years age group and reached the peak (93.82) in the 70 to 74 years age group [Figure 1A]. After the age of 20 years, the value and rate for the age-specific incidence, mortality and prevalence saw an upward trend with aging. The incidence, mortality, and prevalence simultaneously reached the peak in the 65 to 69 years age group, while the age-specific rates reached the peak in the 75 to 79 years [Figure 1B], over 80 years [Figure 1C], and 70 to 74 years [Figure 1D] age groups. As displayed in Supplementary Table 1 [https://links.lww.com/CM9/B432], the age-specific incidence, mortality, and prevalence rates reached the peak in the age group over 80 years in males and in the 70 to 75 years age group in females. In addition, males had higher age-specific incidence, mortality, and prevalence rates with approximately 1.5- to 2.0-fold sex-specific differences than females [Supplementary Table 1, https://links.lww.com/CM9/B432].
 Figure 1:
 Disease burden of MM in 2019 among different age groups: (A) DALYs and age-specified DALYs rates, (B) incident cases and age-specified incidence rates, (C) Deaths and age-specified mortality rates, and (D) prevalent cases and age-specified prevalence rates. DALYs: Disability-adjusted life years; MM: Multiple myeloma.
Disease burden of MM stratified by provincal-level divisions in 2019The disease burden of MM by provincal-level divisions is illustrated in [Figure 2, Supplementary Table 2, https://links.lww.com/CM9/B432, and Supplementary Figure 1, https://links.lww.com/CM9/B432]. The DALY numbers were highest in Sichuan, Shandong, and Jiangsu, and were lowest in the Macao, Tibet, and Qinghai [Supplementary Figure 1A, https://links.lww.com/CM9/B432]. The age-standardized DALY rates were highest in Shanghai, Zhejiang, and Xinjiang and were lowest in Shandong, Hainan, and Macao (Supplementary Figure 1B, https://links.lww.com/CM9/B432). The age-standardized incidence rates were highest in Shanghai, Zhejiang, and Beijing and were lowest in Tibet, Hainan, and Guizhou [Figure 2A] in 2019. The age-standardized mortality rates were highest in Shanghai, Zhejiang, and Xinjiang and were lowest in Shandong, the Macao, and Guangdong [Figure 2B] in 2019.
 Figure 2:
 ASIRs and ASMRs of MM in the province of China, 1990 and 2019: (A) ASIR of MM and (B) ASMR of MM. ASIRs: Age-standardized incidence rates; ASMRs: Age-standardized mortality rates; MM: Multiple myeloma.
SDI correlated with age-standardized incidence and prevalence rates (r values were 0.68 and 0.75, P were both <0.01, Supplementary Figure 1D and 1H, https://links.lww.com/CM9/B432) but not with age-standardized mortality and DALY rates (r values were 0.32 and 0.31, P were both equal to 0.07, Supplementary Figure 1F and 1B, https://links.lww.com/CM9/B432) or numbers of DALYs, incidence, deaths and prevalence cases (Supplementary Figure 1A, 1C, 1E, and1G, https://links.lww.com/CM9/B432).
Trends in disease burden of MM from 1990 to 2019From 1990 to 2019, the DALY of MM increased by 134%, with the age-standardized DALYs remaining stable [Figure 3, Supplementary Table 3, https://links.lww.com/CM9/B432]. Moreover, the incidence and mortality increased by 209% and 151%, respectively.
 Figure 3:
 Trends in the disease burden of MM from 1990 to 2019: (A) trends in number- and age-standardized DALYs and (B) trends in number-standardized incidence and mortality rates and ASIR and ASMR. ASIR: Age-standardized incidence rate; ASMR: Age-standardized mortality rate; DALYs: Disability-adjusted life years; MM: Multiple myeloma.
DiscussionBased on the standardized methods of GBD 2019, the present study comprehensively evaluated the disease burden of MM in China. During the past three decades, the MM incidence case number doubled, and the mortality number increased by 1.5-fold. Moreover, the DALY number increased by 1.3-fold regardless of the stable age-standardized rate of DALYs.
Age played a crucial role in the pattern of the disease burden of MM. Older individuals had a higher MM incidence than adolescents and young adults. In the United States, the age-specific incidence rates were highest in the age group older than 80 years and were lowest in the age group aged 20 to 49 years (38.32 vs. 1.20 per 100,000).[7] Furthermore, a population study in Canada involving 32,065 cases of MM demonstrated that the mean age at diagnosis was 70 years, with 80.0% of cases being diagnosed at more than 60 years.[8] Similarly, a study from New Zealand reported that the incidence rate of MM revealed an approximately 30-fold increase in the 65 to 99 years group compared to the 35 to 44 years group.[9] A population-based analysis in China also demonstrated that the crude incidence rate of MM doubled in age groups older than 60 years compared with age groups younger than 60 years.[10] In the present study, the age-specific incidence rate increased sharply after 40 years, with the peak occurring in the 65 to 69 years age group. These findings confirmed that the disease burden of MM had a statistically significant upward trend with age.
Aging contributes to the changing disease burden of MM.[11] A systematic analysis based on GBD 2016 reported that global incident cases of MM increased from 61,307 in 1990 to 138,509 in 2016, of which the aging population contributed 52.9%.[12] It is forecasted that there would be 18,500 male and 13,700 female cases of MM per year from 2032 to 2034 in America, of which the largest increases are expected in the 64–84 years age group, with an increase of 93% in males and 91% in females.[13] A study in Japan predicted that the MM incidence rates would increase by 169% in age groups older than 65 years and decrease by 11% in age groups younger than 65 years from 2010 to 2040.[14] The ever-growing total population and aging population in China are associated with the increasing burden of MM observed in the present study. The Chinese population increased by 21.8% during the past three decades (from 1,176,884 thousand in 1990 to 1,433,784 thousand in 2019), while the expected population number aged more than 65 years increased by 148.2% (from 66,260 thousand in 1990 to 164,487 thousand in 2019). Moreover, the Chinese population is estimated to remain stable in the next ten years, with an estimated population number of 1,464,340 thousand in 2030, while the expected population of more than 65 years will increase by 43.4% (from 172,262 thousand in 2020 to 246,98 thousand in 2030).[15] These findings highlight the need to establish MM prevention and control strategies in an aging society.
The aggravating trend of the burden of MM may be partly explained by some factors, such as improvement in patient survival.[16,17] A study from the United States demonstrated that the percentage of patients using novel agents and hematopoietic stem cell transplantation in 1976 patients with MM markedly increased from 3.9% and 11.1% in 1999 to 75.5% and 21.7% in 2007.[18] Moreover, the 5-year survival rate increased from 26.4% in 1981–1990 to 46.5% in 2001–2010 in the United States[19] and from 27.4% in 1994–2001 to 38.8% in 2002–2009 in Spain.[20] Similarly, a Chinese study demonstrated that the 5-year survival rate of 530 patients with MM increased from 51.6% to 59.2% after the introduction of bortezomib.[21] In the present study, the MM mortality slowly increased compared to the significant increase in the incidence over the past three decades, indicating that more patients achieved improved outcomes. These findings support that the impact of healthcare access and treatment advances on the burden of MM should be evaluated in future studies.
The present study has several limitations. First, the analysis was based on the data of GBD 2019 and thus had all the general methodology limitations described by the GBD collaboration group. Second, the comparison of race differences at national and provincial levels was not conducted due to the deficiency of primary raw data. Third, although population growth and aging structures were taken into account during the analysis of temporal trends of MM burden, the results should be interpreted cautiously when considering the impact of other factors, such as the human development index.[22]
In conclusion, the present study updated the epidemiological characteristics of MM burden in China based on the comprehensive analysis of GBD 2019, observing heterogeneous differences in sex and geography. Of note, the incidence of MM doubled despite the stable age-standardized incidence rate. The study results provide a powerful basis for developing disease prevention and management strategies.
Conflicts of interestNone.
References 1. Sung H, Ferlay J, Siegel RL, Laversanne M, Soerjomataram I, Jemal A, et al. Global cancer statistics 2020: GLOBOCAN estimates of incidence and mortality worldwide for 36 cancers in 185 countries. CA Cancer J Clin 2021; 71:209–249. doi: 10.3322/caac.21660. 2. GBD 2019 Diseases and Injuries Collaborators. Global burden of 369 diseases and injuries in 204 countries and territories, 1990–2019: a systematic analysis for the Global Burden of Disease Study 2019. Lancet 2020; 396:1204–1222. doi: 10.1016/S0140-6736(20)30925-9. 3. Liu J, Liu W, Mi L, Zeng X, Cai C, Ma J, et al. Incidence and mortality of multiple myeloma in China, 2006–2016: an analysis of the Global Burden of Disease Study 2016. J Hematol Oncol 2019; 12:136doi: 10.1186/s13045-019-0785-7. 4. Liu W, Liu J, Song Y, Wang X, Zhou M, Wang L, et al. Mortality of lymphoma and myeloma in China, 2004–2017: an observational study. J Hematol Oncol 2019; 12:22doi: 10.1186/s13045-019-0706-9. 5. GBD 2019 Risk Factors Collaborators. Global burden of 87 risk factors in 204 countries and territories, 1990–2019: a systematic analysis for the Global Burden of Disease Study 2019. Lancet 2020; 396:1223–1249. doi: 10.1016/S0140-6736(20)30752-2. 6. Xu T, Wang B, Liu H, Wang H, Yin P, Dong W, et al. Prevalence and causes of vision loss in China from 1990 to 2019: findings from the Global Burden of Disease Study 2019. Lancet Public Health 2020; 5:e682–e691. doi: 10.1016/S2468-2667(20)30254-1. 7. Ellington TD, Henley SJ, Wilson RJ, Wu M, Richardson LC. Trends in solitary plasmacytoma, extramedullary plasmacytoma, and plasma cell myeloma incidence and myeloma mortality by racial-ethnic group, United States 2003–2016. Cancer Med 2021; 10:386–395. doi: 10.1002/cam4.3444. 8. Tsang M, Le M, Ghazawi FM, Cyr J, Alakel A, Rahme E, et al. Multiple myeloma epidemiology and patient geographic distribution in Canada: a population study. Cancer 2019; 125:2435–2444. doi: 10.1002/cncr.32128. 9. Sneyd MJ, Cox B, Morison IM. Trends in myeloma incidence, mortality and survival in New Zealand (1985–2016). Cancer Epidemiol 2019; 60:55–59. doi: 10.1016/j.canep.2019.03.006. 10. Wang S, Xu L, Feng J, Liu Y, Liu L, Wang J, et al. Prevalence and incidence of multiple myeloma in urban area in China: a national population-based analysis. Front Oncol 2020; 9:1513doi: 10.3389/fonc.2019.01513. 11. Turesson I, Bjorkholm M, Blimark CH, Kristinsson S, Velez R, Landgren O. Rapidly changing myeloma epidemiology in the general population: increased incidence, older patients, and longer survival. Eur J Haematol 2018; 101:237–244. doi: 10.1111/ejh.13083. 12. Cowan AJ, Allen C, Barac A, Basaleem H, Bensenor I, Curado MP, et al. Global Burden of multiple myeloma: a systematic analysis for the Global Burden of Disease Study 2016. JAMA Oncol 2018; 4:1221–1227. doi: 10.1001/jamaoncol.2018.2128. 13. Rosenberg PS, Barker KA, Anderson WF. Future distribution of multiple myeloma in the United States by sex, age, and race/ethnicity. Blood 2015; 125:410–412. doi: 10.1182/blood-2014-10-609461. 14. Narimatsu H, Sakaguchi M, Nakamura S, Katayama K. Future patient incidence in hemato-oncology: a study using data from cancer registries in Japan. Risk Manag Healthc Policy 2020; 13:2407–2414. doi: 10.2147/RMHP.S277207. 15. United Nations, Department of Economic and Social Affairs, Population Division. World Population Prospects 2019, Online Edition; 2019. Available from: https://population.un.org/wpp/Download/Standard/Population [Accessed January 5, 2021]. 16. Ailawadhi S, Bhatia K, Aulakh S, Meghji Z, Chanan-Khan A. Equal treatment and outcomes for everyone with multiple myeloma: are we there yet? Curr Hematol Malig Rep 2017; 12:309–316. doi: 10.1007/s11899-017-0393-y. 17. Yip W, Fu H, Chen AT, Zhai T, Jian W, Xu R, et al. 10 years of health-care reform in China: progress and gaps in Universal Health Coverage. Lancet 2019; 394:1192–1204. doi: 10.1016/S0140-6736(19)32136-1. 18. Warren JL, Harlan LC, Stevens J, Little RF, Abel GA. Multiple myeloma treatment transformed: a population-based study of changes in initial management approaches in the United States. J Clin Oncol 2013; 31:1984–1989. doi: 10.1200/JCO.2012.46.3323. 19. Sun T, Wang S, Sun H, Wen J, An G, Li J. Improved survival in multiple myeloma, with a diminishing racial gap and a widening socioeconomic status gap over three decades. Leuk Lymphoma 2018; 59:49–58. doi: 10.1080/10428194.2017.1335398. 20. Chang-Chan DY, Ríos-Tamayo R, Rodríguez Barranco M, Redondo-Sánchez D, González Y, Marcos-Gragera R, et al. Trends of incidence, mortality and survival of multiple myeloma in Spain. A twenty-three-year population-based study. Clin Transl Oncol 2021; 23:1429–1439. doi: 10.1007/s12094-020-02541-1. 21. He J, He D, Han X, Zheng G, Wei G, Zhao Y, et al. Bortezomib-based regimens for newly diagnosed multiple myeloma in China: a report of 12-year real-world data. Front Pharmacol 2020; 11:561601doi: 10.3389/fphar.2020.561601. 22. Bray F, Jemal A, Grey N, Ferlay J, Forman D. Global cancer transitions according to the Human Development Index (2008–2030): a population-based study. Lancet Oncol 2012; 13:790–801. doi: 10.1016/S1470-2045(12)70211-5.
Comments (0)