
Remember me


Highlights
This study presents a comprehensive bibliometric analysis of the top 100 cited articles on TJR (T100TJR) using the modern DDPP analytics model. Key entities in T100TJR since 2010 include the United States, the University of Sherbrooke, the year 2017, and Dr Hawker from Canada. Two highly cited articles were identified and emphasized as recommended reads, potentially inspiring further bibliometric research on joint replacement. 1. IntroductionIt is reported that approximately 250 million people worldwide suffer from osteoarthritis of the hip and knee, which is estimated to increase over time.[1,2] Several studies have shown that total hip arthroplasty (THA) and total knee arthroplasty (TKA) are effective procedures for treating osteoarthritis of the hip and knee and can remedy deformities, improve function, maintain mobility, and reduce pain in the joint.[3–5] After lower limb joint replacement, physical rehabilitation also plays a crucial role in improving functional outcomes, optimizing physical activity, enhancing the clinical and social benefits, and promoting the patient’s return to normal activities.[5,6] The global prevalence of total joint arthroplasty (TJA) is on the rise, driven by an aging population and the widespread incidence of osteoarthritis.[7] Despite this, there has been a lack of research focusing on the top-cited literature concerning the use of telerehabilitation for joint replacement (TJR) for THA and TKA.
1.1. Postoperative rehabilitation services are requiredThe escalating demand for postsurgical rehabilitation services has led to inflated costs and extended waiting lists, posing a formidable challenge to the sustainability of traditional face-to-face rehabilitation services.[8,9] Compounding this issue is the global spread of coronavirus disease 2019 since March 2020.[10] Strict social distancing mandates and rigorous infection control measures within hospitals and communities have considerably hindered the provision of in-person care by healthcare professionals.[11] In light of these challenges, the utilization of telerehabilitation services[12] presents a viable approach to managing patients who have undergone THA/TKA.
Telerehabilitation[13–15] is a subset of rehabilitation services that allows for the remote delivery of physical rehabilitation services, such as assessment, monitoring, intervention, supervision, education, consultation, and counseling, through the use of information and communication technology.[5] It presents an innovative approach that can supplement or serve as an alternative to traditional face-to-face interventions.[13] Telerehabilitation aids patients in transitioning back home and into the community following acute illnesses, thereby reducing hospital stays and healthcare costs.[16] Compared to conventional in-person rehabilitation, telerehabilitation offers numerous advantages, including decreased travel time, adherence to social distancing measures, and improved accessibility and feasibility.[17]
Telerehabilitation technologies enable patients experiencing significant pain and limited mobility to access healthcare services from home or another remote location.[18,19] This reduces patient stress and enhances satisfaction by enabling patients to exercise in a familiar environment following joint replacement.[20] As such, telerehabilitation has garnered substantial attention across various clinical conditions, including stroke, musculoskeletal conditions, cardiopulmonary rehabilitation, and breast cancer.[21–23]
1.2. Literature reviews of TJR and bibliometricsNumerous recent systematic reviews have evaluated the effectiveness of telerehabilitation for patients following TJA.[5,7,23,24] These studies have reported that telerehabilitation significantly alleviates pain, enhances range of motion, and improves physical function when compared to traditional face-to-face rehabilitation.[25] According to these reviews, TJR holds promise for both preventive and therapeutic activities. Given the multitude of publications on the subject of TJR for TJA, it is crucial to provide an exhaustive overview of the field by analyzing these research studies.
Bibliometric analysis is a well-established and robust statistical method for exploring and assessing large volumes of scientific literature.[26] This technique allows for the examination of knowledge structures and evolving trends within a specific field, generating quantitative, replicable, and reliable data.[27] Through the analysis of citations, cocitations, geographical distribution, and word frequency, bibliometric approaches allow researchers to delve into specific research domains, yielding invaluable insights.[28] Moreover, bibliometric analyses, particularly with a focus on 100 top-cited (T100) articles,[29] foster interdisciplinary collaboration by aiding scholars, clinicians, and health policy makers in gathering information to better understand a particular research field and its applications.[30]
1.3. Drawbacks with bibliometric analysis in 100 top-cited articlesWhile the bibliometric analysis of top-cited articles provides meaningful insights, it is important to note several limitations: there can be an overabundance of graphs and tables, potentially overwhelming readers (e.g., 27 graphs and 15 tables in a single article).[31] Graphics generated by bibliometric software may be cluttered and unclear, with labels that are too small to read (not author-centered orientation).[31] Article classifications are often done manually, not via cluster analysis, which could introduce bias or error (e.g., in the classification of the 100 top-cited articles on adult spinal deformity).[32] There is a lack of comparison with articles outside of the top-cited list (e.g., discussions are limited to the top 100 articles on psoriasis).[33] All top-cited articles are simply listed with Tables[34] for better comprehension (e.g., as seen in this article with a visual impact beam plot).[35] Results are often presented without a structured framework, such as the descriptive, diagnostic, predictive, and prescriptive analytics (DDPP) model, which could provide a more focused approach to analysis.[27,28,30] Therefore, it is necessary to overcome those aforementioned problems by applying a modern approach to the bibliometric analysis of T100 articles.
1.4. Study aimsTo circumvent the 6 limitations traditionally encountered in bibliometric analysis of the top 100 cited articles, we adopt the DDPP analytics model to help us understand the current landscape, diagnose underlying classifications, predict future trends, and make data-driven decisions (for example, identifying noteworthy articles for further reading).[27,28,30] With this methodology, we aim to explore the characteristics of the top 100 cited articles on TJR for joint replacement (T100TJR).
2. Methods 2.1. Data sourceA comprehensive search of the Web of Science Core Collection was conducted to locate all pertinent English-language documents related to TKA or THA from the database’s inception until August 2, 2023, with a series of search terms and strategies (Supplemental Digital Content 1, https://links.lww.com/MD/K942). We collected a total of 712 articles and obtained T100TJR articles; see Supplemental Digital Content 2, https://links.lww.com/MD/K943.
Since all data shown in Supplemental Digital Content 2, https://links.lww.com/MD/K943 were obtained from Web of Science, ethical approval was not required for this study.
2.2. Four analytics applied to this study 2.2.1. Descriptive analytics in 712 articles.To visualize the productive entities and journals within the 712 and T100TJR articles, two 4-quadrant radar plots[36] were applied to display their top 10 countries, institutes, years, and authors (CIYA). A pyramid plot in R[37] was utilized to highlight the top 20 prestigious journals with the most publications in T100TJR.
The absolute advantage coefficient (AAC) (see Eqs. 1–3)[38,39] was applied to evaluate the dominance extent for the most influential CIYA in CJAL scores[36] (based on the CJA score[40] and the L-index[41] to evaluate research achievements). The Y-index[42,43] based on the 1st and corresponding authors was applied to locate their coordinates on the 4-quadrant radar plot.[36]
AAC=(R12/R23)/(1+(R12/R23)),
R12= A1/A2,
R23= A2/A3,
where the AAC ratio is determined by the 3 consecutive numbers of values (e.g., top 3 CJAL scores in descending order denoted by A1, A2, and A3 in Eqs. 2 and 3). The ACC ranged from 0 to 1.0, representing the strength of dominance for the top member when compared to the next 2 members. Through the computation of AAC, the dominance strength in a variable (i.e., CIYA) can be measured and judged by the effect size, with criteria of <0.5, between 0.5 and 0.7, and not less than 0.7 as the small, medium, and large effect sizes, respectively.[38]
2.2.2. Diagnostic analytics in 712 articles and T100TJR. 2.2.2.1. Author collaborations.Country-/institute-based collaborations among authors and article themes are commonly observed in bibliometric analysis. However, there has been limited research regarding the interpretation of cluster analysis and its suitability for use in bibliometrics. The follower-leading clustering algorithm (FLCA) algorithm for cluster analysis[35,44] was applied to present author collaborations in a simple but clear and interpretable manner using network diagrams.
2.2.2.2. Coword and theme analyses.Coword analysis[45–47] was performed to extract the chief keywords in clusters as themes (or leaders) represented by Keywords Plus that were retrieved from the Web of Science Core Collection. The themes denoted by the chief keywords in clusters were then assigned to T100TJR using a chord diagram.[48,49]
2.2.3. Trends observed by predictive analytics in T100TJR.Cluster analysis was performed to identify keywords observed in year spans with 2-mode data in R.[37] The major keywords can be observed over years using the temporal hotspot plot.[50,51]
The number of connections for a specific keyword plus was computed based on an equal weight in an article.[38,47,52] The weighted mean citation for each term was applied to predict article citations based on the correlation coefficient (CC) in determining the predictive power related to original article citations. The CC t value was calculated using the following formula (=CC×n−21−CC×CC)[38,47] A prediction equation was produced through simple regression analysis using MedCalc statistical software, version 9.5.0.0 (MedCalc, New York, NY). A scatter plot with 95% control lines[52,53] was used to display the relationship between weighted mean citations and article citations in T100TJR.
2.2.4. Prescriptive analytics in T100TJR.The impact timeline view (ITV)[35] was applied to display T100TJR. With the ITV, the most worth-reading articles with more citations were highlighted by the bubble size. The publication years are on the horizontal axis and the years on the vertical axis. The definitions of these themes were assigned to each article using bubble colors for identification. All those articles could be linked to Web of Science (WoS) once the dot representing an article in ITV was selected and clicked.
2.3. Creating dashboards on Google MapsAll graphs were drawn by author-made modules on the R platform[37] for generating visualizations. We created HTML pages used for Google Maps (i.e., the opacity has been set to zero). The way to draw the visualization involved in this study is described in Supplemental Digital Content 3, https://links.lww.com/MD/K944.
3. Results 3.1. Descriptive analytics in 712 and T100TJR articlesThe most productive contributors in 721 articles were the United States, The University of Queensland in Australia, 2022, and the author Dr Hawker in Canada, as shown in Figure 1 (top). The US dominates the field based on the CJAL score, with a large effect of AAC equal to 0.77 (>0.7).[38]
 Figure 1.:
 The leading entities in 6526 (top) and T100TJR (bottom) articles using the CJAL score for evaluation.
Among the T100TJR articles, the leading entities since 2010 were the United States (among countries), the University of Sherbrooke in Canada (among institutions), the year 2017 (among publication years), and Hawker GA from Canada (among authors). in terms of CJAL scores, as shown in Figure 1 (bottom).
The Journal of the Osteoarthritis Cartilage ranks first in citations, with an article[52] with 1882 citations since 2008; see Figure 2.
 Figure 2.:
 Top 20 prestigious journals in T100TC from the bottom to the top.
3.2. Diagnostic analytics in 712 articles and T100TJRIn T100TJR, Figure 3 (top) presents 3 major clusters led by the US, France, and Sweden. Figure 3 (bottom) displays 2 major clusters led by the University of Sherbrooke in Canada and the University of Queensland in Australia. Only 20 elements are shown in the network charts. A clear distinction can be observed using the FLCA algorithm to cluster them. The traditional visualization appears cluttered with numerous connections, whereas the FLCA visualization offers a more organized and concise display. An important observation to highlight is that the sizes of the bubbles in the visualization are determined by the number of articles. Specifically, larger bubbles also indicate stronger and more extensive connections between countries/institutes. This visual representation allows for a quick understanding of the intensity and significance of collaborations within the research network.
 Figure 3.:
 Top 20 country- and institute-based author collaborations in T100TJR with networks using cluster analysis.
Similarly, 2 themes (replacement and arthroplasty) were found in the top 20 keywords, and 4 themes (with additional laparoscopic surgery and orientation) were found in T100TJR, as shown in Figure 4.
 Figure 4.:
 Two themes (replacement and arthroplasty) were found in the top 20 keywords, and 4 themes (with additional laparoscopic surgery and orientation) were found in T100TJR.
3.3. Predictive analytics in T100TJRFigure 5 (top) presents twenty major keywords in 2 distinct year spans (1992–2009 and 2010–2020) (top) led by rehabilitation and surgery, respectively, with most counts observed.
 Figure 5.:
 Twenty major keywords in 2-year spans (1992–2009 and 2010–2020) (top) along with their temporal hotspots (bottom) (note, trend analysis of keywords is shown on the last columns with 5 types, based on the last 4 years, including increasing, ready to rise, slowdown, ready to decline, and stationarity).
Figure 5 (bottom) displays 20 keyword hotspots over the years. We can see that the 2 keywords of replacement and arthroplasty have longer hotspots in early and later stages (approximately 2010 and 2015, respectively).
To utilize the keyword weights to predict article citations, according to our results, keywords plus in WoS were evident in prediction power on the number of article citations (CC = 0.98, t = 55.05), as shown in Figure 6. The regression equation is defined as article citation (y) = −43.1750 + 1.3759 ×Weight(x) of the keyword plus. The slope coefficient presented statistical significance (F = 3030.37, P < .0001). As soon as the QR code in Figure 6 is scanned, the article appears instantly on WoS when the bobble of interest is clicked.
 Figure 6.:
 Using weighted score with keywords plus to predict article citations.
3.4. Prescriptive analytics in T100TJRThe ITV shown in Figure 7, which includes T100TJR articles, indicates that articles with the theme of replacement account for 89%, followed by arthroplasty (9%). The most worth-reading articles with more citations are highlighted by the bubble size denoted by symbol A (i.e., article[54] with 1882 citations).
 Figure 7.:
 Articles worth reading are shown on an ITV (note: citing articles and cited articles are linked with red curves) in T100TJR. ITV = impact timeline view.
Another one with symbol B (i.e., the article[55] with 235 citations) has been cited in T100TJR. As such, Figure 7 illustrates the T100TJR worth reading. Two articles[54,55] were recommended and abstracted in the Discussion section. The article appears on the website immediately after clicking the dot of interest.
3.5. Online dashboards shown on Google MapsSome graphs[56–60] with the QR codes in Figures are linked to the dashboards if the QR code is scanned. Readers are suggested to examine the details about article information laid on Google Maps.
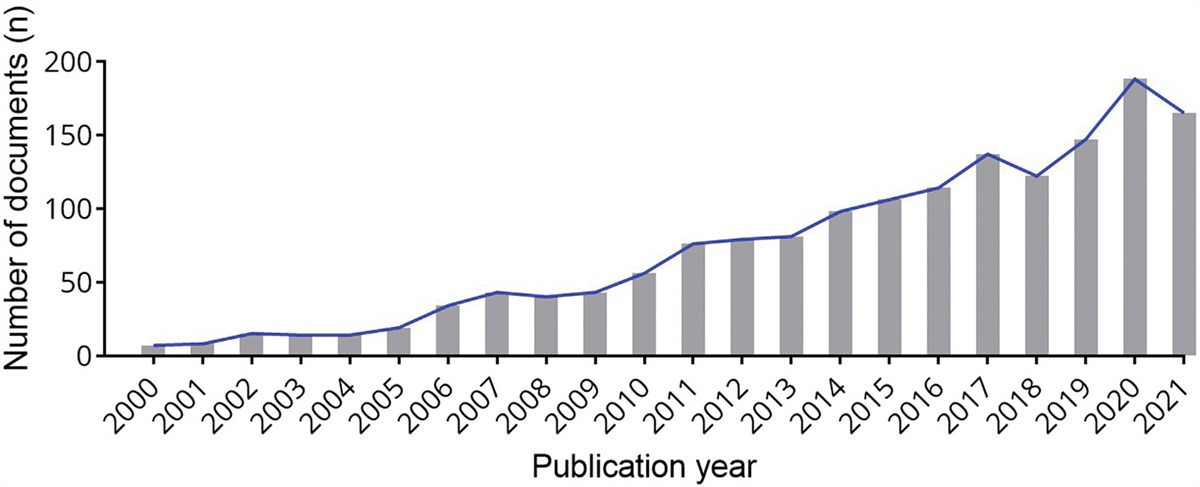
4. Discussion 4.1. Principal findingsOur search yielded a total of 712 articles, demonstrating a consistent upward trend in publication volume over the study period, with a noticeable peak in 2022. The United States stood out as the most influential contributor. Among the top 100 cited articles on Total Joint Replacement (T100TJR), the leading contributors since 2010 have been the United States (in terms of countries), the University of Sherbrooke in Canada (institutions), the year 2017 (publication years), and Hawker GA from Canada (authors). We identified four main thematic areas, replacement being the most common theme, featuring in 89% of the articles. A significant correlation was found between the number of citations an article received and the weight of its keywords (F = 3030.37; P < .0001). Additionally, we spotlighted 2 articles with the highest citation counts as recommended reading.
Accordingly, we adopt the DDPP analytics model that circumvents the limitations in traditional bibliometric analysis on T100 articles, such as 7 graphs against too many graphs and tables, potentially overwhelming readers (e.g., 27 graphs and 15 tables in a single article)[31]; clear graphs with the FLCA algorithm against those cluttered and unclear, with labels that are too small to read (not author-centered orientation)[31]; using the FLCA for article classifications against those done manually[32]; 712 and T100TJR articles against traditional T100 with a lack of comparison with articles outside of the top-cited list[33]; ITV against T100 articles listed[34]; and structured results using the DDPP model against the traditional unstructured framework for describing the characteristics of T100 articles.
4.2. Additional Information 4.2.1. Dominant entities in TJR research.In terms of country-specific distributions, the United States significantly leads the research in TJR, as evidenced by an AAC of 0.77 (greater than 0.70), signifying a strong impact. The United States is responsible for approximately a quarter of all documents (182 out of 712, equating to 26%), which reflects its robust research capabilities and commitment to advancing this field. Following the United States are other developed countries, such as Australia, Canada, and the United Kingdom, indicating a high level of technological development in telerehabilitation within these nations.
In terms of institutional contributions, the University of Sherbrooke in Canada leads in the T100TJR articles, a testament to its strong academic environment and scientific prowess.
A total of 712 articles were identified, with the number of publications showing a steady increase over the study period, peaking notably in 2022.
Among various publication venues, the Journal of Clinical Orthopedics and Related Research is the most productive source in T100TJR articles, contributing 14%, followed closely by the Journal of Bone and Joint Surgery-American Volume at 13%.
Prominent individual contributors, based on the number of first and corresponding authorships, include Dr Hawker (Canada) and Dr Tousignant (Canada). Given their significant contributions to TJR research, their work is worth paying attention to.
4.2.2. Two types of Telerehabilitation.Telerehabilitation can be divided into 2 types based on the mode of communication and information transfer: synchronous and asynchronous. Synchronous telerehabilitation involves real-time interaction between therapists and patients, facilitated by technologies such as phone calls and video conferencing.[11] On the other hand, asynchronous telerehabilitation is characterized by a delay in information exchange, with email and messaging services being common methods.[17]
Recent systematic reviews and meta-analyses have shown that telerehabilitation can achieve similar improvements in clinical outcomes (such as knee extension range, pain levels, muscle strength, knee joint swelling, and WOMAC and KOOS scores) in patients who have undergone joint arthroplasty compared to traditional in-person rehabilitation.[5,24,61,62] Moreover, telerehabilitation has proven to be more cost-effective than conventional face-to-face rehabilitation when the distance between the patient and the physical therapist exceeds 30 kilometers.[63]
However, asynchronous telerehabilitation has challenges, with a reported 13% dropout rate. This is primarily attributed to the lack of personal interaction between the therapist and the patient.[64] Factors contributing to the effectiveness of telerehabilitation include the elimination of travel and waiting times, ease of access to equipment at home leading to more effective therapy, and the convenience of integrating therapy into the patient’s daily routine.[5] Despite the lack of in-person supervision, the convenience and flexibility of telerehabilitation may actually stimulate patients’ motivation to continue therapy and reintegrate into their daily lives.[65]
4.2.3. Telerehabilitation has become a hot research topic.Telerehabilitation interventions for arthroplasty can be delivered in either synchronous or asynchronous modes, depending on whether the healthcare provider and patient interact in real time.[66] Synchronous telerehabilitation, which includes physical therapy assessments, supervised exercises, and home activity prescriptions, requires both the patient and provider to have a strong internet connection and be present in front of a screen simultaneously. This model also necessitates technicians to install or fix equipment at patients’ homes and training sessions to handle the complex technology.[67]
Asynchronous telerehabilitation, on the other hand, provides disease information, pain management techniques, cognitive behavioral therapy, and prevention strategies for complications. Mobile applications, in particular, offer a more flexible and accessible means of delivering telehealth support, allowing patients to review the rehabilitation program at their convenience.[68,69] The shift from synchronous to asynchronous modes, from telephone to video conferencing and then to mobile applications, mirrors the technological advancements in telehealth.[70]
The rapid adoption of mobile applications for delivering telerehabilitation services is driven by their convenience and accessibility.[71] These applications offer a wide range of services, including daily postoperative care education, exercise demonstrations, reminders, and progress monitoring.[66,71] Our study’s temporal bar chart (Fig. 5) shows a surge in telerehabilitation hotspots in recent years, marked by a series number of #14. This indicates that telerehabilitation has become a trending research topic in the TJR field in recent years.
4.3. Two worthy reading articlesIn light of their high citation counts, 2 articles[54,55] were recommended as essential reading materials for researchers interested in the TJR field.
The most cited article[54] classified as replacement was cited 1882 times and published in 2008. A systematic review of existing guidelines was undertaken for the management of hip and knee osteoarthritis. A core set of management modalities was generated based on the agreement between guidelines, and consensus r
Comments (0)