
Remember me


Gastric cancer is one of the most common cancers, ranking fifth in incidence and fourth in mortality worldwide.[1] Its incidence is highest in East Asia, including Korea, which is mainly a result of the high seroprevalence of Helicobacter pylori (H pylori) and a high-salt diet, both of which are well-established risk factors for gastric cancer.[2,3] Obesity is also a known risk factor for gastric cancer, especially in the cardia. However, the associations of obesity with non-cardia gastric cancer and gastric cancer in Asians are weak.[4] Only a handful of studies have addressed the relationship of lipid profiles with the risk of gastric cancer. A few studies have shown that elevated levels of high-density lipoprotein cholesterol (HDL-C) were associated with a reduction in gastric cancer risk, but most of these were hospital-based studies with a relatively small number of enrolled subjects.[5,6] One nationwide cohort study revealed a higher risk of gastric cancer in subjects with low HDL-C levels than in those with normal HDL-C levels, but the effect of high HDL-C levels on gastric cancer risk was not evaluated.[7] Previous studies have shown contradictory results for low-density lipoprotein cholesterol (LDL-C) and total cholesterol (TC). Some studies reported that higher LDL-C and TC levels were associated with a lower risk of gastric cancer,[8–11] while others found the opposite result[6] or reported no significant correlation.[12,13]
In this nationwide population-based study, we aimed to clarify the relationship between serum cholesterol levels and gastric cancer risk using data from the Korean National Health Insurance Service (NHIS) database. It is expected that these findings will enhance our understanding of the metabolic risk factors of gastric cancer and provide evidence for preventive measures.
2. Methods 2.1. Data source and study populationWe used anonymized data provided by the Korean National Health Insurance Sharing Service. The National Health Insurance Service (NHIS) is a national insurance service in Korea that covers approximately 97% of the Korean population, with the rest being covered by the Medical Aid program. The NHIS maintains a national database of healthcare claims information, and since 2006, the healthcare claims data of the Medical Aid program have been incorporated into the NHIS database. Thus, from 2006 onwards, the NHIS data have represented the entire South Korean population and can now be accessed by researchers after approval from their institutional review board.
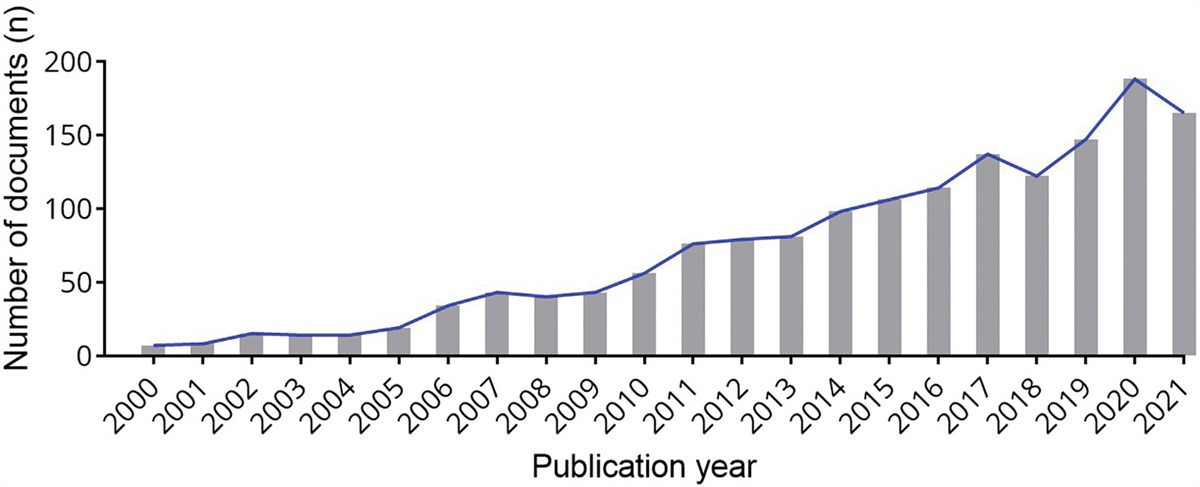
The NHIS provides general health care screening and national cancer screening for its enrollees biennially. The national cancer screening program provides gastroscopy exams to screen for gastric cancer in adults 40 years of age or older. In our study, we enrolled subjects older than 20 who received health screening examinations in 2009 (Fig. 1). Those with missing data (n = 705,296) and a history of any type of cancer (n = 153,917) were excluded. To limit the effects of preexisting gastric cancer, we also excluded patients who had been diagnosed with gastric cancer within 1 year from the index date (n = 36,867). Ultimately, a total of 9690,168 subjects were analyzed and followed up until December 31, 2019.
 Figure 1.:
 Study flow showing the enrollment process. NHIS = National Health Insurance Corporation.
This study was exempted from review by the Institutional Review Board of Seoul National University, Korea (E-2212-094-1386) and the requirement for informed consent was waived due to the study’s retrospective design. The study was conducted in compliance with the Declaration of Helsinki of 1964.
2.2. DefinitionsBaseline data, including age, height (m), weight (kg), waist circumference (cm), and systolic and diastolic blood pressure, were collected on the day of screening. Data on health behaviors that have a known or possible association with gastric cancer was also collected: A questionnaire was used on the day of screening to inquire about smoking status (never, former, or current), alcohol consumption (none, <30 g/day, or ≥ 30 g/day), regular exercise (high-intensity activity ≥ 3 times/week or moderate-intensity activity ≥ 5 times/week). Comorbidities were identified using the International Classification of Disease, 10th revision (ICD-10) codes in the health claim data or results from the health care screening examination. Diabetes mellitus was defined as either a diagnosis of ICD-10 codes E11-14 with a prescription history of oral hypoglycemic agents/insulin or a fasting serum glucose level ≥ 126 mg/dL on screening. Dyslipidemia was defined as either a diagnosis of ICD-10 code E78 or a fasting total cholesterol level of ≥ 240 mg/dL on screening. Hypertension was defined as either a systolic/diastolic blood pressure ≥ 140/90 mm Hg or a diagnosis of ICD-10 codes I10-13 or I15 and the prescription of at least one antihypertensive drug.
All laboratory tests, including TC, HDL-C, LDL-C, triglycerides, fasting serum glucose, and the glomerular filtration rate, were measured after 8 hours of fasting.
The primary endpoint was a diagnosis of gastric cancer, which was identified using ICD-10 code C16 and claims data.
2.3. Statistical analysisContinuous variables were represented as mean ± SD and compared using the Student t test, while categorical variables were represented as proportions and compared using the chi-square test. The incidence rate of gastric cancer was calculated by dividing the number of cases by 1000 person-years at risk. Male and female subjects were separately divided into four groups according to quartiles of HDL-C, LDL-C, and TC. The risk of gastric cancer in each quartile was calculated using a multivariable Cox proportional hazard model. The results are presented as hazard ratios (HRs) and 95% confidence intervals. Analyses were conducted separately according to sex and in the total population. A sensitivity analysis was done by excluding gastric cancer cases diagnosed within 3 years from the screening date. Subgroup analyses were done according to age (<55 vs ≥55 years) and statin use.
All statistical analyses were conducted using SAS version 9.4 (SAS Institute, Cary, NC). Statistical significance was set at a two-sided P value < .05.
3. Results 3.1. Baseline characteristicsThe baseline characteristics of the study population in total and according to sex are shown in Table 1. Among the 9690,168 total enrollees, 5301,695 were men, and 4388,473 were women. The average age of the study population was 47.06 years overall (45.72 years and 48.67 years men and women, respectively). The proportion of underweight (body mass index [BMI] < 18.5 kg/m2) subjects was higher among women, while the proportion of overweight or obese (BMI > 23 kg/m2) subjects was higher among men (all P < .001). There were more nondrinkers and never-smokers among women, while there were more men who exercised regularly (all P < .001). A higher proportion of men had diabetes mellitus or hypertension, while a higher proportion of women had dyslipidemia or were prescribed statins (all P < .001). The study population was classified according to quartiles of LDL-C, HDL-C, and TC in both sexes (see Table S1, Supplemental Digital Content, https://links.lww.com/MD/K858, which shows the cutoff values for each quartile groups).
Table 1 - Baseline characteristics of the study population. Total (N = 9690,168) Male (N = 5301,695) Female (N = 4388,473) P value Age (yr) 47.06 ± 13.97 45.72 ± 13.41 48.67 ± 14.45 <.0001 BMI (kg/m2) <18.5 (%) 357,670 (3.69) 117,610 (2.22) 240,060 (5.47) <.0001 18.5–23 (%) 3778,419 (38.99) 1780,187 (33.58) 1998,232 (45.53) 23–25 (%) 2386,598 (24.63) 1429,468 (26.96) 957,130 (21.81) 25–30 (%) 2822,423 (29.13) 1781,003 (33.59) 1041,420 (23.73) ≥30 (%) 345,058 (3.56) 193,427 (3.65) 151,631 (3.46) Waist circumference (cm) 80.24 ± 9.1 83.56 ± 7.82 76.22 ± 8.92 <.0001 Systolic blood pressure (mm Hg) 122.46 ± 15.05 124.67 ± 14.12 119.78 ± 15.7 <.0001 Diastolic blood pressure (mm Hg) 76.33 ± 10.07 78.05 ± 9.72 74.25 ± 10.09 <.0001 TC (mg/dL) 195.09 ± 36.79 194.38 ± 36.11 195.96 ± 37.58 <.0001 HDL-C (mg/dL) 56.1 ± 27.94 53.12 ± 25.23 59.7 ± 30.51 <.0001 LDL-C (mg/dL) 113.59 ± 38.6 112.04 ± 38.79 115.46 ± 38.27 <.0001 Fasting glucose (mg/dL) 97.27 ± 23.82 99.08 ± 25.71 95.07 ± 21.11 <.0001 GFR (mL/min/m2) 87.65 ± 45.41 87.98 ± 51.58 87.24 ± 36.58 <.0001 Diabetes mellitus (%) 831,880 (8.58) 514,311 (9.7) 317,569 (7.24) <.0001 Hypertension (%) 2581,857 (26.64) 1452,001 (27.39) 1129,856 (25.75) <.0001 Dyslipidemia (%) 1760,585 (18.17) 882,224 (16.64) 878,361 (20.02) <.0001 Statin use (%) 690,782 (7.13) 321,059 (6.06) 369,723 (8.42) <.0001 Cigarrette smoking Never (%) 5758,321 (59.42) 1603,414 (30.24) 4154,907 (94.68) <.0001 Ex-smoker (%) 1382,441 (14.27) 1301,941 (24.56) 80,500 (1.83) Current smoker (%) 2549,406 (26.31) 2396,340 (45.2) 153,066 (3.49) Alcohol consumption None (%) 4970,783 (51.3) 1697,939 (32.03) 3272,844 (74.58) <.0001 Mild (<30 g/d) (%) 3942,203 (40.68) 2875,641 (54.24) 1066,562 (24.3) Heavy (≥30 g/d) (%) 777,182 (8.02) 728,115 (13.73) 49,067 (1.12) Regular exercise (%) 1733,401 (17.89) 1051,820 (19.84) 681,581 (15.53) <.0001 Follow-up duration (yr) 9.15 ± 1.15 9.09 ± 1.26 9.22 ± 0.99 <.0001Continuous variables (mean ± standard deviation); categorical variables numbers (percentage).
BMI = body mass index, GFR = glomerular filtration rate, HDL-C = high density lipoprotein cholesterol, LDL-C = low density lipoprotein cholesterol, TC = total cholesterol.
The risk of gastric cancer according to the quartiles of serum cholesterol levels is shown in Table 2. In total, 92,403 cases of gastric cancer were diagnosed in our study population: 65,322 cases in men and 27,081 cases in women.
Table 2 - Risk of gastric cancer according to quartiles of high-density lipoprotein cholesterol, low-density lipoprotein cholesterol and total cholesterol. Total (n = 9690,168) Male (N = 5301,695) Female (N = 4388,473) IR* Model 1 HR (95% CI) Model 2 HR (95% CI) Model 3 HR (95% CI) IR* Model 1 HR (95% CI) Model 2 HR (95% CI) Model 3 HR (95% CI) IR* Model 1 HR (95% CI) Model 2 HR (95% CI) Model 3 HR (95% CI) HDL-C Q1 1.21 1 (ref.) 1 (ref.) 1 (ref.) 1.48 1 (ref.) 1 (ref.) 1 (ref.) 0.87 1 (ref.) 1 (ref.) 1 (ref.) Q2 1.04 0.86 (0.85–0.88) 0.97 (0.96–0.99) 0.98 (0.96–0.995) 1.32 0.89 (0.87–0.91) 0.97 (0.95–0.99) 0.97 (0.95–0.995) 0.70 0.82 (0.78–0.84) 0.96 (0.93–0.99) 0.97 (0.94–0.999) Q3 0.95 0.79 (0.77–0.80) 0.95 (0.94–0.97) 0.96 (0.94–0.98) 1.26 0.85 (0.83–0.87) 0.95 (0.93–0.97) 0.96 (0.93–0.98) 0.60 0.70 (0.67–0.72) 0.92 (0.89–0.95) 0.94 (0.91–0.97) Q4 0.97 0.81 (0.79–0.82) 0.97 (0.96–0.99) 0.98 (0.96–0.99) 1.36 0.92 (0.90–0.94) 0.98 (0.96–1) 0.98 (0.96–1.004) 0.51 0.60 (0.58–0.62) 0.89 (0.86–0.92) 0.91 (0.88–0.94) P for trend <.0001 <.0001 <.0001 <.0001 <.0001 .0004 <.0001 <.0001 <.0001 LDL-C Q1 1.03 1 (ref.) 1 (ref.) 1 (ref.) 1.44 1 (ref.) 1 (ref.) 1 (ref.) 0.54 1 (ref.) 1 (ref.) 1 (ref.) Q2 0.98 0.96 (0.94–0.97) 0.94 (0.93–0.96) 0.95 (0.93–0.97) 1.30 0.90 (0.88–0.92) 0.93 (0.91–0.95) 0.94 (0.92–0.97) 0.60 1.13 (1.09–1.17) 1.01 (0.98–1.05) 1.003 (0.97–1.04) Q3 1.04 1.02 (1.00–1.04) 0.94 (0.92–0.95) 0.94 (0.93–0.96) 1.32 0.92 (0.90–0.94) 0.92 (0.90–0.94) 0.94 (0.92–0.96) 0.71 1.32 (1.27–1.36) 1.01 (0.98–1.05) 0.996 (0.96–1.03) Q4 1.12 1.09 (1.07–1.11) 0.92 (0.90–0.93) 0.92 (0.91–0.94) 1.36 0.94 (0.92–0.96) 0.91 (0.89–0.93) 0.93 (0.91–0.95) 0.84 1.56 (1.51–1.61) 0.999 (0.97–1.03) 0.98 (0.94–1.01) P for trend <.0001 <.0001 <.0001 <.0001 <.0001 <.0001 <.0001 .7815 .4073 TC Q1 1.00 1 (ref.) 1 (ref.) 1 (ref.) 1.40 1 (ref.) 1 (ref.) 1 (ref.) 0.52 1 (ref.) 1 (ref.) 1 (ref.) Q2 1.01 1.02 (1.001–1.04) 0.995 (0.98–1.01) 0.99 (0.97–1.01) 1.35 0.97 (0.95–0.99) 1.01 (0.99–1.03) 1.01 (0.98–1.03) 0.61 1.17 (1.12–1.21) 0.99 (0.96–1.03) 0.98 (0.95–1.02) Q3 1.05 1.06 (1.04–1.08) 0.98 (0.96–0.999) 0.97 (0.95–0.99) 1.34 0.96 (0.94–0.98) 0.996 (0.98–1.02) 0.99 (0.97–1.01) 0.72 1.38 (1.33–1.43) 0.999 (0.96–1.04) 0.98 (0.95–1.02) Q4 1.11 1.12 (1.10–1.14) 0.97 (0.95–0.99) 0.95 (0.94–0.97) 1.34 0.96 (0.94–0.98) 1.01 (0.99–1.03) 0.99 (0.97–1.01) 0.84 1.61 (1.55–1.66) 0.98 (0.95–1.02) 0.96 (0.92–0.99) P for trend <.0001 .0082 <.0001 .0002 .6805 .3922 <.0001 .632 .1046Model 1: Not adjusted, Model 2: Adjusted for age (and sex in total group), Model 3: Adjusted for age, sex (in male or female group), smoking status, drinking status, regular exercise, body mass index (BMI), statin use, diabetes and hypertension.
CI = confidence interval, HDL-C = high-density lipoprotein cholesterol, HR = hazard ratio, IR = incidence rate, LDL-C = low-density lipoprotein cholesterol, Q quartile = (Q1 the lowest quartile, Q4 the highest quartile), TC = total cholesterol.
*Number of cases per 1000 person-years.
In the entire study population, higher HDL-C levels were significantly associated with a lower risk of gastric cancer in the unadjusted model (model 1), and this association was unchanged after adjusting for variables including age, sex (model 2), and other relevant clinical factors such as smoking status, drinking status, regular exercise, BMI, statin use, underlying diabetes mellitus and hypertension (model 3; HR for Q4: 0.98 [0.96–0.99], P for trend < .0001). When analyzed according to sex, the risk of gastric cancer was consistently lower in higher quartiles (Q2-Q4) of HDL-C in both sexes, in both unadjusted and adjusted analyses (model 3; HR for Q4: 0.98 [0.96–1.004], P for trend = .0004 in men; HR for Q4: 0.91 [0.88–0.94], P for trend < .0001 in women). In men, the risk of gastric cancer was lowest in the second highest quartile (Q3), while in women, the risk was lowest in the highest quartile (Q4), with a dose-dependent relationship.
Meanwhile, higher LDL-C and TC levels were associated with higher risks of gastric cancer in the unadjusted model (model 1) in the total population. When adjusted for age and sex (model 2), as well as health behaviors and comorbidities (model 3), higher LDL-C and TC levels were associated with lower risks of gastric cancer (HR for Q4: 0.92 [0.91–0.94], P for trend < .0001 for LDL-C; HR for Q4: 0.95 [0.94–0.97], P for trend < .0001 for TC). When analyzed separately in men and women, the relationship between LDL-C/TC levels and the risk of gastric cancer and differed according to sex. In men, the risk of gastric cancer was lower in the higher quartiles of LDL-C in both unadjusted and adjusted models (model 3; HR for Q4: 0.93 [0.91–0.95], P for trend < .0001). The risk of gastric cancer was also lower in the higher quartiles of TC in the unadjusted model, but there were no significant correlations between TC and incident gastric cancer in the adjusted models (model 3; P for trend = .3922). In women, the risk of gastric cancer was significantly elevated in higher quartiles of LDL-C and TC in the unadjusted model. When adjusted, there were no significant correlations between LDL-C/TC and gastric cancer risk in women (model 3; P for trend = .4073 for LDL-C and .1046 for TC).
3.3. Sensitivity analysisA sensitivity analysis was done by excluding patients diagnosed with gastric cancer within 3 years from the index date (Table 3). With this 3-year lag, 63,920 cases of gastric cancer were diagnosed (44,971 in men and 18,949 in women).
Table 3 - Risk of gastric cancer according to quartiles of high-density lipoprotein cholesterol, low-density lipoprotein cholesterol and total cholesterol when gastric cancer cases diagnosed within 3 years after index date have been excluded. Total (n = 9560,812) Male (N = 5213,357) Female (N = 4347,455) IR* Model 1 HR (95% CI) Model 2 HR (95% CI) Model 3 HR (95% CI) IR* Model 1 HR (95% CI) Model 2 HR (95% CI) Model 3 HR (95% CI) IR* Model 1 HR (95% CI) Model 2 HR (95% CI) Model 3 HR (95% CI) HDL-C Q1 1.23 1 (ref.) 1 (ref.) 1 (ref.) 1.50 1 (ref.) 1 (ref.) 1 (ref.) 0.90 1 (ref.) 1 (ref.) 1 (ref.) Q2 1.06 0.87 (0.85–0.88) 0.97 (0.95–0.99) 0.98 (0.95–0.996) 1.35 0.90 (0.88–0.92) 0.97 (0.94, 0.99) 0.98 (0.95–1.002) 0.72 0.81 (0.78–0.84) 0.95 (0.91–0.98) 0.95 (0.92–0.99) Q3 0.98 0.80 (0.78–0.82) 0.96 (0.94–0.98) 0.97 (0.95–0.99) 1.30 0.87 (0.85–0.89) 0.96 (0.94–0.99) 0.97 (0.95–0.997) 0.63 0.70 (0.67–0.73) 0.92 (0.88–0.95) 0.93 (0.90–0.97) Q4 1.00 0.81 (0.79–0.83) 0.97 (0.95–0.99) 0.98 (0.96–1.002) 1.39 0.93 (0.91–0.96) 0.98 (0.96–1.01) 0.99 (0.97–1.02) 0.53 0.60 (0.57–0.62) 0.87 (0.84–0.91) 0.89 (0.86–0.93) P for trend <.0001 .0006 .0169 <.0001 .0113 .0879 <.0001 <.0001 <.0001 LDL-C Q1 1.05 1 (ref.) 1 (ref.) 1 (ref.) 1.46 1 (ref.) 1 (ref.) 1 (ref.) 0.56 1 (ref.) 1 (ref.) 1 (ref.) Q2 1.00 0.96 (0.94–0.98) 0.94 (0.92–0.96) 0.95 (0.93–0.97) 1.33 0.91 (0.88–0.93) 0.93 (0.90–0.95) 0.94 (0.92–0.97) 0.62 1.11 (1.06–1.16) 0.995 (0.95–1.04) 0.99 (0.94–1.03) Q3 1.07 1.03 (1.003–1.05) 0.93 (0.91–0.96) 0.94 (0.92–0.96) 1.36 0.93 (0.90–0.95) 0.92 (0.90–0.95) 0.94 (0.92–0.97) 0.73 1.31 (1.25–1.37) 1.01 (0.97–1.05) 0.99 (0.95–1.03) Q4 1.16 1.10 (1.08–1.13) 0.92 (0.90–0.94) 0.93 (0.91–0.95) 1.41 0.96 (0.94–0.99) 0.92 (0.90–0.94) 0.94 (0.91–0.96) 0.86 1.54 (1.48–1.61) 0.995 (0.96–1.04) 0.97 (0.93–1.01) P for trend <.0001 <.0001 <.0001 <.0001 <.0001 <.0001 <.0001 .9093 .5656 TC Q1 1.00 1 (ref.) 1 (ref.) 1 (ref.) 1.39 1 (ref.) 1 (ref.) 1 (ref.) 0.54 1 (ref.) 1 (ref.) 1 (ref.) Q2 1.04 1.04 (1.02–1.07) 1.01 (0.99–1.03) 0.998 (0.98–1.02) 1.38 0.99 (0.97–1.02) 1.03 (0.999–1.05) 1.02 (0.995–1.05) 0.63 1.16 (1.11–1.21) 0.99 (0.95–1.03) 0.98 (0.93–1.02) Q3 1.07 1.07 (1.05–1.10)
Comments (0)