
Remember me
Shuangshi Tonglin Capsule (SSTL) contains a variety of herbal ingredients as shown in (Table 1), SSTL is manufactured by Shaanxi Momentum Pharmaceutical Co., Ltd. (Shaanxi, China). The China National Drug Administration (CNDA) number is Z20080028. Finasteride Tablets are manufactured by MSD Pharma (Singapore) Pte. Ltd. Preparation of SSTL suspension: Weigh the SSTL powder with 0.5% CMC-Na and keep grinding, It was prepared as a suspension with concentrations of SSTL low dose (0.0625 g/mL), SSTL medium dose (0.125 g/mL) and SSTL high dose (0.25 g/mL). Configuration of finasteride tablet suspensions: The finasteride tablet coating was scraped off with a knife, crushed in a mortar and weighed accurately, and 0.5% CMC-Na was added to form a suspension with a concentration of 0.052 mg/mL.
Preparation of mold-making agents: Testosterone propionate (TP) (MedChamExpress Cat.#HY-B1269/CS-4905) was dissolved in corn oil (Solarbio China No. C7030) and configured as 5 mg/ml TP solution.
Animals and treatment66 male SD rats were randomly divided into sham-operated group, model group, SSTL low dose, SSTL medium dose, SSTL high dose group, and positive drug group. SD rats were obtained from Chengdu Dashuo Experimental Animal Co., Ltd (Sichuan, China; Certificate of Conformity: SCXK (Chuan) 2020–030). Experiments were performed in accordance with the guidelines of the Animal Ethics Committee of Shaanxi University of Traditional Chinese Medicine (license number SUCMDL20220401002). Animal grouping and treatment:
a.Sham group: Subcutaneous injection of equal amount of corn oil solution.
b.Model group: Subcutaneous injection of TP (No.hy-b1269 Shanghai Haoyuan Biomedical Technology Co.) corn oil solution (5 mg/kg, 1 ml/1 kg).
c.SSTL Low dose group (SSTL-L): SSTL suspension (0.625 g/kg, 1 ml/kg).
d.SSTL Medium dose group (SSTL-M): SSTL suspension (1.25 g/kg, 1 ml/kg).
e.SSTL High dose group (SSTL-H): SSTL suspension (2.5 g/kg, 1 ml/kg).
f.Positive drug group (Fina): Finasteride (Fina) tablet suspensions (0.52 mg/kg, 1 ml/kg).
Subcutaneous injection and gavage were administered once a day for 28 days, the rats were weighed every 3 days to regulate the dosage of the drug. SD rats were euthanized after 28 days, and test samples were taken for subsequent testing.

Animal experiment flowchart
Detection of Organ index, body weight of rats and prostatic morphologyThe rats in each group were weighed before anesthesia and the organ indices were calculated for each group according to the following formula:
$$}\left( \right)\, = \,}\left( \right)/}(g)$$
$$}\left( \right)\, = \,}\left( \right)/}(g)$$
$$}\left( \right)\, = \,}\left( \right)/}(g)$$
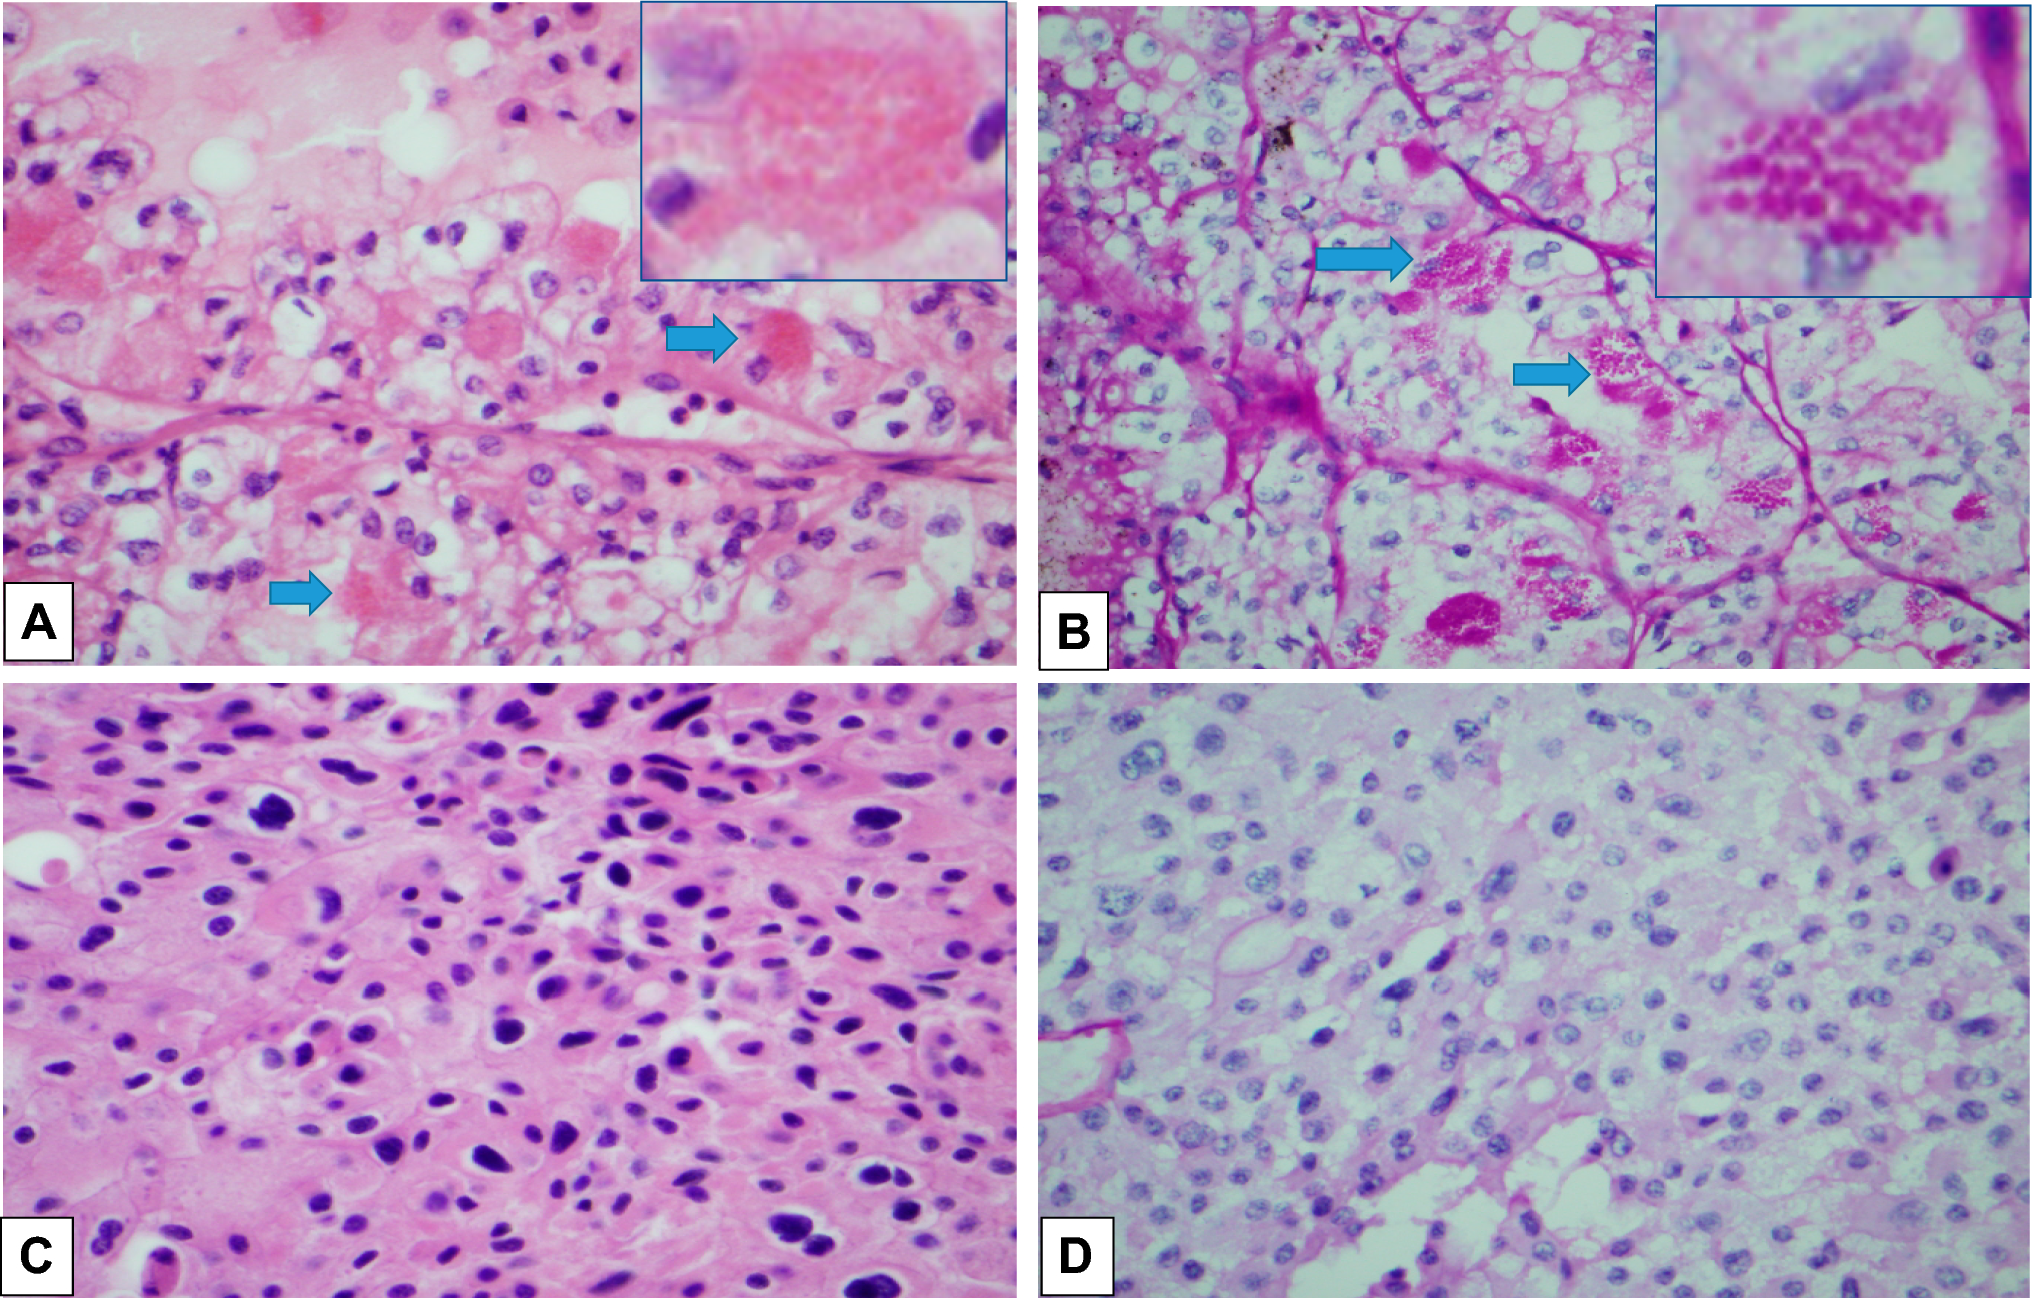
Masson’s trichrome stainingThe 5 μm sections of` prostatic tissues were deparaffinized in xylene (three washes for 3 min each) and then hydrated in graded ethanol to distilled water. Slides were stained with a Masson’s trichrome-staining kit from ZSGB-BIO (Beijing, China), following the manufacturer’s protocol.
Hematoxylin and eosin (H&E) stainingAfter collection, rat prostates were dewaxed in water, embedded, and cut into 5 µm sections and stained with H&E. Histopathological changes in the prostate were evaluated by microscopy.
Analysis of T, DHT, TNF-α and IL-1β levels in serum and tissueThe ELISA method was used to determine the level of the Testosterone (T), Dihydrotestosterone (DHT), Tumor Necrosis Factor alpha (TNF-α) and IL-1β in serum and prostate tissue according to the manufacturer’s instructions (Shanghai Enzyme Biotechnology Co., Ltd. Shanghai, China, #ml002998, #ml002868).
Detection of antioxidant enzyme activity and lipid peroxidation productsPrepare prostate tissue supernatant, determine the concentration, and place on ice with serum for use. The effects of antioxidant enzyme activities and lipid peroxidation products in prostate tissue and serum were examined according to superoxide dismutase (SOD), Catalase (CAT), glutathione peroxidase (GSH-PX), and Malondialdehyde (MDA) instructions.
ROS staining of prostate tissue was observed by frozen sectionThe prostate tissue was embedded in OCT, snap frozen in liquid nitrogen to 80 °C, and the frozen tissue was then cut into sections of 5 μm thickness, added with autofluorescence quencher, dripped with ROS stain, washed sections, dripped with DAPI stain, washed sections and finally sealed. Photographs were taken using a fluorescence microscope (× 400), and the fluorescence intensity was analyzed using Image J image analysis software.
Immunohistochemistry analysisImmunohistochemistry (IHC) analysis was used to detect the expression of NLRP3 prostate tissue. The prostate tissue sections were dewaxed in water and the sections were washed with PBS (pH = 7.4). After washing, the tissue sections were treated with 3% H2O2 solution for 25 min at room temperature. After blocking, the sections were incubated overnight at 4 °C. Then, AEC color solution and hematoxylin were used for redyeing. Five randomly distributed fields within the prostate lobe on each slide were analyzed and cells with red granules were considered positive. Each slide was selected for counting NLRP3 positive cells.
Western blot analysisTotal proteins were extracted from prostate tissues with RIPA buffer. Equal amounts of protein samples were loaded onto 10% SDS-PAGE gels and then transferred onto PVDF membranes. The PVDF membranes were blocked with 5% non-fat milk for 2 h at room temperature and then incubated with anti-IKKβ (1:1000, No. #8943), anti-P38(1:1000, No. #8690), anti-phospho-P38(1:1000, No. #4511), anti-ERK1/2(1:1000, No. #4695), anti-phospho-ERK1/2 (1:1000, No. #4370), anti-JNK/SAPK (1:1000, No. #9252), anti-phospho-JNK/SAPK (1:1000, No. #4668), anti-AMPK(1:1000, No. bs-10344R),anti-phospho-AMPK(1:1000, No. 2537S), anti-SIRT-1 (1:1000, No. ab110304), and anti-GAPDH (1:1000, No. GB11002) overnight at 4℃. The next day, the PVDF membranes were incubated with a secondary antibody for 2 h at room temperature. The protein signals were visualized with an enhanced chemiluminescence system and detected by ImageJ software. All protein signals were standardized by using GAPDH.
Statistical analysisAll the data were analyzed with SPSS 26.0, and the results are expressed as the mean ± standard error of the mean (mean ± SD). Multiple comparisons were performed using one-way analysis of variance (ANOVA), and P < 0.05 or P < 0.01 were considered statistically significant. Statistical analyses were performed using GraphPad Prism 8.0 software (GraphPad Software, Inc., CA, USA).
Comments (0)