
Remember me


Time spent in incarceration is associated with worsening of individuals’ mental health.1 The stressful environment of prisons and jails, individuals’ lack of autonomy and removal from social networks, unpredictable living conditions, and lack of mental health treatment can lead to mental health crises behind bars.1,2 Postrelease, individuals are often not linked with mental health treatment and struggle with meeting basic needs (e.g., housing), contributing to worse mental health.3,4 In recent years, given the many harms of incarceration, probation—a form of community supervision that allows individuals to serve their sentence in the community in lieu of incarceration—has been lauded as an alternative. Yet probation is a punitive sentence that widens the net of state-sanctioned control by imposing movement restrictions, regular meetings, fees, home visits, and drug tests.5 These conditions are often difficult to meet, and violating them frequently results in longer probation sentences or reincarceration.6 In 2022, there were more individuals on probation (2.9 million) than were incarcerated (1.9 million) in the United States.6
Despite the prevalent use of probation in criminal–legal sentencing, the effect of probation as opposed to incarceration on many health outcomes, including mental health, is unclear.7 Although decreasing the prevalence of incarceration by allowing individuals to serve their sentences in their community has the potential to produce mental health benefits, it is possible that probation’s punitive nature may prevent these benefits from accruing. Recent work has assessed the effects of other criminal–legal involvement types (i.e., arrests, convictions without incarceration, incarceration) on mental health, finding that arrests and convictions without incarceration were deleterious to mental health.8 In other words, the type of criminal–legal encounter was found to be less important for mental health than having an encounter. This is likely because any criminal–legal encounter is a stressful experience, affects other aspects of life (e.g., employment prospects), and contributes to worse mental health over the life course.3 Additionally, individuals with any criminal–legal history face discrimination and stigma,9 which can lead to social exclusion and difficulty in meeting fundamental needs, worsening mental health. Last, those encountering the criminal–legal system are younger than the general population, and having these stressful and stigmatizing encounters whereas developing into an adult may affect mental health more than having encounters later in life.10 Because probation is a commonly used, punitive criminal–legal sentence and because other sentences (e.g., incarceration) are known to worsen mental health, it is critical to assess if probation is also deleterious to mental health. Furthermore, probation is unevenly distributed throughout the US population—similar to incarceration’s distribution—with Black individuals being 3.5 times as likely to experience community supervision (e.g., probation and parole) as White individuals.11 This is due to the criminal–legal system’s roots in structural racism and disproportionate impact on Black individuals and communities.12,13
We estimated the effects of probation on mental health and examined whether these effects differed by race, given probation’s disproportionate impact on Black versus White individuals. Specifically, we examined how hypothetical interventions (1) to replace incarceration with probation and (2) to replace probation with a conviction without an imposed punishment in the form of prison or probation at an individual’s first adult criminal–legal encounter would be expected to affect mental health and differences in mental health by race at age 30. We chose age 30 as individuals’ first criminal–legal encounters typically occur early in adulthood and these encounters are hypothesized to have medium- to long-term health effects.4 We chose hypothetical interventions that reduce the severity of individuals’ first adult encounter (e.g., probation to charge alone) rather than eliminate that encounter (e.g., probation to no arrest). Although these hypothetical interventions are the most realistic in our policy environment, they differ from prior literature, which has compared the mental health effects of criminal–legal encounter level versus no encounter.8 Further, we focus on adult encounters as juvenile and adult systems are separate and sentencing severity policies historically vary more between states in juvenile systems.14
METHODS DataThis analysis used the US National Longitudinal Survey on Youth 1997 (NLSY97), a longitudinal, nationally representative data set of 8894 adolescents (baseline age: 12–17 years) followed into their mid-thirties (1997–2017).15 Interviews were conducted annually from 1997 to 2011 and biennially thereafter. The NLSY97 cohort oversampled Hispanic and Black non-Hispanic respondents. As mass incarceration is a mechanism through which structural racism affects health and criminal–legal encounters are patterned by place, we merged county-level covariates and structural racism measures from multiple sources based on individuals’ county of residence the year of their first adult criminal–legal encounter.13
We excluded individuals from analyses if they missed more than one interview before the first observed adult criminal–legal encounter,16 missed an interview before age 18, had missing time-invariant variables or were always missing time-varying variables, did not have an interview at age 18, or did not answer criminal–legal questions at age 18. We did not exclude individuals due to being incarcerated. Because we were interested in examining the impact of sentencing changes at the first adult criminal–legal encounter, we restricted analyses to individuals with a criminal–legal encounter at 18 years old or older. Of the remaining participants, we excluded from multivariable analyses those classified as another non-Hispanic race–ethnicity (described below), resulting in an analytic sample of 1835 (eFigure 1; https://links.lww.com/EDE/C75).
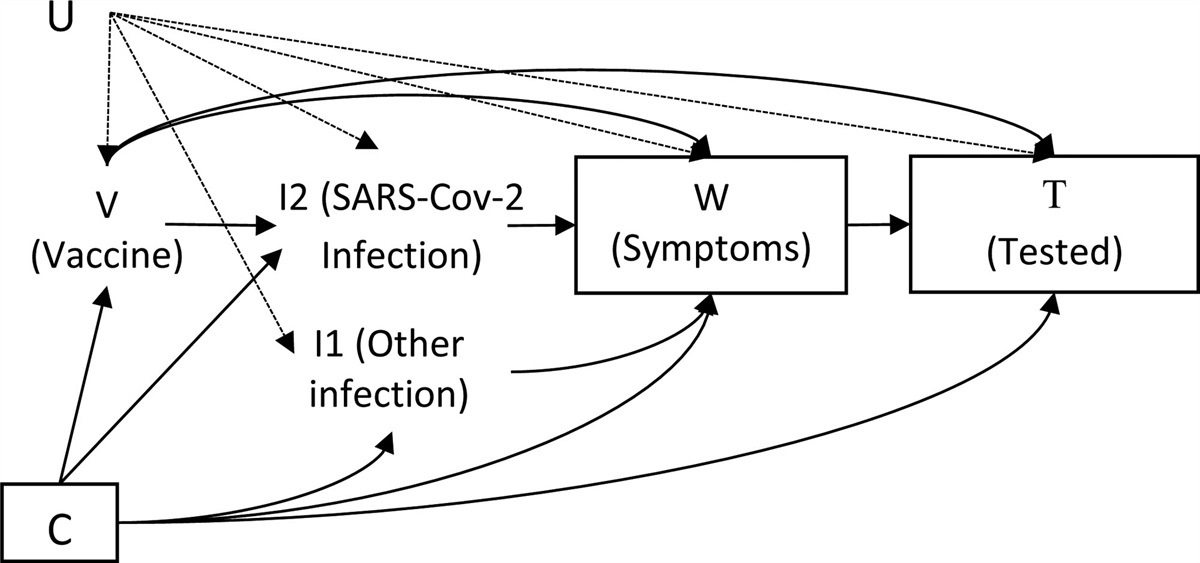
Measures ExposureAt each follow-up interview, participants were asked about arrests because the last interview, excluding minor traffic violations. For each arrest, they were asked if they were charged. If so, they were asked if they went to court. If so, they were asked if they were convicted or pled guilty. If so, they were asked if they had been sentenced to incarceration. Only if they had been sentenced but not to incarceration were they asked if they were sentenced to probation. We categorized individuals’ first adult criminal–legal encounter in increasing severity as: (1) arrest without conviction, (2) charge or conviction without sentencing, (3) conviction and probation without incarceration, and (4) conviction and incarceration in jail or prison. If more than one encounter was reported per interview (e.g., arrest for one encounter and incarceration for another), we captured the most severe encounter (e.g., incarceration) (Figure 1).
 FIGURE 1.:
 Flow of criminal–legal questions.
OutcomeBiannually from 2000 to 2010 and in 2015 and 2017, the interview included the five-item Mental Health Inventory (MHI).17 The MHI-5 is a subscale of the Short Form 36 Health Survey Questionnaire that has shown high validity and reliability for identifying probable mood disorders using the Diagnostic Statistical Manual of Mental Disorders-IV.18 The MHI-5 asks how much of the time in the past month have you: (1) been a very nervous person, (2) felt calm and peaceful; (3) felt downhearted and blue; (4) been a happy person; and (5) felt so down in the dumps that nothing could cheer you up. Responses are scaled to 0–100 with higher scores indicating worse mental health. We analyzed the MHI-5 dichotomously (validated with ≥40 indicating probable moderate-to-severe depressive symptoms) and continuously (an indicator of mental health symptom severity).18,19 We conducted sensitivity analyses using a more conservative cutoff (≥46) and varying the sensitivity of the MHI-5. We used the score closest to age 30 ± 3 years. If no score was available, we considered it missing.
Effect Measure ModifierSelf-identified race was recorded as: (1) American Indian, Eskimo, or Aleut, (2) Asian or Pacific Islander, (3) Black or African American, (4) Other, or (5) White; Hispanic ethnicity was captured separately (yes/no). In our analysis, we categorized race–ethnicity as Hispanic (regardless of race), Black non-Hispanic, White non-Hispanic, and another non-Hispanic race–ethnicity. Although descriptive statistics include all groups, multivariable analyses exclude those categorized as another non-Hispanic race–ethnicity (N = 51) due to the small sample size. Further, stratified analyses compare Black non-Hispanic with White non-Hispanic respondents (hereafter referred to as Black and White, respectively), thus excluding 370 individuals categorized as Hispanic. We focus on Black individuals given the US criminal–legal system’s roots in slavery and its disproportionate impact on individuals descended from those enslaved.13 We use White as the referent group, as this group receives the least harsh treatment in the criminal–legal system.6 We use race–ethnicity categories as indicators of sociopolitical realities and histories, not of biologic difference.20
ConfoundersWe identified confounders by drawing a Directed Acyclic Graph (eFigure 2; https://links.lww.com/EDE/C75) informed by the following frameworks: (1) the socio-ecologic framework, which recognizes that multilevel factors perpetuate health inequities, and is used to understand mass incarceration’s relationship to health,21 and (2) the fundamental cause framework, which recognizes mass incarceration as a mechanism through which structural racism affects health.13,22 We hypothesized that individual-level (i.e., sex, parental education, juvenile criminal–legal encounters, youth mental health, employment, education, marital status, having children, self-rated health, drug use, severe stressors, and assault conviction) and county-level (i.e., region, rurality, incarceration rate, violent crime rate, poverty rate, percent Black, unemployment rate, and mental healthcare access) variables were on confounding pathways for the association between criminal–legal encounter level and mental health.23–27 To establish temporality, we took confounder values from the interview before the individuals’ first encounter. Youth mental health was only measured in a subset of participants; a sensitivity analysis with this subset is included.
Statistical AnalysisWe used parametric g-computation to estimate the effects of hypothetical criminal–legal interventions on mental health.28 Specifically, we examined the impact on mental health at age 30: (1) if everyone who received incarceration had instead received probation and (2) if everyone who received probation after conviction instead had received no punishment, in each case compared with the observed distribution of criminal–legal encounters. We quantified the effect as the difference in risk of probable moderate-to-severe depressive symptoms (i.e., MHI-5 binary) and the change in overall mental health symptom severity (i.e., MHI-5 score). We estimated these effects in two target populations (1) everyone with adult criminal–legal encounters and (2) only those whose criminal–legal encounters would have changed under the intervention. We estimated effects separately for Black and White individuals.
Parametric g-computation imputes everyone’s outcome under each intervention. We (1) fit an outcome model as a function of exposure and confounders, (2) predicted the outcome for each individual after manipulating the exposure as outlined in the intervention (e.g., Intervention 1, setting the exposure to probation for incarcerated individuals), (3) took the population mean of predicted outcomes as point estimates under each intervention, and (4) repeated these steps in 500 bootstrap resamples, estimating the standard error as the standard deviation across samples.29 Imputed outcomes represent counterfactual estimates of the risk of probable moderate-severe depression or mental health symptom severity if criminal–legal sentences could be manipulated through intervention.
In all analyses, we weighted the average of predicted outcomes (step 3) with sampling weights to account for the oversampling of Hispanic and Black individuals. We used the last observation carried forward for missing information in time-varying variables. To do this, we assumed time-varying variables did not substantively change when missing. In addition to 16 (1%) participants who missed a visit before their first criminal–legal encounter for which data were carried forward, 87 (4%) had at least one confounder variable carried forward due to missingness. Missing mental health data (N = 354) was imputed in step 2 of parametric g-computation. This study was approved by the Institutional Review Board at the University of North Carolina at Chapel Hill.
RESULTSTo contextualize the sample, Table 1 shows participant characteristics before the sample was restricted by race–ethnicity (N = 1886). Among the 1886 individuals experiencing at least one adult criminal–legal encounter, 12% were Hispanic, 19% were Black, 65% were White, and 4% were another race–ethnicity (Table 1; percentages are weighted for sampling design). The median age was 20 and 70% were male with a higher proportion of Black than White individuals being male (75% vs. 68%). One-third of individuals also experienced criminal–legal encounters before age 18. Half experienced a charge without punishment at their first contact. One-fifth experienced an arrest alone, 16% experienced incarceration, and 13% received probation. The proportion of participants with a first encounter ending in arrest alone varied by race with 25% of Black individuals’ first encounters ending in arrest whereas only 18% of White individuals’ encounters did. A larger proportion of Black individuals also experienced incarceration at their first encounter than did White (21% vs. 14%), whereas Black individuals were less likely to get probation than White individuals (9% vs. 15%). We also stratified demographic characteristics by first adult criminal–legal sentence type (eTable 1; https://links.lww.com/EDE/C75). Although 75% of those on probation were White and 13% were Black, 56% of those incarcerated were White and 24% were Black. Additionally, whereas 22% of those on probation had a juvenile encounter, 52% of those incarcerated had.
TABLE 1. - Demographic Variables NLSY97a,b,c,d,e,f Full Sample (N = 1886) Black (N = 586) White (N = 879) Median/n IQRw/% Median/n IQRw/% Median/n IQRw/% First CL encounter, n (%) Arrest alone 413 21 152 25 157 18 Charge alone 914 50 267 45 463 53 Probation sentence 223 13 50 9 132 15 Incarceration sentence 336 16 117 21 127 14 Race/ethnicity, n (%) Hispanic 370 12 Black 586 19 White 879 65 Another race/ethnicity 51 4 Age at first CL encounter, median (IQRw) 20 4 21.22 4 20.95 5 Sex at Birth, n (%) Female 545 30 153 25 277 32 Male 1341 70 433 75 602 68 Parental education, n (%) Less than high school 566 25 178 29 166 19 High school, GED, or higher 1320 75 408 71 713 81 Juvenile CL sanctions, n (%) No 1291 68 417 70 591 68 Yes 595 32 169 30 288 32 Youth mental health concern, n (%)e No 603 52 189 56 280 51 Yes 541 48 154 44 270 49 Missing 742 243 329 Education, n (%)d Less than high school 527 26 196 32 206 23 High school, GED, or higher 1359 74 390 68 673 77 Employment, n (%)d No weeks worked in past year 299 13 156 25 88 10 Any weeks worked in past year 1587 87 430 75 791 90 Married, n (%)d No 1742 92 564 96 800 91 Yes 144 8 22 4 79 9 Children, n (%)d No 1550 83 476 82 741 84 Yes 336 17 110 18 138 16 Self-rated health, n (%)d Poor 19 1 6 1 9 1 Fair 177 9 51 9 73 9 Good 570 31 164 28 282 32 Very Good 603 33 173 30 300 34 Excellent 517 26 192 32 215 24 Drug use, n (%)d No 1602 82 560 96 678 77 Yes 284 18 26 4 201 23 Stressful life event, n (%)e No 1675 89 516 88 786 90 Yes 211 11 70 12 93 10 Region, n (%)d Northeast 293 16 81 14 157 18 Central 451 28 115 20 292 33 South 777 37 351 57 287 33 West 365 19 39 8 143 16 Assault conviction, n (%)d No 1685 91 501 86 812 92 Yes 201 9 851 14 67 8 County percent Black, median (IQRw)d 8.88 15 23.52 18 4.11 12 County poverty rate, median (IQRw)d 12,754 6371 14,256 7320 10,885 6017 County unemployment rate, median (IQRw)d 6214 2933 7140 3563 5589 2626 county mental health shortage, n (%)d 19 19 18.92 18 20.38 18 County rurality (Y/N), n (%)d 948 53 219 38 505 57 County incarceration rate, median (IQRw)d 362 361 399 450 310 379 County violent crime rate, median (IQRw)d 459 439 618 500 303 374aPercentages and IQRw are based on weighted data to account for sampling design.
bRates are reported per 100,000 population.
cVariables descriptions: Drug use: participants were asked if, because the last interview, they had used any drugs like cocaine or crack or heroin to get high or to achieve an altered state, excluding marijuana and alcohol; stressful life events: participants were asked at specific waves if they had been a victim of a violent crime, had experienced homelessness, had a household member hospitalized, incarcerated, or unemployed, experienced parental divorce, or experienced the death of a close relative–participants were then asked how old they were when these events happened. Youth Mental Health: participants were asked how often they were unhappy, sad, or depressed. If they replied “somewhat/sometimes” or “often,” they are coded as having a mental health concern and if they replied “never,” they are coded as not having a concern.
dVariable values takes from the year before individuals’ first criminal–legal encounter.
eVariable asked at specific waves and participants asked at what age they experienced the stressful life event. This was then coded as occurring at that age and taken the year before the first criminal–legal encounter.
fVariable only asked to subset of participants at baseline.
Source: National Longitudinal Surveys, Bureau of Labor Statistics.
CL indicates criminal–legal; GED, general education development; IQRw, interquartile range width; NLSY97, National Longitudinal Survey on Youth 1997.
Remaining results include data on the subsample (N = 1835) of White, Black, and Hispanic participants. The median time between first criminal–legal encounter and mental health score being collected was nine years. This was similar by race. After imputing missing outcomes, 33% of individuals (95% confidence interval [CI] = 31%, 36%) had moderate-to-severe depressive symptoms at age 30 under observed sentencing (Table 2), and this proportion was 36% for White (95% CI = 33%, 40%) and 29% for Black individuals (95% CI = 25%, 33%). Average mental health symptom severity at age 30 was 30 (95% CI = 29, 31), and was lower for Black (28; 95% CI = 26, 30) than White individuals (32; 95% CI = 30, 33).
TABLE 2. - Hypothetical Intervention Effects using Parametric G-Computation for Changing First Adult Criminal–Legal Sanction Level on Risk of Poor Mental Health by Age 30, Among Those Experiencing any Adult Criminal–Legal Sanction and Among Those Intervened on Under Each Intervention (N = 1835), NLSY97a,b,c,d
Comments (0)