
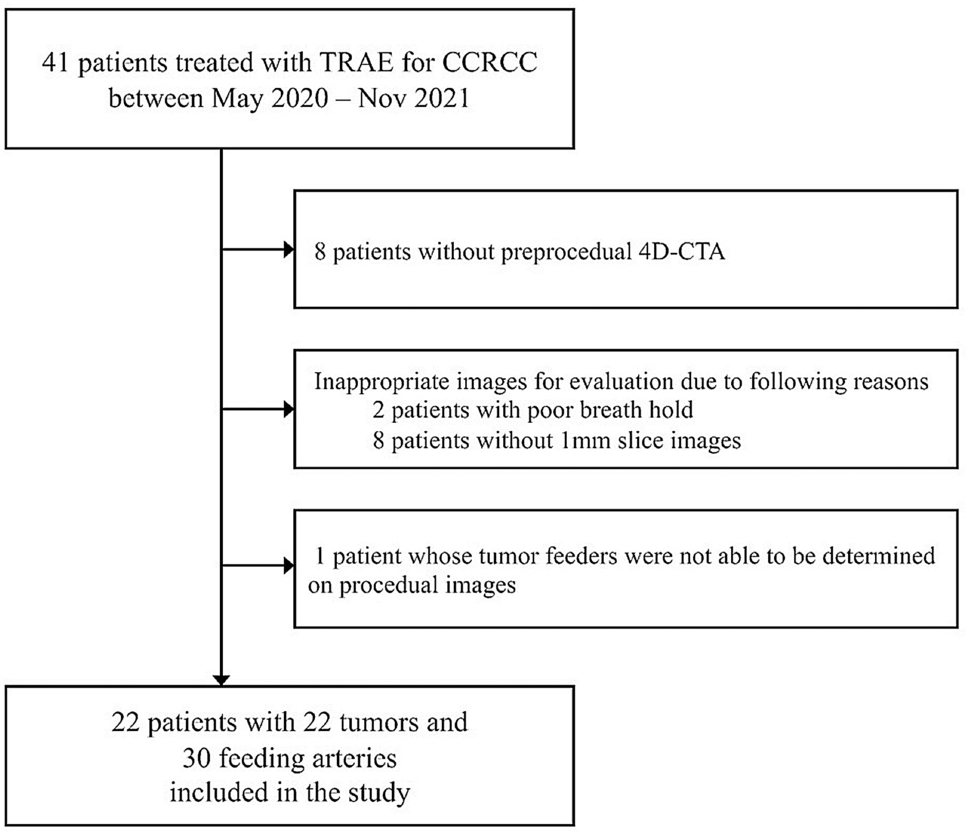
Remember me


Since most drugs are metabolized in the liver, liver injury is an inevitable consequence of drug exposure. The temporal relationship between the drug administration and the appearance and resolution of liver injury, as well as the exclusion of other causes, is crucial in the diagnosis of drug-induced liver injury (DILI). Most DILI occurs within 60 days of taking drugs, but onset after 90 days is also observed. Allergic cases may develop within 24 h [1]. The first-choice imaging modality for a patient with suspected DILI is abdominal ultrasonography. The choice of additional abdominal imaging is significantly influenced by the patient’s symptomatology. If abdominal pain is a prominent symptom, additional imaging tests, such as computed tomography (CT) and magnetic resonance imaging (MRI), may be necessary despite a normal abdominal ultrasound to exclude gallstone disease and other competing etiologies, including tumors [1]. CT and MRI are valuable tools to accurately and reproducibly diagnose hepatobiliary and pancreatic abnormalities. The choice between the recommended imaging protocols depends on the patient’s age and diseases and cannot be prescribed in general. For example, to rule out cholangitis and tumors, non-contrast and contrast-enhanced CT are recommended, and dynamic CT may be acceptable for the initial examination. If cholangiopathy is suspected, magnetic resonance cholangiopancreatography (MRCP) should be added to the routine MRI sequence. Alternatively, for assessing fatty or iron deposits in the liver, non-contrast CT or MRI may suffice. Pharmacotherapy is still evolving, and new agents are being introduced into routine practice, including molecular-targeted drugs and immune checkpoint inhibitors (ICIs). Drugs are essential for treating various diseases, but physicians can encounter various drug-related abnormalities. In particular, drug-associated disorders can occur in the pancreaticobiliary system, albeit less frequently than in the liver. Imaging findings of drug-associated hepatobiliary and pancreatic disorders are often normal, making diagnoses challenging in rare cases. However, certain disorders exhibit characteristic imaging findings or patient histories. Therefore, familiarity with the characteristic findings in these cases can enhance diagnostic precision and patient care. This article aimed to describe the CT and the MRI findings of drug-associated hepatobiliary and pancreatic disorders and identify tips for determining a correct diagnosis.
LiverDrug-induced acute hepatitisAlthough rare, it is essential to identify significant causes of liver disease. Various pharmaceuticals, natural remedies, and dietary supplements can induce liver injury. Liver diseases can range from modest elevations in serum liver enzyme levels to fatal outcomes. Using the earliest detected increase in liver enzyme levels, three DILI patterns are identified: hepatocellular pattern: if alanine aminotransferase (ALT) is elevated five-fold above the upper limit of normal (ULN) or ALT/alkaline phosphatase (ALP) ratio (R) ≥ 5; cholestatic pattern: ALP is elevated two-fold above ULN or R ≤ 2; and mixed pattern: R > 2 to < 5 [1].
Acetaminophen (paracetamol) consumption is the most prevalent cause of drug-induced hepatitis [2]. An elevated international normalized ratio of prothrombin time is a more reliable indicator of liver dysfunction than aspartate aminotransferase and ALT levels [3]. Since there are no specific imaging findings for drug-induced acute hepatitis, it is essential to exclude more common causes when diagnosing this condition, including viral infections, alcohol abuse, and autoimmune conditions. When treating patients with liver injury, the primary approach involves immediate discontinuation of the offending drug [3]. An example of this is the case of a patient presenting with hepatosplenomegaly. Reduced echogenicity and CT attenuation are observed in the liver parenchyma. The liver parenchyma exhibits heterogeneous enhancement during arterial phase imaging (Fig. 1). The observed periportal edema displays hypoattenuation on CT and hyper-intensity on T2-weighted images. Furthermore, gallbladder wall thickening is present, specifically subserosal edema, without distention. Ascites and lymph node enlargement are detected in the hilar region [4]. These findings are observed in the hepatocellular pattern DILI. Cholestatic pattern DILI may cause sclerosing cholangitis-like changes [1], and MRCP provides a comprehensive image of the biliary tree. In chronic cases, varying degrees of intrahepatic bile duct loss may occur, known as vanishing bile duct syndrome [5]. The mixed type can present with imaging findings similar to those observed in the hepatocellular and cholestatic pattern, depending on severity and course of the disease.
Fig. 1
Drug-induced acute hepatitis in an 81-year-old man with appetite loss and hepatobiliary enzyme elevation, who was taking tizanidine for 1 month. Dynamic computed tomography (CT) (a pre-contrast, b arterial phase, and c portal venous phases) demonstrates periportal edema (arrows). b The liver parenchyma is heterogeneously enhanced in the arterial phase (arrowheads). d The gallbladder wall is thickened in the portal venous phase (open arrow). However, the gallbladder is not enlarged or distended, differentiating it from acute cholecystitis. The hepatobiliary enzyme levels normalized after tizanidine withdrawal. On imaging, acute hepatitis from other causes is differential; however, both are nonspecific and difficult to distinguish on imaging alone
Sinusoidal obstruction syndrome (SOS)SOS was previously known as veno-occlusive disease and is often called “blue liver.” The primary etiology of this condition is damage to the hepatic sinusoidal endothelium due to toxic exposure [6]. Oxaliplatin is regarded as the most significant SOS contributor and is primarily associated with its development. Other chemotherapeutic agents can also induce SOS, including S-1 and cisplatin [7]. Symptoms of SOS are typically nonspecific, which makes diagnosis difficult. Several risk factors increase the likelihood of developing SOS, including preoperative gamma-glutamyl transferase elevation, advanced age, female sex, increased indocyanine green retention, the number of chemotherapy cycles, and a brief interval between the end of chemotherapy and digestive surgery [6]. SOS increases the risk of perioperative as well as postoperative bleeding and hepatic failure. The primary treatment strategy for halting SOS is the immediate cessation of chemotherapy [6]. SOS imaging findings are liver enhancement with a mosaic appearance, typically observed in the peripheral parenchyma of the right lobe during the arterial phase (Fig. 2). Gadoxetic acid-enhanced MRI is a sensitive and highly specific diagnostic tool with 75% sensitivity and 96–100% specificity [4, 8]. During the hepatobiliary phase, hypo-intense reticular hepatic parenchyma is observed (Fig. 3). This condition may manifest as a new focal lesion that mimics liver metastasis [4]. SOS is differentiated from metastases by considering the absence of restricted diffusion, peripheral gadoxetic acid uptake, and intra-lesional vessels (Fig. 4). Damage to sinusoidal endothelial cells in SOS is particularly severe in zone 3 around the central vein, where the expression of the organic anion transporting polypeptide 1B3 (OATP1B3), an uptake transporter of gadoxetic acid, is high. Since the OATP1B3 expression in this region is significantly reduced in SOS, the uptake of gadoxetic acid is impaired in SOS because the OATP1B3 expression in this region is significantly decreased [9]. This may be related to peripheral gadoxetic acid uptake of focal SOS. The ability of SOS to absorb 18F-fluorodeoxyglucose (FDG) is a potential pitfall, which may contribute to confusion or misinterpretation [10] (Fig. 5).The mechanism for FDG uptake of SOS remains unclear. Kim et al. speculated that in patients with SOS, microcirculatory disturbances caused by endothelial cell injury and blood stasis in peliosis may lead to hepatic congestion, resulting in passive increase in blood-pool FDG tracer activity in the liver [10]. A similar mechanism may contribute to the accumulation of FDG in SOS lesions.
Fig. 2
Sinusoidal obstruction syndrome in an asymptomatic 65-year-old man, who was undergoing chemotherapy (S-1 and oxaliplatin) for esophagogastric junction cancer. Dynamic computed tomography (CT) (a pre-contrast, b arterial phase, c portal venous phase, and d equilibrium phase) demonstrates diffuse reticular hypoattenuation in the liver, most obvious in the portal venous phase. These areas are unclear on pre-contrast and equilibrium phase images. Patchy heterogeneous enhancement is also observed in the arterial phase
Fig. 3
Sinusoidal obstruction syndrome (SOS) in an asymptomatic 65-year-old man, who was undergoing chemotherapy (S-1 and oxaliplatin) for esophagogastric junction cancer (same patient in Fig. 2). Gadoxetic acid-enhanced magnetic resonance imaging (MRI) (a pre-contrast, b arterial phase, c portal venous phase, d transitional phase, and e hepato-biliary phase) demonstrates diffuse hypo-intense reticulations in the liver, most obvious in the hepatobiliary phase (arrows). f. These areas show hypo-intensity on T2*-weighted imaging, which indicates hemorrhage (open arrows). Patchy heterogeneous enhancement in the arterial phase, heterogeneous hyper-intensity on g. fat-saturated T2-weighted imaging (fat-sat. T2WI), and h. diffusion-weighted imaging (DWI, arrowheads) with b value 800 s/mm2 are also evident. Periportal hyper-intensity is also observed in fat-sat. T2WI and DWI (dotted arrows). MRI is superior to computed tomography in the detection of SOS
Fig. 4
Sinusoidal obstruction syndrome (SOS) in an asymptomatic 49-year-old man, who was undergoing chemotherapy, including oxaliplatin for colon cancer. Gadoxetic acid-enhanced magnetic resonance imaging (MRI) (a pre-contrast, b arterial phase, c portal venous phase, d transitional phase, and e hepatobiliary phase) demonstrates a hypo-vascular lesion at S4/8, which demonstrates hyper-intensity on f. T2-weighted imaging and g. diffusion-weighted imaging with b value 800 s/mm2. The apparent diffusion coefficient value of this lesion is not reduced (data not shown). Peripheral gadoxetic acid uptake is observed in the hepatobiliary phase (arrows) and intra-lesional vessels in the arterial phase as well as the portal venous phase (vessel-penetrating sign, arrowheads). These are key imaging findings that differentiate mass-forming SOS from liver metastases
Fig. 5
Sinusoidal obstruction syndrome (SOS) in an asymptomatic 52-year-old man, who was undergoing chemotherapy (S-1) for esophageal cancer. Fluorodeoxyglucose positron emission tomography (FDG-PET) (a maximum intensity projection of FDG-PET, b computed tomography (CT), c FDG-PET image, and d fused FDG-PET/CT image) demonstrates several focal tracer uptakes (maximum standardized uptake value, 4.0–5.0) in the liver (arrows). Multiple liver metastases were suspected; however, the hepatobiliary phase demonstrates reticular hypo-intensity in the liver (arrowheads), typical of SOS
Mass formationFocal nodular hyperplasia (FNH)-like lesionsFNH-like lesions are considered end-stage post-chemotherapy SOS [11]. Liver injury induces hyperplasia of periportal hepatocytes. Multiple lesions are typically observed. After completing chemotherapy, the average time between diagnosis and treatment is 48 months. The number of lesions detected by imaging may increase by up to 42 percent [4]. The lesions exhibit homogenous arterial phase hyperenhancement and iso-attenuation or iso-intensity during the portal venous as well as equilibrium phases. The lesions appear hyperintense during the hepatobiliary phase (Fig. 6) in their entirety or a doughnut-like pattern [4, 11, 12]. Although no coherent case series has been reported in adults, a study of 16 cases in pediatric cancer patients reported a median maximum diameter of 19.5 mm (range 8–41 mm) for FNH-like lesions that developed after chemotherapy [13].
Fig. 6
Focal nodular hyperplasia (FNH)-like lesions in an asymptomatic 63-year-old man, who was undergoing chemotherapy (CTX) for descending colon cancer, including oxaliplatin. a Pre-CTX hepatobiliary phase imaging reveals no focal liver lesions. b Small hyperintense lesions are observed in bilateral liver lobes during the hepatobiliary phase imaging performed six months post-initial CTX (arrows). Although they are newly arising nodules during follow-up, they can be differentiated from liver metastases by their high signal in the hepatobiliary phase imaging
Hepatocellular adenoma (HCA)HCA is a well-known drug-related hepatic mass frequently associated with women of reproductive age who take oral contraceptives containing exogenous estrogens. HCA can also occur in patients treated with anabolic steroids for athletic enhancement, Fanconi anemia, and aplastic anemia [14]. The annual incidence of HCA among oral contraceptive pill users ranges between 30 and 40 cases per million, compared to 1 to 1.3 cases per million among nonusers. This risk increases with continued use beyond 5 years [14]. HCAs are classified into four main subtypes: hepatocyte nuclear factor 1α inactivated HCA (H-HCA), inflammatory HCA (I-HCA), β-catenin activated HCA, and unclassified HCA. H-HCA and I-HCA are more common in women taking oral contraceptives [15]. A study of 78 HCA patients revealed that discontinuing oral contraceptives caused 37.2% of HCA to regress by 30% and 5.1% to regress completely [16]. Marked fat deposition, resulting from impaired fat metabolism, is the histologic hallmark of H-HCA. The most prominent imaging feature is the decreased signal in the opposed-phase compared to the in-phase chemical shift imaging (CSI). Dynamic studies revealed mild to moderate enhancement in the arterial phase and washout in the portal venous phase. H-HCA exhibits hypo-intensity on hepato-biliary phase imaging [17, 18] (Fig. 7).
Fig. 7
Hepatocellular adenoma in an asymptomatic 30-year-old woman, who was taking oral contraceptives. a Arterial phase of gadoxetic acid-enhanced magnetic resonance imaging (MRI) reveals a hyper-vascular lesion (9 mm in diameter) in segment 2 in the liver (arrow). b This lesion had shrunk (6 mm in diameter) in the arterial phase of gadoxetic acid-enhanced MRI after oral contraceptives were discontinued (arrowhead). Hepatocellular carcinoma is raised as a differential on imaging; however, it can be differentiated by age and the absence of chronic liver disease
Diffuse parenchymal changePseudocirrhosisAfter chemotherapy-induced hepatic toxicity, patients with liver metastases from breast cancer are most likely to experience diffuse morphological changes [19, 20]. However, it may also occur in patients with other types of cancer. Pseudocirrhosis can occur after hormonal therapy and anti-HER2 therapy [19]. Two hypotheses exist regarding the underlying mechanisms: (i) Chemotherapy causes a reduction in the liver metastases size. The liver then develops severe desmoplastic fibrosis, resulting in diffuse morphological alterations. (ii) Chemotherapy causes nodular regenerative hyperplasia of the liver [4]. Small regenerative nodules are dispersed throughout the liver and can cause diffuse morphological changes. Pseudocirrhosis imaging characteristics include liver surface nodularity, multifocal capsular retraction (Fig. 8), decreased liver size, caudate lobe enlargement, and signs of portal hypertension, including portal-systemic collateral pathways, splenomegaly, or ascites [4, 20]. Although the imaging findings resemble cirrhosis, the pathological characteristics of cirrhosis are not evident. Pseudocirrhosis is frequently associated with a poor prognosis in affected patients [19, 20].
Fig. 8
Pseudocirrhosis in an asymptomatic 39-year-old woman, who was undergoing chemotherapy (CTX, paclitaxel, and bevacizumab) for left-sided breast cancer. a Contrast-enhanced computed tomography (CT) reveals a smooth hepatic margin before CTX. b A nodular contour is observed in the lateral liver segment on contrast-enhanced CT performed 7 months after the initial CTX. It is difficult to differentiate pseudocirrhosis from liver cirrhosis on a single image alone
Chemotherapy-associated steatohepatitisChemotherapy-associated steatohepatitis ranges from simple hepatic steatosis to steatohepatitis and is mostly observed in patients receiving 5-fluorouracil and irinotecan treatment [11]. Patients receiving irinotecan-based regimens have a 3.45-fold greater risk of developing steatohepatitis than those who have never received chemotherapy [4]. The development of this condition is associated with a disturbance in lipid metabolism and lipoprotein synthesis alterations in hepatocytes, causing an increase in hepatocellular lipid content. Chemotherapy-associated steatohepatitis increases postoperative morbidity and mortality risks [4, 11]. The liver parenchyma demonstrates reduced attenuation when evaluated using a CT. Decreased tumor-to-liver contrast during the portal venous phase can impede metastatic detection. MRI has a higher detection sensitivity for moderate steatosis. Identifying and quantifying the fatty infiltration extent within the liver are facilitated by techniques including CSI (Fig. 9) and proton density fat fraction [4, 11]. Chemotherapy-associated steatohepatitis is generally reversible when the causative chemotherapy is discontinued [21]. While it has been associated with poor postoperative prognosis [11], drug interruption should be carefully considered, weighing risks and benefits.
Fig. 9
Chemotherapy-associated steatohepatitis in a 62-year-old woman with ascending colon cancer, who was undergoing chemotherapy (CTX), including irinotecan for left adrenal metastasis (dotted arrow). a Unenhanced computed tomography (CT) demonstrates normal liver attenuation (CT value, 55 HU) before CTX (arrows). b Decreased liver attenuation (21 HU) is observed on unenhanced CT performed seven months after CTX initiation (arrowheads). Additionally, compared to the c in-phase chemical shift imaging (CSI), a heterogeneous signal drop (open arrows) is seen on the d opposed-phase CSI. No abnormal liver function or hepatitis was indicated by hematological data or clinical symptoms. It is difficult to differentiate chemotherapy-associated steatohepatitis from simple liver steatosis on a single image alone
Amiodarone deposition in the liverAmiodarone, an effective antiarrhythmic medication, has been linked to liver-related adverse effects, including steatohepatitis and cirrhosis [22]. Increased liver attenuation on CT is a characteristic finding associated with long-term use of amiodarone [23] (Fig. 10). This increase in attenuation is caused by amiodarone accumulation in the liver as it contains two iodine atoms that account for approximately 40% of its molecular weight. Amiodarone is more likely to accumulate in the liver than in skeletal muscle or spleen. There is no correlation between the cumulative amiodarone dose and the change in liver density after administration. Previous reports have shown that CT values of the liver may not indicate the severity of liver damage [24]. Discontinuing amiodarone may lead to a decrease in liver attenuation on CT [25].
Fig. 10
Amiodarone deposition in the liver of an 82-year-old man with ventricular tachycardia (VT), who was undergoing amiodarone therapy for VT. a Unenhanced computed tomography (CT) demonstrates normal liver attenuation (CT value, 57 HU) before amiodarone therapy (arrows). b Increased liver attenuation (97 HU) is observed on unenhanced CT performed nine years after amiodarone initiation (arrowheads). No abnormal liver function or hepatitis was indicated by hematological data or symptoms. It is difficult to differentiate amiodarone deposition from iron overload on a single image alone
Secondary iron overloadIron overload can result from excessive iron absorption due to repeated blood transfusions, excessive oral iron consumption, and the use of parenteral nutrition elements. Each unit of transfused blood contains 200–250 mg of iron, and a substantial risk arises when more than 10–20 blood units are transfused [26]. Parenteral nutrition preparations may include iron, manganese, zinc, copper, and iodine [27]. An increase in liver attenuation on CT scans may indicate hepatic iron deposition (Fig. 11). Excess iron is diagnosed based on elevated serum ferritin, iron, and transferrin saturation levels. MRI is the preferred noninvasive diagnostic modality for iron overload and is widely accepted. Various techniques for iron quantification using MRI exist, with R2*-based liver iron concentration considered the most feasible and supported by substantial evidence [28]. Iron chelation therapy, involving medications, such as deferasirox, deferoxamine, and deferiprone, removes excess iron from the body and treats iron accumulation [26, 29].
Fig. 11
Secondary iron overload in a 61-year-old woman with malignant lymphoma, who was undergoing repeated blood transfusions for chemotherapy-induced myelosuppression. a Unenhanced computed tomography (CT) demonstrates normal liver attenuation (CT value, 46 HU) before the blood transfusions (arrows). b An increase in liver attenuation (75 HU) is observed on unenhanced CT performed 1.5 years after initiating blood transfusions (arrowheads). No hematological data or symptoms indicated abnormal liver function or hepatitis. It is difficult to differentiate iron overload from amiodarone deposition on a single image alone
PancreasDrug-induced pancreatitisDrug-induced pancreatitis caused by drugs administered for therapeutic purposes, presents as acute pancreatitis without progressing to chronic pancreatitis. Its frequency ranges from 0.1 to 2% of all cases of acute pancreatitis. While most cases have a good prognosis and are mild, there are severe and fatal cases [30]. Drug-induced pancreatitis occurs due to pancreatic duct obstruction, acinar cell damage, and dysfunctional intracellular transport, with drug-specific toxicity and patient allergic reactions as possible mechanisms [31]. Pancreatitis from drug-specific toxicity typically develops within 24 h, although it is extremely rare. Allergic reactions to drugs are considered the main pathogenesis of drug-induced pancreatitis, with onset occurring 1–6 weeks after administration, often within 30 days [32]. Various drugs have been reported as causative agents, including angiotensin-converting enzyme inhibitor, 5-aminosalicylic acid, and L-asparaginase [
Comments (0)