
Remember me

The European Prospective Investigation of Cancer (EPIC) is a European-wide study of diet and health of which EPIC-Norfolk is a collaborating centre. In brief, EPIC-Norfolk enrolled over 25,000 community dwelling adults aged 40–70 years at baseline (1993–1997), who were registered with a participating GP in and around the city of Norwich, Norfolk (UK) [15]. This study included participants who completed a fourth follow-up health and lifestyle questionnaire (known as ‘Follow 4’) and attended a clinic during the study’s 3rd health check (3HC), conducted predominantly between 2006 and 2011 [15] (with a small pilot phase conducted between 2004 and 2006). We excluded participants aged < 50 years at the time of the fourth follow-up questionnaire or who had already been diagnosed with dementia (Fig. 1).
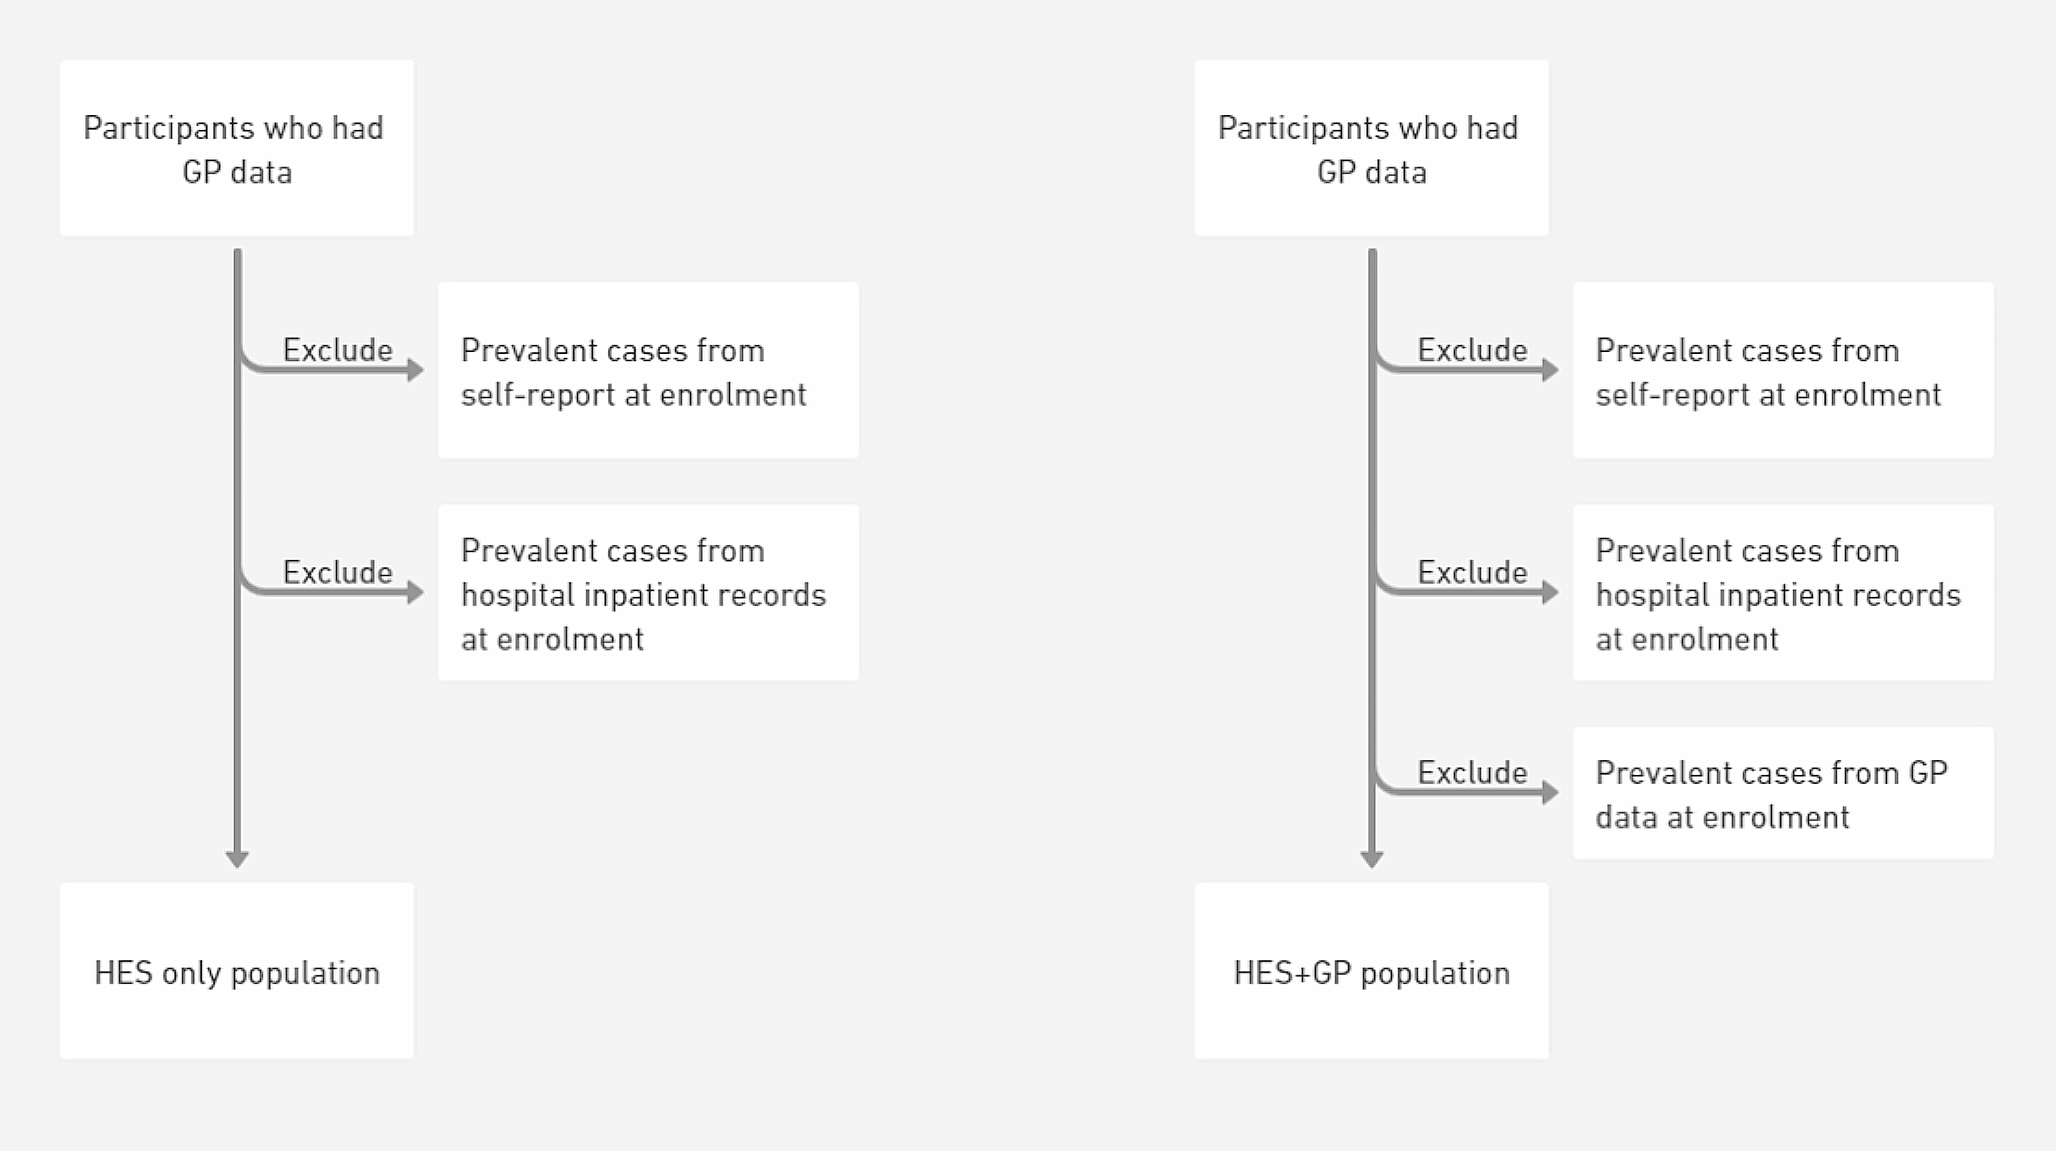
Fig. 1
Selection of study participants in the EPIC-Norfolk third health check, 2006–2011 (including pilot phase 2004–2006) [15, 22]. Participants who had enrolled in the study at baseline were invited to complete a self-reported health and lifestyle questionnaire (known as ‘Follow 4’) around the same time as they were invited to attend the study’s third health check clinic. Participants who completed essential sections of the Follow 4 questionnaire, e.g., SF-36 components, were included in this study
Health-related quality of life assessmentDetails concerning the construction of the SF-36 scales and summary scores, are outlined in other studies [23]. Briefly, the taxonomy comprises 3 levels: (1) 36 items, (2) 8 subscales scored from 0 to 100, calculated using 2–10 items each (physical functioning, role limitations due to physical problems [role physical], bodily pain, general health perception, vitality, social functioning, role limitations due to emotional problems [role emotional] and mental health), and (3) a physical component summary (PCS) and mental component summary (MCS), that aggregate sub-scales. The eight scales are hypothesized to form two distinct higher ordered clusters according to the physical and mental health variance that they have in common. PCS and MCS scores are then calculated based on USA-specific norms [16]. Higher scores in all subscales and summary components indicate better HRQoL in that domain.
The SF-36 was used to ascertain HRQoL as part of the EPIC-Norfolk study’s fourth follow-up health and lifestyle questionnaire, which coincided with the 3HC clinic.
Dementia ascertainmentIncident dementia cases were defined as those participants free of dementia on the date they answered the Follow 4 questionnaire who were subsequently identified with a dementia diagnosis through capture of diagnoses in linked routine health records (determined using the ICD-10 codes listed in Supplementary Table S1). No distinction was made between dementia types in our analyses. Participants were followed up from the date of the fourth follow-up questionnaire until the first date of dementia diagnosis, date of death or censoring, or until 31 March 2019 if neither occurred. Definite clinical diagnosis with all causes of dementia was used in this study and the sub-types of dementia were not analysed separately.
Cognitive function testsThe EPIC-Norfolk cognition battery consisted of 8 tests, measuring ability across different cognitive domains, assessed as part of the 3HC clinic appointment. These tests have been described previously [24] and are summarised in Supplementary Table S2. The following cognitive tests were included: short-form Extended Mental State Exam (SF-EMSE), the Hopkins Verbal Learning Test (HVLT), the Cambridge Neuropsychological Test Automated Battery Paired Associates Learning Test First Trial Memory Score (CANTAB-PAL FTMS), the PW Letter Cancellation Task, the Event and Time Based Task, the Visual Sensitivity Test (VST)-Simple, the Visual Sensitivity Test (VST)-Complex and a shortened version of the National Adult Reading Test (short-NART).
CovariatesCo-variates were chosen a priori after reviewing confounders established in the literature [9, 25,26,27,28,29] and considering correlations between variables and potential overadjustment. The following variables were included: age, sex, body mass index (BMI), educational level (no formal qualifications versus at least completing school examinations aged 16 years), socioeconomic status, hearing problems, physical activity, smoking status, alcohol consumption, systolic blood pressure and self-reported comorbidity (cancer, myocardial infarction, stroke, bronchitis, asthma, arthritis, depression). Co-morbidity was represented as a dichotomous variable, as either having or not having any of the listed conditions. Ascertainment of covariate information is further detailed in the Supplementary Methods.
Statistical analysesAll analyses were conducted using RStudio Version 4.1.0. Descriptive statistics were presented as means (standard deviation, SD), medians (interquartile range, IQR) or proportions (%; number, n) and compared using the relevant statistical test (t-test, Mann-Whitney U-test or chi-squared analysis). All association analyses were conducted as complete case analyses.
HRQoL and its relationship to incident dementiaMain analysesThe prospective association between HRQoL and incident dementia was evaluated using Cox proportional hazards regression, with estimated hazard ratios (HR) and 95% confidence intervals (95% CI) reported. Time to event (follow-up time) for these models was defined as the time from the fourth follow-up questionnaire, to the date at which dementia was first diagnosed. Other participants were followed up until 31 March 2019 or to when the participant died or withdrew from the study. A priori models were adjusted for age and sex (Model 1); age, sex and education level (Model 2); age, sex, social class, smoking status and alcohol consumption (Model 3); age, sex, self-reported comorbidity and hearing problems (Model 4); and a final model including all of these covariates as well as waist-hip-ratio and systolic blood pressure (Model 5). Cox proportional hazards regression models assessed relationships between the two summary scores (PCS and MCS) and incident dementia, with multivariable adjustments as detailed above. Then relationships between the four subscales pertaining to physical health (physical functioning, role-physical functioning, bodily pain, general health) and incident dementia were assessed in separate models whilst additionally adjusting for MCS scores. Relationships between the four subscales pertaining to mental health (vitality, social functioning, role-emotional functioning, mental health) and incident dementia were similarly assessed in separate models whilst adjusting for PCS scores. This structure avoided model instability due to multiple moderate correlations between subscale scores. HRs estimating the relative instantaneous hazard (or reduction in the rate) of incident dementia for each standard deviation (SD) change in each subscale or summary score were calculated.
Additional AnalysesSensitivity analysis: excluding dementia cases in the first five years of follow-upInitial assessment of the Cox proportional hazards models suggested violation of the proportional hazards assumption with significant Schoenfeld residuals. Plots of scaled Schoenfeld residuals against time revealed stronger associations between MCS scores and dementia in the first five years of follow-up, although the best line of fit did not cross ‘0’ implying the direction of association remained unchanged.
Prospective analyses between HRQoL and incident dementia were repeated, after excluding participants diagnosed in the first five years of follow-up. For these models, Schoenfeld residuals were all non-significant (Model 5: Global test p = 0.41; MCS p = 0.14; PCS p = 0.52), with no evidence the PH assumption was violated. Hazard Ratios observed were computed and evaluated for consistency with the main analyses, i.e., those that included cases of dementia identified in the first five years of follow-up. These sensitivity analyses also address potential reverse causation bias, by excluding those diagnosed with dementia closest in time to assessment of HRQoL.
Deciles and quintiles of MCS and PCSMCS and PCS scores were also treated in deciles and quintiles to plot the crude cumulative dementia incidence by decile or quintile of MCS and PCS scores. Following visualisation of these plots, the risk of incident dementia was further explored using Cox proportional hazards regression models with SF-36 summary scores in decile and quintile categories, rather than as a continuous variable.
HRQoL over the eleven years prior to follow-up for incident dementiaHRQoL measured during the Follow 4 questionnaire was the principal exposure measurement of our study. This coincided with the 3HC of EPIC-Norfolk, during which a significant proportion of the cohort underwent objective cognitive testing and were aged 48–92 years old. This wide age-range facilitated exploration of associations by age-group whilst considering adults < 50 years old are unlikely to experience dementia or be the focus of future preventative strategies or trials. However, given the longitudinal nature of the EPIC-Norfolk study, we additionally considered HRQoL measured during administration of a Health and Life Experiences Questionnaire 18 months after the first health examination (HLEQ1; 1993–1997; average time between HLEQ1 and Follow 4: 10.8 years, SD 1.9, range 4.5–15.6 years). Measurement of an exposure at repeated intervals increases measurement accuracy and allows consideration of change. HLEQ1 and Follow 4 scores for MCS and PCS were moderately correlated (Spearman’s rho MCS: 0.45, p < 0.001; PCS: 0.52, p < 0.001). We first explored the average MCS and PCS scores (sum of scores at each time point/2), representing average exposure over the eleven years preceding follow-up for incident dementia. HRs were calculated per SD change of average MCS and PCS score. We then explored change in HRQoL, as differences between HLEQ1 and Follow 4 Scores (‘stable’: +/- 5 point difference; ‘decrease’: >5 point lower score at Follow 4; ‘increase’: >5 point higher at Follow 4). HRs were calculated for ‘increase’ and ‘decrease’ categories relative to ‘stable’.
Model structures replicated those of the main analyses, with additional adjustment for MCS and PCS scores at HLEQ1, in the models considering change in HRQoL.
HRQoL and its relationship to EPIC-Norfolk tests of cognitive functionPrevious work in EPIC-Norfolk has already found strong associations between composite cognitive function and dementia [15], and served as a framework for our analytical approach. A composite cognitive function score was calculated for each participant by compiling scores from the aforementioned cognitive test battery and participants were then categorised into ‘good’ and ‘poor’ cognition groups as described in the Supplementary Methods. Briefly, ‘poor’ cognition was defined as being in the bottom decile for composite cognitive score, while ‘good’ cognition represents a score falling in all other deciles. The association between HRQoL and cognitive performance was studied using logistic regression correcting for the same covariates as above, reporting odds ratios (OR, 95% CI). ORs were calculated per SD change in each summary score of the SF-36 and represent the odds of poor cognitive performance.
Comments (0)