
Remember me


The mediastinum is the area between the left and right lungs, which contains the heart, great vessels, trachea, esophagus, thymus, and other organs [1]. Mediastinal tumors are generally defined as tumors that occur in the mediastinal organs. Mediastinal tumors are relatively rare, may be malignant or benign, and can occur in individuals across a wide range of age groups. Patients with mediastinal tumors are often asymptomatic when the tumors are small. In fact, approximately half of all mediastinal tumors are incidentally detected on chest X-rays or computed tomography (CT) scans. In addition, approximately 80% of asymptomatic mediastinal tumors are benign [2].
Usually, to diagnosis mediastinal tumors initial imaging studies are performed using a combination of chest radiography, chest CT, chest magnetic resonance imaging (MRI), and ultrasonography [3]. Some types of mediastinal tumors show characteristic abnormalities in blood tests, which are useful markers for diagnosis.
According to a previous report, the most common mediastinal tumors are thymomas, which account for approximately 40% of all mediastinal tumors [4].
In this article, we reviewed the imaging features of thymic tumors and the most frequently encountered mediastinal tumors, ranging from benign or malignant lesions that occurred during the normal maturation of the thymus to other anterior mediastinal tumors.
Function, origin, and location of the thymusThe thymus is the main organ of the lymphatic system [5] and is relatively large from infancy to adolescence. However, it begins to decrease in size after puberty and continues to decrease further with increasing age. The primary function of the thymus, which is located in the upper chest, is to promote the development of T lymphocytes. T lymphocytes are white blood cells that protect against foreign organisms (bacteria and viruses) that infect body cells [6]. T lymphocytes also protect the body by controlling cancerous cells.
Hematopoietic stem cells are found in the bone marrow after birth. Granulocytes and B cells, such as red blood cells and platelets, are produced in organs where hematopoietic stem cells are found. In contrast, only T cells are produced in the thymus both in the fetus and after birth [7].
The thymus has a dual embryonic origin [8]. During the sixth week of gestation, the thymic epithelium develops from the ventral diverticular epithelium of the third pharyngeal pouch, along with the thyroid and parathyroid glands. It extends posterolaterally into the surrounding mesoderm as two flask-like structures. The cells that line these flask-like structures proliferate further and are eventually surrounded and invaded by the mesoderm. During the eighth week of gestation, the thymus descends and assumes its final position in the anterosuperior mediastinum. Thereafter, it fuses with its counterpart on the opposite side. Hematopoietic bone marrow precursor cells (mesenchymal origin) migrate into the thymus later in the developmental process. This is how thymocytes reach the thymus gland, and the lymphoid tissue merges with the epithelial cell framework of the thymus [9]. The growth and development of the thymus continue until puberty.
Thymus locationThe mediastinum contains vital vascular and nonvascular structures and organs. The mediastinum is divided into specific compartments that are valuable for the identification, characterization, and management of various mediastinal abnormalities. Numerous mediastinal compartment classification systems have been developed and are used to varying degrees by anatomists, surgeons, and radiologists. In 2014, the Japanese Association for Research on the Thymus (JART) developed a four-compartment multidetector CT–based classification scheme for the division of the mediastinal compartments [1]. Based on discussions with experts in the field of mediastinal diseases, the International Thymic Malignancy Interest Group (ITMIG) modified the JART model, introduced a new definition of mediastinal compartments for cross-sectional imaging, and adopted it as a new standard [10]. The thymus is located in a prevascular compartment according to the ITMIG classification (Fig. 1). The following boundaries of the prevascular compartment are defined in the ITMIG classification system: (1) superiorly, the thoracic inlet; (2) inferiorly, the diaphragm; (3) anteriorly, the posterior border/cortex of the sternum; (4) laterally, the parietal mediastinal pleura; and (5) posteriorly, the anterior aspect of the pericardium that wraps around the heart in a curvilinear fashion. Based on these landmarks, the major components of the prevascular compartment include the thymus, fat, lymph nodes, and the left brachiocephalic vein. The most common abnormalities encountered in the prevascular compartment include thymic lesions (cysts, hyperplasia, and malignancies, such as thymomas, thymic carcinomas, and neuroendocrine neoplasms), germ cell neoplasms (which arise from germ cell remnants in the mediastinum), lymphomas, metastatic lymphadenopathy, and intrathoracic goiters.
Fig. 1
International Thymic Malignancy Interest Group definition of the prevascular compartment. The prevascular compartment is the area marked by the white line
Age-specific changes in the thymusThe size of the thymus varies greatly with age. In infants, the thymus has a square to trapezoid mass-like form [11]. As age increases, it changes to an arrowhead shape, atrophies, and almost completely regresses by the age of 50 [12] (Fig. 2).
Fig. 2
Variations in the thymus size with age. In infants, the thymus has a square-to-trapezoid mass-like form. As age increases, the thymus changes to an arrowhead shape, atrophies, and almost completely regresses by the age of 50. The thymus in a a 2-year-old, b 5-year-old, c 10-year-old, d 15-year-old, e 20-year-old, f 35-year-old, and g 50-year-old. Arrows indicate the thymus
Thymic hyperplasiaThymic hyperplasia can be subdivided into two types: true thymic hyperplasia and lymphoid thymic hyperplasia [13]. True thymic hyperplasia refers to an enlarged thymus gland with an increase in normally organized thymus tissue, exceeding the upper limit of normal for a specific age, as determined by weight and volume. This condition occurs in patients recovering from recent stressors such as anticancer chemotherapy, corticosteroid therapy, radiotherapy, or thermal burns. After being initially atrophic, the thymus gland regrows once the stress is relieved. In some cases, the thymus continues to grow and becomes larger than its original size, known as "rebound hyperplasia". On the other hand, lymphoid hyperplasia is characterized by an increased number of lymphoid follicles and germinal centers in the thymus. The size of the thymus gland may not always be enlarged and can even be atrophic or involved in a neoplasm. Lymphoid hyperplasia is commonly associated with various immunologically mediated diseases, particularly myasthenia gravis.
Both true and lymphoid thymic hyperplasia manifest as a diffuse symmetric enlargement of the thymus, making it difficult to distinguish between them based on imaging findings alone [13]. It is important to distinguish thymic hyperplasia from neoplasms, which tend to present as focal masses. Inaoka et al. [14] reported that thymic hyperplasia could be differentiated from neoplastic lesions using dual-echo chemical shift imaging. A chemical shift ratio (CSR) is calculated by comparing the signal intensity of the thymus gland (tSI) with that of the paraspinal muscle (mSI) on both in-phase (in) and opposed-phase (op) images using the following formula:
$$}\, = \,\left( }/}} \right)/\left( }/}} \right).$$
The mean CSR was 0.61 in the hyperplasia group and 1.0 in the tumor group (Fig. 3) [15]. Another useful quantitative parameter is the signal intensity index (SII), which is calculated as follows:
$$}\, = \,\left[ }\, - \,}} \right)/\left( }} \right)} \right]\, \times \,00\% .$$
Fig. 3
Thymic hyperplasia. A 40-year-old woman with thymic hyperplasia. Transverse in-phase a and opposed-phase b gradient-echo T1-weighted MR images indicate an apparent decrease in the signal intensity of the thymus on the opposed-phase image relative to the in-phase image (arrows). The CSR is 0.45. MR, magnetic resonance; CSR, chemical shift ratio
Priola et al. [16] reported that SII is more practical than CSR for evaluating thymic abnormalities using single-breath-hold acquisition dual-echo imaging. They reported that SII (cutoff: 8.92%) had 100% sensitivity and 100% specificity in differentiating thymic tumors from thymic hyperplasia [16]. Given that dual-echo acquisition is resistant to misregistration and does not require normalization with a reference tissue, the use of SII is recommended instead of CSR because it is easier to calculate and is obtained using a more robust technique.
The CSR is influenced by patient age and weight and tends to be lower in younger and underweight individuals than in older adults and overweight patients because individuals in the latter groups have a higher intramuscular lipid content. Chemical-shift MRI exploits the differences in resonance between fat and water protons. One caveat is that the opposed-phase images of thymolipomas may show signal suppression. Conversely, the opposed-phase images of a normal or hyperplastic thymus in children, young adults, and lean patients may not show signal suppression because of the low amount of intercalated fat in the gland. Thus, caution should be exercised during the evaluation of a non-suppressed opposed-phase image of the thymus in patients who are likely to have a benign-appearing lipid-poor thymus.
Thymic cystsThe thymus migrates caudally during development and is ultimately located in the anterior mediastinum [17]. Thymic cysts arise from the tissue left over during this process and can occur anywhere from the lower neck to the upper mediastinum. Most thymic cysts are congenital, although some are acquired. Acquired thymic cysts may occur after radiation therapy for malignant lymphoma, open-heart surgery, Sjögren’s syndrome, lymphoproliferative disorders, or human immunodeficiency infection. The multifocal form of acquired thymic cysts is often secondary to inflammatory changes [18]. Acquired thymic cysts may present as multilocular thymic cysts, which can be problematic to differentiate from mucosa-associated lymphoid tissue (MALT) lymphoma. The cysts are more common in males and most patients are asymptomatic (Fig. 4). In addition, most of the cysts have serous contents. Congenital cysts contain a mildly hemorrhagic fluid and have a slightly high CT value. In addition, most of the cysts have thin walls. Differential diagnoses for thymic cysts include pericardial cysts, thymomas with strong cystic degeneration, and mature cystic teratomas.
Fig. 4
Thymic cyst. A 51-year-old man with thymic cyst. A 2-cm round cyst is observed in the anterior mediastinum. a T1WI shows low signal intensity (arrow). b T2WI shows a slightly high signal intensity (arrow). c Fat-suppressed T2WI shows a markedly high signal intensity (arrow). The cyst is a well-defined, unifocal lesion with serous content. T1WI, T1-weighted image; T2WI, T2-weighted image
ThymomasThymic tumors are rare; however, since they are the most common anterior mediastinal tumors, it is important to understand their clinical and imaging presentations. Specifically, the clinical features of thymomas need to be fully understood because they are the most common type of thymic tumors [19].
The clinical manifestations of thymomas are almost asymptomatic, although sometimes there are subjective symptoms (cough, chest pain, dyspnea, dysphagia, hoarseness, and superior vena cava syndrome) due to extrinsic compression. In addition, conditions such as myasthenia gravis (or a certain percentage of patients with myasthenia gravis have thymic tumors), pure red cell aplasia, hypogammaglobulinemia, collagen disorders and inflammatory bowel disease may occasionally accompany the thymoma [19].
The histopathological subtypes of thymic epithelial tumors are diverse. The World Health Organization (WHO) classification of the histopathology of thymic tumors is widely used. The clinical grades and prognoses of the histological subtypes of thymic tumors differ [20, 21]. Two major histological types of thymomas are recognized: types A and B. For type A thymoma, the neoplastic epithelial cells and their nuclei are conical or oval, homogeneous, and mildly atypical. Type B thymomas are further classified into three types according to the degree of lymphocytic involvement and atypia of the neoplastic epithelial cells (Table 1). In the fifth edition of the WHO classification, which was published in 2021, the classification of thymomas and thymic carcinomas was strongly reinforced based on new molecular findings [21]. The Cancer Genome Atlas study revealed that types A and AB thymomas and types B1 to B3 thymomas each belong to a spectrum of tumors, with minimal overlap between them (Figs. 5, 6, 7, 8 and 9). These groups are genomically distinct from thymic carcinomas. The Masaoka-Koga staging system [22], which determines the clinical stage of thymomas according to the degree of local invasion, is correlated with prognosis and is widely used (Table 2). The editors of the 5th edition prompt the adoption of the TNM system as the mandatory staging system for thymic epithelial tumor and the modified Masaoka-Koga system as optional [20, 21].
Table 1 World Health Organization classifications of thymomasFig. 5
Thymoma (type A). A 73-year-old man with type A thymoma. a Chest CT scan shows a 1.3-cm, slightly lobulated, prevascular nodule (arrow). b, c MRI shows a prevascular nodule with low signal intensity on T1WI b and high signal intensity on T2WI c (arrow). d MRI shows high intensity on fat-suppressed T2WI (arrow). e MRI shows slightly high signal intensity on DWI (arrow) and a high ADC value (3.4 × 10⁻³ mm2/s). The pathological diagnosis was type A thymoma. CT, computed tomography; MRI, magnetic resonance imaging; T1WI, T1-weighted image; T2WI, T2-weighted image; DWI, diffusion-weighted imaging; ADC, apparent diffusion coefficient
Fig. 6
Thymoma (type AB). A 50-year-old woman with type AB thymoma. a Chest CT scan shows a 2-cm prevascular nodule with well-defined borders (arrow). b–d MRI shows a slightly indistinct border with perivascular fat on the left side of the nodule and a slightly low ADC value (1.36 × 10⁻³ mm2/s) (arrow) (b: T1WI, c: fat-suppressed T2WI, d: DWI). CT, computed tomography; MRI, magnetic resonance imaging; ADC, apparent diffusion coefficient, T1WI, T1-weighted image; T2WI, T2-weighted image; DWI, diffusion-weighted imaging
Fig. 7
Thymoma (type B1). A 73-year-old man with type B1 thymoma. a Chest CT scan shows a 7-cm, lobulated, prevascular mass (arrow). b–d MRI shows high intensity on fat-suppressed T2WI and a slightly low ADC value (1.37 × 10⁻³ mm2/s) (arrow) (b: T1WI, c: fat-suppressed T2WI, d: DWI). CT, computed tomography; MRI, magnetic resonance imaging; T2WI, T2-weighted imaging; ADC, apparent diffusion coefficient; T1WI, T1-weighted imaging; DWI, diffusion-weighted imaging
Fig. 8
Thymoma (type B2). An 80-year-old man with type B2 thymoma. a Chest CT scan shows a 5-cm, slightly lobulated, prevascular mass (arrow). b–d MRI shows heterogeneous signal intensity on T2WI, heterogeneous enhancement on contrast-enhanced T1WI, and a low ADC value (1.13 × 10⁻³ mm2/s) (arrow) (b: T2WI, c: contrast-enhanced T1WI, d: DWI). CT, computed tomography; MRI, magnetic resonance imaging; T2WI, T2-weighted imaging; T1WI, T1-weighted imaging; ADC, apparent diffusion coefficient; DWI, diffusion-weighted imaging
Fig. 9
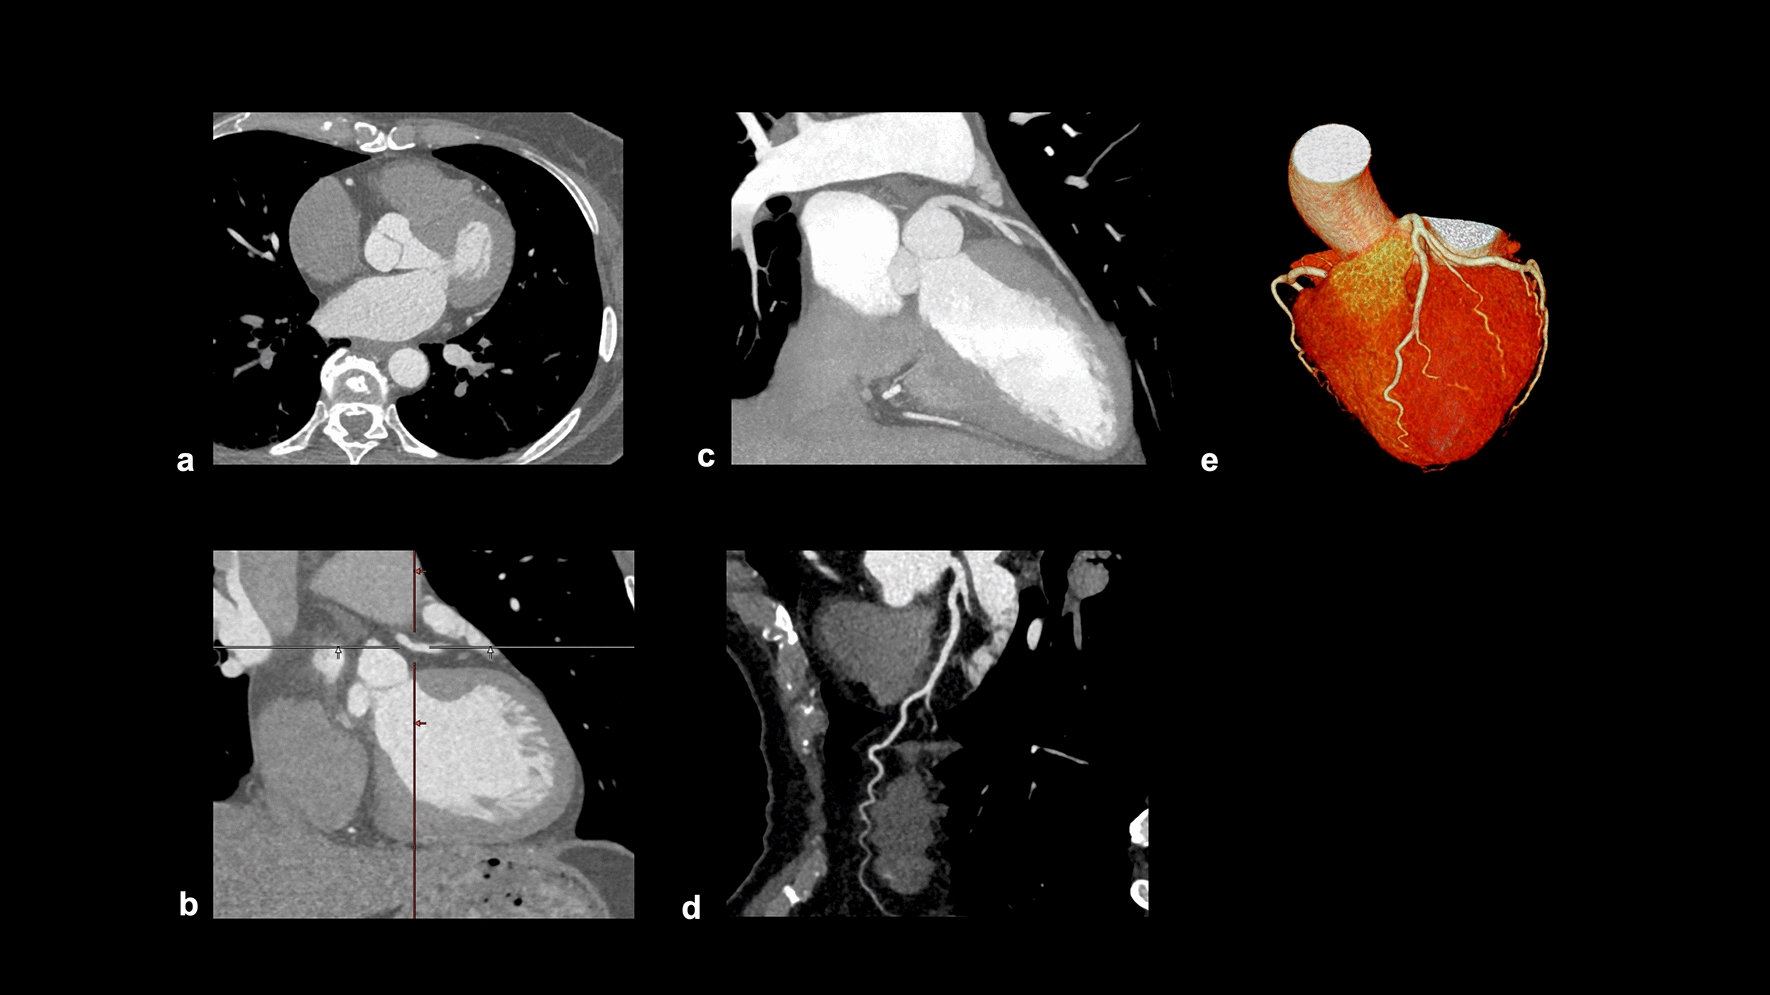
Thymoma (type B3). A 71-year-old man with type B3 thymoma. a–c On contrast-enhanced dynamic CT, a 2-cm, lobulated nodule with homogenous attenuation shows gradual enhancement (arrow). The internal density of the nodule is homogeneous. Contrast-enhanced dynamic CT of the nodule shows gradual enhancement. d 18F-FDG PET shows high FDG uptake in the perivascular nodule (SUVmax = 9.74) (arrow). CT, computed tomography; 18F-FDG PET, 18F-fluorodeoxyglucose positron emission tomography; SUVmax, maximum standardized uptake value
Table 2 Masaoka-Koga and TNM classificationsThe three basic imaging modalities used for the evaluation of thymomas are CT, MRI, and positron emission tomography (PET). Certain key points should be considered in the diagnosis of thymoma using each imaging modality. For CT, localization, calcification, marginal features, and surrounding invasion should be studied. For MRI, the internal signal, especially the diffusion-weighted imaging/apparent diffusion coefficient (ADC) map, should be closely evaluated [23]. Regarding PET, the maximum standardized uptake value (SUVmax) should be assessed [24]. Types A and AB thymomas typically show a smooth contour on CT and MRI scans, with a distinct low-signal-intensity capsule surrounding the mass on T2-weighted images [4]. Type B1, B2 and B3 thymomas often exhibit an irregular contour, with less defined capsules and septa compared to type A and AB thymomas. Types B1, B2, and B3 thymomas frequently show calcifications, particularly linear or curvilinear calcifications along septa. Pleural dissemination is common in high-risk thymomas. 18F- Fluorodeoxyglucose (FDG) accumulation of type A and AB thymomas are low. Type B1, B2 and B3 thymomas exhibit various degrees of accumulation and a definite conclusion has not yet been reached; however, overall, the higher the histological grade, the higher the 18F-FDG accumulation becomes, suggesting that this is correlated to staging [24].
The thymoma grade can be estimated to some extent using imaging findings. However, it should be noted that in rare cases, thymomas with imaging findings similar to those of low-grade thymomas may have poor prognoses (Fig. 10). An atypical type A thymoma variant was added to the WHO classification of the type A thymoma family in 2015 based on several reports of type A thymomas that showed oncologically aggressive behavior and tumor relapses. In the 2021 WHO revision, the atypical variant was changed to an atypical subtype. Its imaging findings indicate that it is a low-grade thymoma that show no evidence of invasion into surrounding tissues on CT and a low SUVmax on 18 F-FDG PET. In contrast, its pathological findings are specific features of atypical type A thymomas. The findings are as follows: (1) mild-to-moderate nuclear atypia, (2) increased mitotic activity, and (3) scattered foci of necrosis. Some cases require follow-up even when imaging findings suggest low-grade thymoma. Thus, careful discussion with a pathologist is necessary.
Fig. 10
Atypical type A thymoma. A 64-year-old man with an atypical subtype of type A thymoma. a Chest CT shows a small round nodule in the anterior mediastinum that did not invade the surrounding organs (arrow). b 18F-FDG PET shows no hypermetabolism in the nodule (arrow). c CT scan is taken 10 years after surgery. The patient relapses and has multiple lung, bone, and brain metastases (arrows). CT, computed tomography; 18F-FDG PET, 18F-fluorodeoxyglucose positron emission tomography
Additionally, thymomas with nonspecific imaging findings, such as rupture or cystic changes, may also be encountered (Figs. 11 and 12) [25, 26]. Thymomas are rarely associated with hemorrhage or rupture. Hemorrhage and necrosis are assumed to occur in the tumors because of hematological disturbances caused by chronic inflammation. Ruptures of mediastinal thymomas are a recognized cause of chest pain and massive pleural effusion. Thymic cysts can be classified as congenital or acquired. Congenital thymic cysts are believed to be remnants of the thymopharyngeal duct. In addition, epithelium is observed on the cyst wall. Acquired thymic cysts are usually multifocal and are associated with inflammatory findings. Cystic changes in thymomas are differentiated by the lack of epithelium on the cyst wall. Although thymic cysts are often reported, thymomas and thymic carcinomas arising from cyst walls have been reported as well; therefore, caution should be exercised during diagnosis.
Fig. 11
Ruptured thymoma. A 50-year-old woman with ruptured thymoma. a, b Chest CT shows a 6-cm, lobulated, perivascular mass (arrow). An uneven increase in the density of fatty tissue in the mediastinum is noted, with a slightly higher pleural effusion density (arrowhead). c The pathological diagnosis is type B2 thymoma. The tumor shows internal necrosis and inflammation that spread to the surrounding tissues (HE staining, medium-power image). CT, computed tomography; HE, hematoxylin and eosin
Fig. 12
Cystic thymoma. A 60-year-old man with cystic thymoma. a, b Contrast-enhanced CT shows a 4-cm cystic mass (arrow). Enhanced nodules are observed within the cyst (arrowheads). c The cystic mass shows high intensity on T2WI (arrow). d The pathological diagnosis was type B2 cystic thymoma. The brown staining represents the epithelial cells, which constitute the cyst wall. Conversely, the blue-stained area corresponds to abnormal cells, which are characteristic of a thymoma. The cyst wall is covered with an epithelial layer. The mass is considered a thymoma arising from a congenital thymic cyst (Cytokeratin staining, low-power image). CT, computed tomography; T2WI, T2-weighted imaging
Thymic carcinomasThymic carcinomas are more aggressive than thymomas and have a higher tendency to spread to other organs. They often exhibit more cellular atypia, increased mitotic activity, and a higher propensity for invasion into nearby structures. The most common histological type of thymic carcinoma is squamous cell carcinoma (Fig. 13). Thymic carcinomas can also present as adenocarcinomas (Fig. 14); however, it is important to distinguish them from metastatic tumors. Thymic carcinomas have a higher tendency to invade surrounding organs, such as mediastinal blood vessels, pleura, lungs, and pericardium, and have a poorer prognosis than thymomas [27]. A low-signal-intensity area on T2-weighted images of a thymic mass is considered suggestive of thymic carcinoma. Histopathologically, these findings may reflect the presence of collagenous tissue or fibrosis. The three characteristic imaging findings of thymic epithelial tumors that are indicative of possible malignancy are a low-signal area on T2WI, low value on the ADC map, and increased 18F-FDG uptake [28].
Fig. 13
Thymic squamous cell carcinoma. A 60-year-old woman with thymic squamous cell carcinoma. a On contrast enhanced chest CT, a 4.4-cm mass with small calcification shows heterogeneous enhancement (arrow) b The mass shows low intensity on T2WI (arrow). c The mass shows heterogeneous intensity on contrast-enhanced T1WI. d, e The mass shows a low ADC value (1.1 × 10⁻³ mm2/s) (arrow). f 18F-FDG PET shows high FDG uptake in the perivascular mass (SUVmax = 10.1) (arrow). g The pathological diagnosis is thymic squamous cell carcinoma (HE staining, medium-power image). The low signal intensity area in the thymic mass on T2WI indicates collagenous tissue and fibrosis pathologically. CT, computed tomography; T2WI, T2-weighted imaging; T1WI, T1-weighted imaging; ADC, apparent diffusion coefficient; 18F-FDG PET, 18F-fluorodeoxyglucose positron emission tomography; SUVmax, maximum standardized uptake value; HE, hematoxylin and eosin
Fig. 14
Thymic adenocarcinoma. A 70-year-old woman with a thymic adenocarcinoma. a, b On contrast enhanced chest CT, a 3-cm mass with small calcification shows heterogenous enhancement (arrow). c The mass shows low intensity on T2WI (arrow). d, e The mass shows a low ADC value (1.2 × 10⁻³ mm2/s) (arrow). f 18F-FDG PET shows high FDG uptake in the perivascular mass (SUVmax = 12.73) (arrow). g The pathological diagnosis is thymic adenocarcinoma (HE staining, medium-power image). CT, computed tomography; T2WI, T2-weighted imaging; ADC, apparent diffusion coefficient; 18F-FDG PET, 18F-fluorodeoxyglucose positron emission tomography; SUVmax, maximum standardized uptake value; HE, hematoxylin and eosin
Thymic neuroendocrine neo
Comments (0)