
Remember me


Clinical examination of the skin is a fundamental skill for all healthcare providers and an essential component of wound care. Standard of care requires visual skin assessment for changes in skin color to assess perfusion, oxygenation, injury, and trauma. For example, healthcare providers assess bony prominences for erythema or redness, which are early signs of pressure injury (PI), and existing wounds for skin color changes indicating deterioration or infection. However, healthcare providers have difficulty detecting skin color changes in persons with dark skin tones;1–3 this has been implicated in the underlying health disparities related to PIs, sexual assault injuries, identification of limb ischemia, forensic examinations for ecchymosis due to trauma, and neonatal jaundice among racial or ethnic groups that include individuals with dark skin tones.4–11
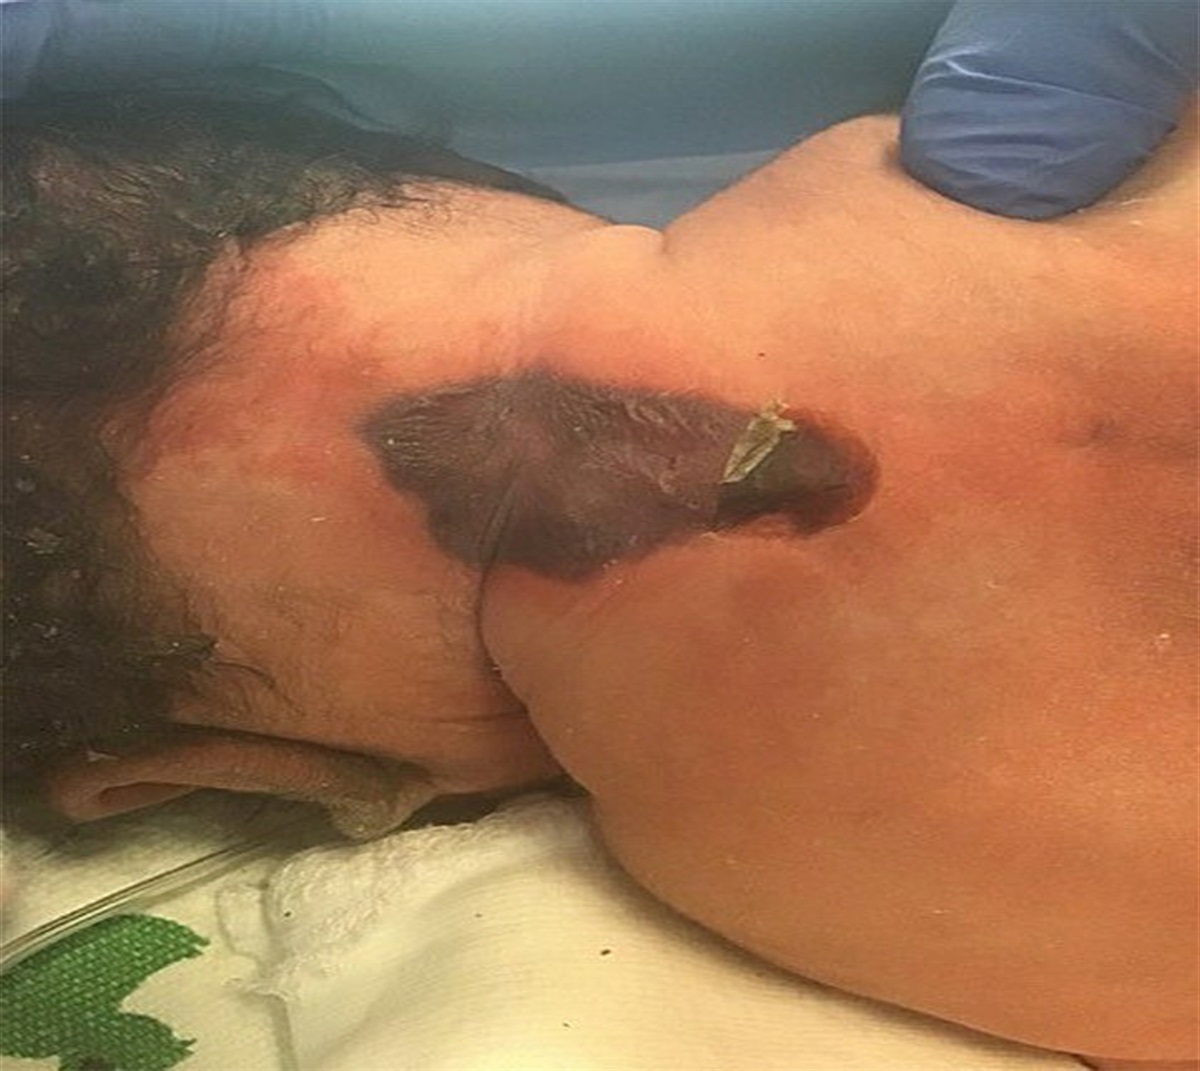
Because skin discoloration is often the first indicator of PI damage, PI prevention begins with early detection of changes in skin color. The earliest skin discoloration associated with PI damage is blanchable erythema, which is a predictor of PI development.12–14 In one study of 493 hospitalized adult patients, blanchable erythema demonstrated 75% sensitivity and 77% specificity for stage 1 or greater PI development.12 If recognized and prevention strategies are implemented, blanchable erythema may resolve, and early PI damage may be reversible.12 If unrecognized, damage may progress to more severe, full-thickness PIs. Difficulties identifying early PIs delay effective prevention. Without early detection, individuals with dark skin tones face longer hospital stays, infection, and, in some cases, premature death.15
The influence of melanin on clinical measurements goes beyond failure to recognize skin discoloration, encompassing other aspects that impact patient care and contribute to health disparities. The documented inaccuracy of pulse oximetry among individuals with dark skin tones has been a known issue for over 20 years. Moreover, the profound treatment inequities experienced by individuals with dark skin tones stemming from the limitations of pulse oximetry were particularly evident during the COVID-19 pandemic.16,17 The underdetection of hypoxemia with pulse oximeters in persons with dark skin tones led to differences in treatment decisions including administration of supplemental oxygen, intravenous dexamethasone, and hospital admission.17
Melanin absorbs and scatters light at specific wavelengths used in the measurement process, which necessitates its consideration in measurement algorithms. Further, the accuracy of measurements can vary depending on the body region. For instance, the finger tends to exhibit higher accuracy and reliability at high oxygen saturation levels, whereas the ear demonstrates better accuracy for lower oxygen saturation levels.18 To develop and validate algorithms for accurate measurement, it is important to accurately account for the presence of melanin during testing and understand its consistency across facial and arm locations where the device may be used.
Studies documenting health disparities use ethnicity and race as a proxy for skin tone; however, ethnicity or race is not a reliable determinant of skin tone,5,6,11 and there have been calls for objective skin tone assessment as a part of routine skin assessments.2,19,20 Dermatology has used skin tone assessment as part of essential clinical practice, and the Fitzpatrick Skin Type Classification Scale (Fitzpatrick Scale) has been the standard for skin tone assessment.21 However, the tool may not be valid for persons with dark skin tones because of its development and application primarily for persons of European heritage.22 The Fitzpatrick Scale’s bias toward sun reactivity leads to the exclusion or misclassification of individuals with dark skin tones. This has prompted suggestions to replace the Fitzpatrick Scale as the standard for skin tone assessment.23,24
The Munsell Soil Color 5YR Chart (Munsell) and Pantone SkinTone Guide (Pantone) are two more objective and inclusive alternatives for assessment of skin tone. These tools are compact and minimally invasive and require no software, calibration, power source, or extensive training. The Munsell System of Color Notation is a numerical color notation system based on hue (in this case, 5YR), value (or lightness, the vertical axis of the chart), and chroma (the strength of the color, or horizontal axis of the chart) and is used internationally to describe and compare colors of many substances such as paint, buildings, plants, and soil.25 Munsell has been used effectively by patients and dermatologists to describe human skin tone,26 assess blue and red skin coloration,27 and evaluate the accuracy of erythema detection algorithms.28 McCreath and colleagues6 used Munsell to classify the skin tone of nursing home residents at risk for PIs. They showed significant overlap of Munsell values among ethnic and racial groups and found that skin tone measured with Munsell was a better predictor of PI risk than was race or ethnicity.6
The Pantone guide uses a handheld assortment of 110 swatches to match skin color and is used by artists, researchers, and prosthetic manufacturers.29 Pantone uses a four-character alphanumeric combination to represent skin color, with the first two characters denoting the hue (number) and undertone (“Y” or “R”) and the last two characters indicating the lightness or darkness of the skin tone on a scale from 1 (lightest) to 15 (darkest; eg, 4Y09). Pantone has been used in clinical applications such as improving aesthetic outcomes during allotransplantation and measuring skin color changes as an indication of therapy effectiveness.30,31 Both the Munsell and Pantone guides rely on observer visual acuity and situational lighting, but some evidence indicates that lighting may not impact the accuracy or reliability of the Munsell.32
A more quantitative and observer-independent measure of skin tone is the use of colorimetry and spectrophotometers. Colorimeters are small, handheld devices used to obtain objective measurements of color using a three-dimensional color space via the international standard Commission Internationale de l’Eclairage system, which is represented by three axes: L*, a*, and b*.33 The L* axis is a grayscale with values from 0 (black) to 100 (white).34 The L* value correlates with the level of skin pigmentation. The a* axis describes red and green values, which correlates with erythema. The b* axis describes yellow and blue values and correlates with pigmentation and tanning.25
Colorimetry is a simple and reproducible method that can be used to quantify the erythemic intensity of spontaneous and experimental lesions.35 The ColorMeter DSM III (ColorMeter; Cortex Technology) uses narrowband reflectance spectrophotometry to measure the intensity of light reflected from a 4-mm skin area and report colorimetric parameters, including tristimulus values. The red and green light absorptions are changed by hemoglobin and melanin, so the ColorMeter reports an erythema value and melanin value in addition to the Commission Internationale de l’Eclairage L* a* b* values.25
Some studies have compared colorimeter values in different body locations. Shriver and Parra36 found a strong negative correlation between L* and melanin measures of the arm and forehead for all ethnic groups. However, increased vascularization in the forehead weakened this correlation. Clarys et al37 demonstrated that three colorimeters could measure erythema and skin blanching using a* values, and all could quantify small changes in skin color. Phan et al38 observed greater L* values and decreased melanin in the palm compared with the forearm across ethnic and racial groups. Van der Wal et al39 showed that colorimeters reliably assessed vascularization (erythema) and pigmentation (melanin) of scar tissue with a single measurement.
With regard to PIs, Scafide and colleagues’10 systematic review of PI detection found that colorimeters were effective in detecting changes in erythema, although the included studies focused on visually detectable erythema. Borzdynski et al40 found that colorimeter measurements had a stronger association with PI development than visual assessment.
Dadzie et al41 have taken the melanin values obtained with colorimeters a step further and suggested specific classifications for melanin values as a system for describing skin tones using terminology that is not race-based nor exclusionary but is based on scientific data. They propose the Eumelanin Human Skin Colour Scale (Eumelanin Scale) for describing skin tones. The classification is based on eumelanin, the dominant chromophore of human skin that is universal in all skin colors.
The purpose of the present study was to examine the effectiveness of the ColorMeter at grouping individuals by skin tone, measuring erythema/skin discoloration after erythema induction across skin tones and measuring melanin across facial and arm locations using a pre/post experimental design with a convenience sample of healthy adults. The specific aims of this study were to:
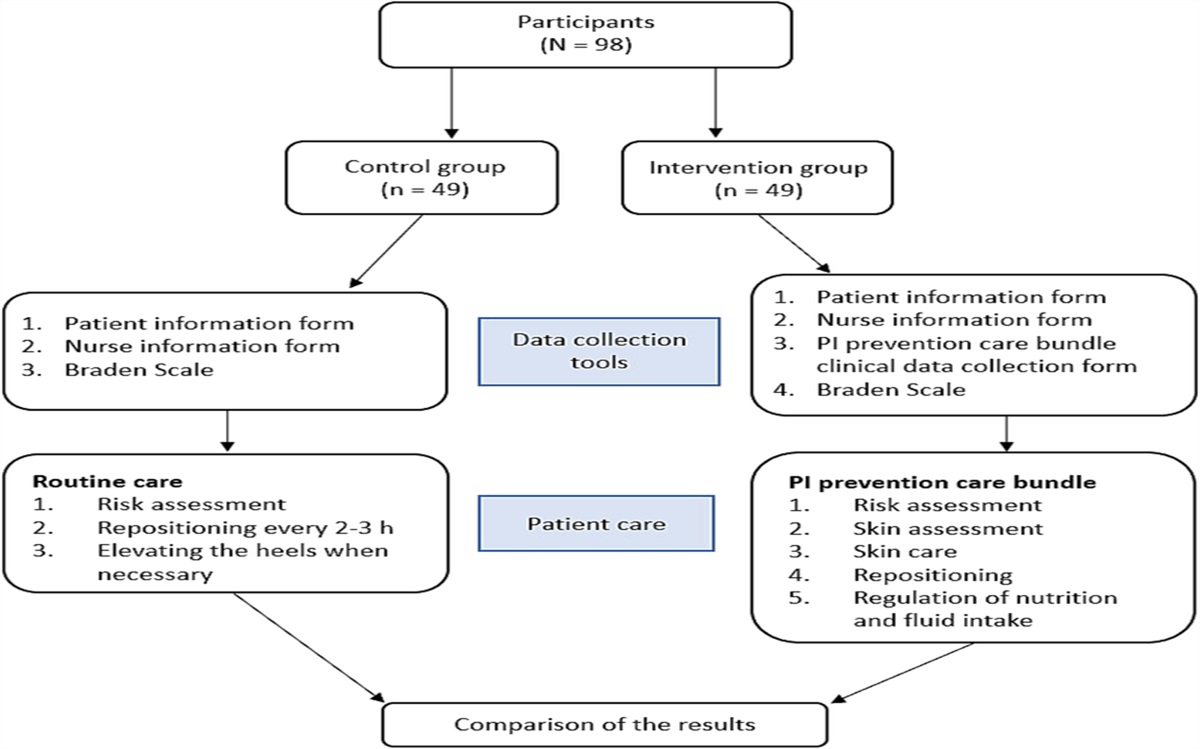
1. Compare ColorMeter L* and melanin values of the forearm to the corresponding Munsell value and chroma measures and Pantone darkness and hue values. 2. Compare ColorMeter melanin values and Eumelanin Scale grouping across facial and arm locations. 3. Examine the effectiveness of the ColorMeter at quantifying erythema/discoloration among skin tone groups. METHODSThis study used a pre/post experimental design consisting of skin tone assessment at the mid volar forearm of healthy adults, one episode of induced erythema, and melanin measures of facial and arm locations. Investigators recruited a convenience sample of healthy adults using posters and word of mouth. Participants came from a diverse region of the southeastern US and were older than 18 years, spoke English, and could provide informed consent. Potential participants were excluded if they had a skin disease present on the arm that placed them at risk for irritation from induced erythema.
The study protocol was approved by the Georgia Institute of Technology Institutional Review Board. After learning about the study and having the opportunity to ask questions, participants provided signed informed consent. All data were deidentified and coded with a study identification number and stored in a locked filing cabinet with only study team access.
InstrumentationSkin tone was measured with three tools per participant (Munsell, Pantone, and ColorMeter), whereas erythema was measured with the ColorMeter only. From the ColorMeter, the L* and melanin values were used to study skin tone, the erythema value was used for the erythema investigation, and the melanin value was used to examine facial and arm locations.
Participants were grouped by Munsell value into three skin tone groups: light skin tones (Munsell values 7 through 8), medium skin tones (Munsell values 5 through 6), and dark skin tones (Munsell values 2.5 through 4).6
The Eumelanin Scale groups individuals by melanin value obtained with a colorimeter into one of five groups: eumelanin low (EML), less than 25; eumelanin intermediate low (EMIL), 25 to less than 50; eumelanin intermediate (EMI), 50 to less than 75; eumelanin intermediate high (EMIH), 75 to less than 100; and eumelanin high (EMH), 100 or more.41
STUDY PROTOCOLParticipant characteristics were obtained through a brief, investigator-developed demographic survey completed by the participant. The investigators then selected the nearest skin tone match at the right volar (inner) mid forearm from the Munsell and Pantone. ColorMeter measurements were taken at the same location for comparison. Additional ColorMeter measurements were collected at facial and arm locations including the dorsal thenar region (above base of the thumb), forehead (1 cm above right eyebrow), earlobe, and ear pinna (top of ear) on the right side. The ColorMeter was calibrated weekly following manufacturer guidelines.
Two primary test sites were used to investigate the ability to detect erythema: the right ulnar head (UH) and the right medial dorsal (ie, back) mid forearm, two-thirds proximal to the radial head (forearm). First, ColorMeter values were measured at both sites at baseline after a visual skin assessment to note any outstanding skin observations (eg, excess hair, tattoos, dry skin). The participant’s right arm was placed in a padded forearm support, and the areas of interest (UH and forearm) were traced and labeled using a skin-safe marker.
Next, the skin surface was dampened to promote an airtight seal with the cupping device, and a 1-inch hard plastic cup and an attached pump were used to apply pressure at the UH. Pressure was applied and maintained at −25 kPa on the UH for 3 minutes. Immediately after the skin was patted dry, ColorMeter measures were obtained at the UH, and a single investigator conducted visual skin assessments to detect presence or absence of erythema and severity (none, slight, minimal, moderate, severe). Additional measurements were collected that are outside the scope of this study.
After this, a 5- to 10-minute recovery period commenced. Following the recovery period, ColorMeter values were remeasured at the UH, and a second visual skin assessment performed. The timing of the second assessment was an average of 9 minutes after the first assessment. This was repeated for the second test site at the forearm, except for maintaining suction at −30 kPa for 2 minutes. Differences in pressure at the two sites were determined based on preliminary testing of pressures required to induce blanchable erythema, likely due to the differences in soft tissue thickness between sites and presence of a bony prominence at the UH.
Data AnalysisA power analysis was conducted using G*Power version 3.1.9.7 to determine the minimum sample size required to test the difference in baseline to immediate erythema values. Results indicated that the required sample size to achieve 80% power for detecting a medium effect at a significance criterion of α = .05 was N = 54 for paired t test or Wilcoxon signed-rank test.
Data were checked for normality using the Shapiro-Wilks statistic and Q-Q plots. ColorMeter melanin and L* values at the forearm were compared with Munsell value (lightness) and chroma (color strength), Pantone hue, and Pantone darkness values using Spearman ρ correlation statistics.
Munsell skin tone groups were compared with Eumelanin Scale groupings. Correlations between melanin values at different facial and arm locations by skin tone group were also calculated. Finally, Eumelanin Scale groupings determined with melanin values taken at the forearm were compared with groupings based on melanin values taken at alternative locations.
To address changes in erythema values from baseline to those measured immediately after erythema induction (immediate) and following approximately 10 minutes of recovery time (delayed), paired Wilcoxon signed-rank tests were run comparing baseline to immediate and delayed erythema values at the forearm and UH. Then, erythema Δ measures were calculated from erythema measurements. The erythema Δ values represent the change in erythema from baseline to immediate and from baseline to delayed, separately for the forearm and UH. Erythema Δ values at each location were then compared between time points via paired Wilcoxon signed-rank tests with .05 significance to assess whether the change in erythema varied based on elapsed time. In addition, erythema Δ values were compared across Munsell skin tone groups using Kruskal-Wallis test with .05 significance and post-hoc analyses using the Dunn test.
Baseline skin tone measures and demographics were compared by sex using Mann-Whitney U test, Kruskal-Wallis test, and χ2 statistics where appropriate. Analyses were conducted using IBM SPSS Statistics (version 28.0; IBM Corp).
RESULTSTable 1 presents the demographic characteristics and baseline skin tone measures for the 61 healthy adult participants. On average, participants were young (28.8 ± 14.3 [range, 18–64] years), nonsmoking women (n = 39). The dominant ethnicity of participants was non-Hispanic, and participants were nearly evenly split among Black (29% [n = 18]), Asian (26% [n = 16]), and White race (38% [n = 23]). Four participants identified as more than one race.
Table 1. - DEMOGRAPHIC CHARACTERISTICS AND BASELINE SKIN TONE MEASURES OF PARTICIPANTS % (n) or Mean (SD) P a Total (N = 61) Women (n = 39) Men (n = 22) Characteristic (range) Age, y (18–64) 28.8 (14.3) 26.6 (11.4) 32.8 (18.0) .49 Height, in (58.0–76.0) 66.6 (4.4) 64.3 (2.9) 70.7 (3.6) <.001 Weight, lb (99–264) 155.6 (38.9) 146.5 (40.8) 171.7 (29.8) .002 Body mass index, kg/m2 (17.2–45.3) 24.7 (6.0) 24.9 (6.5) 24.3 (4.9) .24 Smoking status .49 Current smoker 4.9 (3) 7.7 (3) 0 Former smoker 8.2 (5) 5.1 (2) 13.6 (3) Has never smoked 86.9 (53) 87.2 (34) 86.4 (19) Race .36 Asian 26.2 (16) 23.1 (9) 31.8 (7) Black 29.5 (18) 30.8 (12) 27.3 (6) White 37.7 (23) 38.5 (15) 36.4 (8) More than one race 6.6 (4) 7.7 (3) 4.5 (1) Ethnicity .50 Hispanic 5 (3) 7.7 (3) 0 Non-Hispanic 90 (54) 89.7 (35) 90.5 (19) Prefer not to answer 3.3 (2) 0 9.5 (2) Unknown 1.7 (1) 2.6 (1) 0 Baseline skin tone measures (range) Munsell Color Chart (4.3–7.4)b Measure 6.2 (1.0) 6.3 (1.0) 6.0 (1.0) .26 Value 5.8 (1.0) 5.9 (1.0) 5.6 (1.0) .33 Chroma 3.5 (0.7) 3.4 (0.8) 3.6 (0.5) .37 Pantone Light-dark (1–13) 7.34 (3.56) 7.13 (3.41) 7.71 (3.87) .48 Red-yellow 23.11 (2.45) 23.31 (2.28) 22.76 (2.75) .25 ColorMeter L* value: forearm 53.09 (8.85) 59.64 (8.65) 56.54 (7.91) .10 ColorMeter erythema value: forearm 17.42 (4.06) 12.97 (4.34) 15.75 (4.20) .06 ColorMeter melanin value Forearm 41.45 (12.22) 40.51 (12.53) 43.12 (11.74) .35 Thenar eminence 37.94 (7.53) 37.27 (7.59) 39.13 (7.45) .31 Forehead 45.19 (15.7) 44.18 (15.37) 46.98 (16.49) .50 Earlobe 41.91 (16.56) 41.77 (17.11) 42.18 (15.96) .80 Ear pinna 43.80 (16.14) 42.00 (16.66) 46.91 (15.07) .18aBased on χ2 statistic, Mann-Whitney U tests, or Kruskal-Wallis tests as appropriate.
bTwo participants were not rated with the Munsell Color Chart.
More than half of the participants were categorized in the Munsell medium skin tone group (58% [n = 34/59]); 30% (n = 18/59) were categorized in the light skin tone group, 12% (n = 7/59) were categorized in the dark skin tone group, and two participants were not rated with the Munsell Color chart (Table 1). No differences existed between men and women for age, ethnicity, race, or any of the baseline skin tone measures across any location.
ColorMeter Comparisons to Munsell and PantoneHigher Munsell measures correlated with higher ColorMeter L* values and with lower ColorMeter melanin values at the forearm (r = 0.88 and 95% CI, 0.81 to 0.93; r = −0.87 and 95% CI, −0.92 to −0.80, respectively; Figure 1). In contrast, the Pantone darkness value at the forearm showed a strong positive relationship with ColorMeter melanin values (r = 0.89; 95% CI, 0.82–0.93) and an inverse relationship with the ColorMeter L* values (−0.90; 95% CI, −0.94 to −0.84; Figure 2). All ColorMeter L* value and melanin value correlations with Munsell and Pantone darkness values were significant at P < .001. All Munsell chroma measures and nearly all Pantone hue values were not correlated with ColorMeter L* or melanin values.
 Figure 1.:
 COLORMETER MELANIN MEASUREMENT VERSUS MUNSELL VALUE/CHROMA AT THE FOREARMMunsell readings noted as two-digit numbers with one significant figure. The Munsell value was in the ones place, and the chroma was in the tens place (Value.Chroma).Abbreviation: CU, ColorMeter units.
 Figure 2.:
 PANTONE DARKNESS VALUE VERSUS MELANIN (LEFT) AND L* (RIGHT) OF THE FOREARM AS MEASURED BY THE COLORMETER AND GROUPED ACCORDING TO MUNSELL SKIN TONE GROUPSPantone darkness value and ColorMeter melanin values increase in the dark skin tone group, whereas L* values decrease.Abbreviation: CU, ColorMeter units.
ColorMeter Melanin Values and Eumelanin Scale GroupingsThe ColorMeter forearm melanin values of Munsell skin tone groups were 30.11 ± 4.37 (range, 22.66–38.64) for the light skin tone group, 43.70 ± 8.25 (range, 30.62–60.57) for the medium skin tone group, and 63.32 ± 6.38 (range, 54.36–72.97) for the dark skin tone group. ColorMeter forearm melanin values of participants in the Munsell light, medium, and dark skin tone groups were spread out, but there was considerable overlap in terms of Eumelanin Scale grouping (Table 2). Most participants were included in the EMIL group.
Table 2. - EUMELANIN SCALE GROUPINGS AND COLORMETER MELANIN VALUES AT THE FOREARM FOR PARTICIPANTS BY MUNSELL GROUPINGS Variable Light Medium Dark Munsell measurement range (by definition) 7–8 5–6 2.5–4 Eumelanin Scale groupings, n Low 3 0 0 Intermediate low 15 27 0 Intermediate 0 7 7 Melanin value, mean (SD) 30.11 (4.37) 43.70 (8.25) 63.32 (6.38)The melanin values across all pairs of body regions (ie, forearm, thumb, forehead, earlobe, pinna) were positively correlated, although ear pinna had a weaker correlation with arm locations (Table 3). Melanin value correlations across body locations were more moderate for the Munsell dark skin tone group (Figure 3). Consistent with varying correlation values, grouping participants by melanin at the forearm produced different results than when grouping participants by other body regions (Table 4). Specifically, measuring melanin at the forehead changed the grouping of nine participants in the EMIL group, including eight who were classified into a darker skin group, whereas measurement at the thenar eminence had the greatest impact on participants in the EMI group, changing the category of nine individuals into a lighter skin group.
Table 3. - SPEARMAN ρ CORRELATIONS AMONG MELANIN MEASUREMENTS AT DIFFERENT BODY REGIONSa Arm Thumb Forehead Earlobe Pinna Arm 1 0.862 0.947 0.897 0.824 Thumb 1 0.872 0.824 0.808 Forehead 1 0.930 0.838 Earlobe 1 0.812 Pinna 1aAll correlations are significant, P < .001.
 Figure 3.:
 COLORMETER MELANIN VALUE OF THE FOREARM COMPARED WITH THE FOREHEAD ACROSS MUNSELL SKIN TONE GROUPSMelanin value correlations between the arm and forehead are weaker for the Munsell dark skin tone group than the light skin tone group.Abbreviation: CU, ColorMeter units.
Table 4. - DIFFERENCES IN EUMELANIN SCALE GROUPINGS BY BODY LOCATION Eumelanin Low Eumelanin Intermediate Low Eumelanin Intermediate Eumelanin Intermediate High Eumelanin High Eumelanin low (n = 3 at forearm) Thenar 0 3 0 0 0 Forehead 1 2 0 0 0 Earlobe (one missing) 1 2 0 0 0 Pinna (one missing) 1 2 0 0 0 Eumelanin intermediate low (n = 44 at forearm) Thenar 0 44 0 0 0 Forehead 1 35 8 0 0 Earlobe (one missing) 4 38 1 0 0 Pinna (one missing) 1 40 2 0 0 Eumelanin intermediate (n = 14 at forearm) Thenar 0 9 5 0 0 Forehead 0 1 10 3 0 Earlobe (one missing) 0 2 10 1 1 Pinna (one missing) 0 1 11 2 0Erythema values ranged from 6.77 to 27.67 before inducing erythema. Following the induction of erythema, paired Wilcoxon signed-rank tests showed average erythema values increased significantly at both the UH and forearm from baseline to immediate and from baseline to delayed measurement (P < .001, Table 5). However, the change in erythema compared with baseline was greater for immediate measures than delayed measures at the UH (P = .009) and forearm (P = .023), indicating a reduction in erythema during the recovery period.
Table 5. - BASELINE ERYTHEMA VALUES AND CHANGES IN ERYTHEMA VALUES FROM BASELINE TO IMMEDIATE AND DELAYED TIMEPOINTS (N = 61) Erythema Δ Value vs Baseline Location Time Point Mean (SD) CU Range, CU Mean (SD) 95% CI P a Ulnar head Baseline 16.34 (4.01) 7.01–23.74 — — — Ulnar head Immediate 18.48 (3.84) 9.54–28.30 2.15 (2.37) 1.54–2.75 <.001 Ulnar head Delayed 17.86 (3.84) 8.71–25.32 1.52 (1.95) 1.02–2.02 <.001 Forearm Baseline 17.42 (4.06) 6.77–24.00 — — — Forearm Immediate 18.77 (3.81) 9.65–25.55 1.35 (1.59) 0.94–1.75 <.001 Forearm Delayed 18.42 (3.52) 9.34–24.47 1.00 (1.50) 0.61–1.38 <.001Abbreviation: CU, ColorMeter units.
aPaired Wilcoxon signed-rank test.
When comparing erythema Δ values across skin tone groups, no significant differences existed at the UH (P > .05;
Comments (0)