
Remember me


The WHO [1,2], the United Nations Children's Fund [1], and the US Centers for Disease Control and Prevention [3] define birth weight (BW) of less than 1000, 1500 and 2500 g as extremely low, very low and low, with normal and high BW ranging from 2500 up to 4000 g and exceeding 4000 g, respectively. High BW is a forerunner of obesity [4] and type-1 diabetes [5], which are important determinants of adult morbidity and mortality. Conversely, according to the developmental origins of disease hypothesis [6], undernutrition and an adverse intrauterine environment, on the background of genetic factors, slows fetal growth as an adaptive response that favors short-time survival at the expense of a larger susceptibility to disease later in life [7]. Furthermore, because of incomplete nephron endowment [8], very low BW predisposes to hypertension. Eleven-year-old children born with extremely low BW, compared with controls born at term, were 10 times more likely to have hypertension with preservation of the inverse association of plasma renin activity with blood pressure (BP) but not with 24-h urinary sodium excretion (UVNA) [9].
According to a systematic literature review [10], BP and the risk of cardiovascular complications increased when sodium intake exceeded 5 g/day. In an individual-participant meta-analysis of European population studies [11], higher UVNA was associated with higher SBP (0.4 mmHg per year per 2.3 g higher UVNA), but not with increased risk of hypertension or major cardiovascular events. The goal of the current analysis was to explore in the same data resource [11]; however, with longer follow-up of participants and updated endpoints, whether the associations of UVNA with BP and the risk of hypertension, death and a composite cardiovascular endpoint were modified by BW.
METHODS Study cohortsThe population studies included in the current meta-analysis met the principles outlined in the Helsinki declaration for investigation of human participants [12]. The study protocols and the secondary analyses of anonymized data were approved by the competent, local Institutional or National Review Boards. Participants gave written informed consent at recruitment and renewed consent at each follow-up visit.
Recruitment for the Flemish Study on Environment, Genes and Health Outcomes (FLEMENGHO) started in 1985 [13]. From August 1985 until November 1990, a random sample of the households living in a geographically defined area of Northern Belgium was investigated with the goal to recruit an equal number of participants in each of six subgroups by sex and age (20–39, 40–59 and ≥60 years). All household members with a minimum age of 20 years were invited to take part, provided that the quota of their sex-age group had not yet been satisfied. From June 1996 until January 2004, recruitment of families continued, using the former participants (1985–1990) as index persons and also including teenagers [14]. The participants were repeatedly followed-up. In all study phases, the same standardized methods were applied to measure clinical and biochemical variables, to administer questionnaires and to ascertain the incidence of fatal and nonfatal outcomes. The European Project on Genes in Hypertension (EPOGH) [15] recruited participants from 1999 until 2001 (Table S1, https://links.lww.com/HJH/C186 in the online only Data Supplement). The EPOGH investigators were trained in Leuven, Belgium and applied the same protocol, questionnaires and follow-up procedures, as used in FLEMENGHO. Questionnaires were translated from Dutch into Czech, Italian, Polish and Russian and back-translated into Dutch to check that all questions had the same meaning in all languages. At baseline, the participants collected a 24-h urine sample. The last follow-up examination, which also included a 24-h urine sampling, took place from 1991 to 2017 in FLEMENGHO, and from 2006 until 2014 in EPOGH.
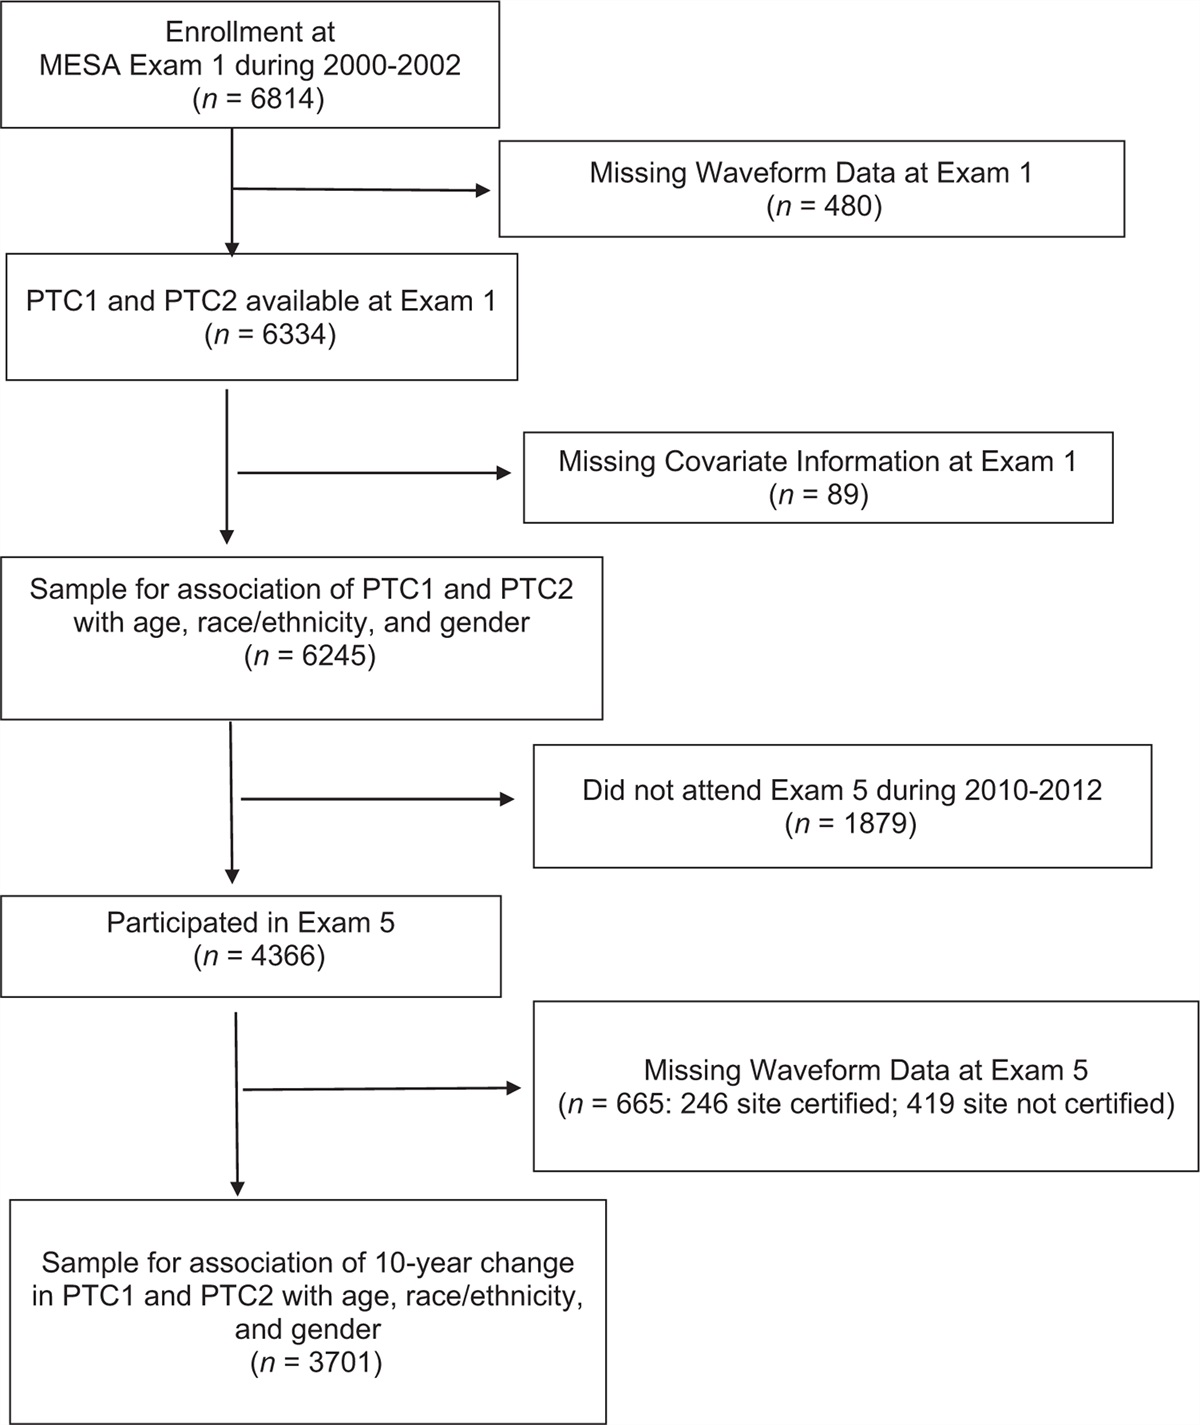
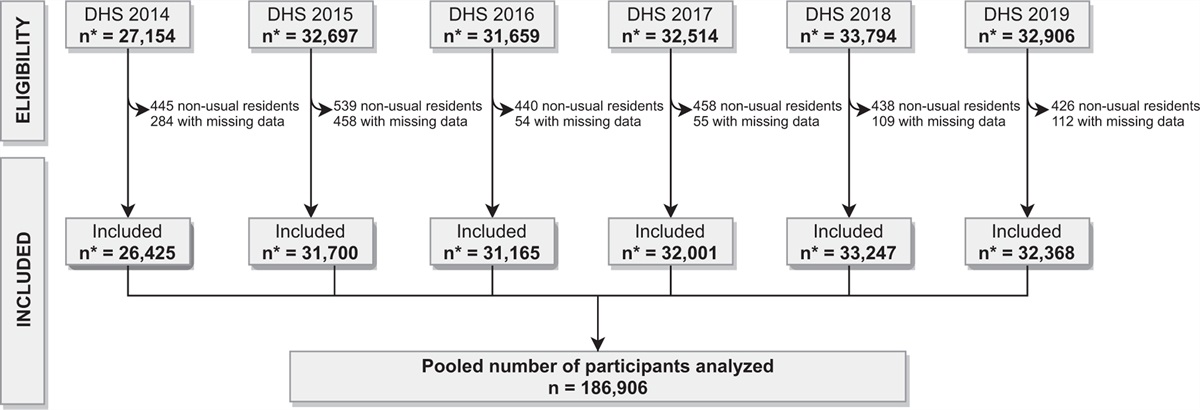
Overall, 6242 individuals were invited and 4712 participants consented to participate: 3343 in FLEMENGHO and 1369 in EPOGH (Fig. 1). After excluding participants younger than 18 years and those with missing BW or no or inaccurate 24-h urine collection, the Outcome cohort included 1945 individuals, who were available to investigate the incidence of mortality and major cardiovascular events. After applying similar exclusion criteria and excluding participants with hypertension at baseline or no follow-up BP measurement, 1460 participants were left to study the incidence of hypertension (Hypertension cohort). After further exclusion of participants with no or inaccurate 24-h urine collection, the Blood Pressure cohort with 1039 participants was analyzed to investigate the association between changes in BP and UVNA from baseline to follow-up. The mortality incidence rate in our study population was 3.8% in the median follow-up of 16.6 years. The mortality rate was 3.5 deaths per 1000 persons per year in Belgium [16]. With α = 0.05 and power of 0.95, the sample size should be 1479 or more in the study population for the analysis of mortality. In our study, the number of participants included in the Outcome cohort reached the sample size. As proposed by the Framingham investigators, in participants on antihypertensive treatment at follow-up, 10/5 mmHg was added to the measured SBP/DBP [17,18]. To address heaping of the reported BW and the potential overreporting of a BW of 2500 g, this threshold value was assigned to the category of low BW [19]. The predefined criteria to identify imprecise 24-h urine collections were: a volume of less than 300 ml per 24-h; 24-h creatinine excretion less than 450 mg (<4 mmol) or at least 2830 mg (≥25 mmol) in women or less than 680 mg (<6 mmol) or at least 3390 mg (≥30 mmol) in men [13]. After stratification for sex and age (<60 vs. ≥60 years), urinary creatinine output was regressed in each stratum on body weight. Observations falling outside the 95% confidence interval (CI) for individual prediction of the creatinine excretion as function of body mass [20,21]. In analyses, in which the explanatory variable was the sodium-to-potassium ratio (UNAK), participants with inaccurate urine collection were not excluded, so that for the study of adverse health outcomes and hypertension, 2054 and 1516 participants were available and 1262 for the study of changes in BP in relation to UNAK changes (Figure S1, https://links.lww.com/HJH/C186).
 FIGURE 1:
 Flowchart for participants in the study. Outcome cohort and Hypertension cohort refer to participants used to study the incidence of mortality and morbidity of cardiovascular endpoints and the incidence of hypertension, respectively. The relation of the changes from baseline to follow-up in blood pressure with the changes in the 24-h urinary sodium excretion was investigated in the Blood Pressure cohort. See Methods for the definition of inaccurate urine collections.
Data collection at baseline and follow-upTrained observers administered the same questionnaire at baseline and follow-up to collect each participant's self-reported BW, medical history, smoking status, drinking habits, medication use, and educational attainment. The BW questionnaire and the methods for urine collection and biochemical measurements are described in the online-only Data Supplement, https://links.lww.com/HJH/C186 (pp. S2–S4).
In each country, outcomes were adjudicated against relevant source documents. The vital status of FLEMENGHO and EPOGH participants was ascertained through 31 December 2016 and 30 June 2017, respectively. From the appropriate sources in each country, vital status was ascertained, and the International Classification of Disease (ICD) codes for the immediate and underlying causes of death were collected. Physicians ascertained the diseases reported on the death certificates or collected by questionnaire or telephone interview against the medical records of general practitioners, hospitals or health insurers.
Endpoints were all-cause mortality, the composite of all fatal and nonfatal cardiovascular endpoints, and the incidence of hypertension. All fatal and nonfatal cardiovascular endpoints included stroke, coronary events, heart failure and other fatal and nonfatal cardiovascular events. Coronary events included sudden death, fatal and nonfatal myocardial infarction, acute coronary syndrome, hospitalization for unstable angina and coronary revascularization. Fatal and nonfatal stroke did not include transient ischemic attacks. The other fatal or nonfatal events contributing to the mortality and the composite cardiovascular endpoint were heart failure, aortic aneurysm, pulmonary heart disease, pulmonary or arterial embolism, and peripheral arterial disease leading to amputation or revascularization. Heart failure was a clinical diagnosis or the diagnosis on the death certificate, but was in all cases, validated against hospital files or the records held by family physicians. In all outcome analyses, only the first event within each category was considered. Participants free of events were censored at last follow-up.
Statistical analysisFor database management and statistical analysis, SAS software, version 9.4 (maintenance level 5; SAS Institute Inc., Cary, North Carolina, USA) was used. We reported the central tendency and spread of continuously distributed variables as mean and standard deviation (SD). Skewness and kurtosis were computed as the third and fourth moments about the mean divided by the cube of the SD. To compare means and proportions between groups, we applied the large sample z-test or ANOVA for continuously distributed variables, and Fisher exact test for categorical variables. Departure from normality was evaluated by the Shapiro–Wilk statistic. To assess longitudinal changes in continuously distributed and categorical variables, we used the t test and the McNemar test, respectively. After stratification for cohort and sex, we interpolated missing values of serum total and high-density lipoprotein (HDL) cholesterol, serum creatinine, blood glucose and the urinary sodium-to-potassium ratio from the regression slopes on age. In participants with unknown status of smoking or drinking and education attainment, we set the indicator (dummy) variable to the age-specific and sex-specific mean of the codes (0, 1). Statistical significance was a two-sided probability of 0.05.
In exploratory analyses, we assessed the incidence of endpoints by categories of BW (≤2500, >2500–4000 and >4000 g) and the baseline UVNA (<2.3, 2.3–4.6 and >4.6 g) [10] and UNAK (<1, 1–2 and >2). UNAK was categorized, using similar percentile cut-offs as for the distribution of UVNA (15th and 70th percentile ranks). The 95% of rates were computed as R ± 1.96 × √(R × [100 – R] / T), where R is the rate, and T is the number of participants at risk of developing an adverse outcome. Next, we plotted Kaplan–Meier survival function estimates for the endpoints under study. In Cox regression, we compared the risk in each category of BW, UVNA and UNAK with the average risk in the whole study population, using the deviation from mean coding [22]. This approach avoids to define an arbitrary reference group and generates confidence interval for all strata in the analysis [22]. All Cox models were accounted for clustering of the data within families as random effect. The covariables introduced as fixed effects in adjusted Cox models included recruitment frame (FLEMENGHO and EPOGH), sex, and the baseline variables age, mean arterial pressure, the serum total-to-HDL cholesterol ratio, blood glucose, educational attainment (elementary school vs. secondary and high education) and the glomerular filtration rate (GFR) estimated from serum creatinine. For analysis of the hypertension incidence, mean arterial pressure as baseline covariable was replaced by heart rate. In view of the small number of endpoints in some strata, covariables were combined by logistic regression in a propensity score, summarizing the probability of an endpoint as predicted by the covariables. The proportional hazards assumption was checked by the Kolmogorov-type supremum test. To evaluate the correlation between the changes in BP and the changes in UVNA from baseline to follow-up, multivariable linear regression was applied adjusting for the aforementioned covariables.
RESULTS Data availabilityAll available data are shown within the article and the online only Data Supplement, https://links.lww.com/HJH/C186. Anonymized data are available from the corresponding author upon request, providing that an analysis plan is accompanying the request and that the principal investigators of each cohort approved data sharing.
Baseline characteristics in the Outcome cohortThe number of missing values interpolated in the whole study population, which included 1332 FLEMENGHO and 613 EPOGH participants was four for serum total and HDL cholesterol and serum creatinine, two for blood glucose, and five for UNAK. Compared with FLEMENGHO (Table 1), EPOGH participants were 5.7 year younger (37.0 vs. 31.3 years; P < 0.001), had lower BMI (24.9 vs. 24.2 kg/m2; P = 0.0018) and serum total cholesterol (202.2 vs. 186.5 mg/dl; P < 0.0001) but higher DBP (75.2 vs. 77.5 mmHg; P < 0.0001), mean arterial pressure (90.7 vs. 92.3 mmHg; P = 0.0019), heart rate (68.3 vs. 73.7 beats per minute; P < 0.0001) and higher estimated GFR (eGFR) as estimated from serum creatinine (86.2 vs 96.7 ml/min/1.73 m2; P < 0.0001). Furthermore (Table 1), regarding the 24-h urinary measurements, volume (1.56 vs. 1.38 l; P < 0.0001), creatinine (1.38 vs. 1.05 g; P < 0.0001) and potassium (2.77 vs. 1.84 g; P < 0.0001) were higher in FLEMENGHO than EPOGH, whereas given similar UVNA (3.98 vs. 4.04 g; P = 0.40), UNAK was lower in FLEMENGHO than EPOGH (1.53 vs. 2.42; P < 0.0001). Sex differences were as reported in the literature (Table 1). The distributions of BW, UVNA and UNAK appear in Figure S2, https://links.lww.com/HJH/C186. The baseline characteristics of the Hypertension and Blood Pressure cohorts mirrored those of the Outcome cohort.
TABLE 1 - Baseline characteristics by cohort and by sex (starts) Cohort Sex Characteristic FLEMENGHO EPOGH Women Men Number in group 1332 613 1036 909 Number with characteristic [n (%)] FLEMENGHO 1332 (100%) 0 683 (65.9%) 649 (71.4%)† EPOGH 0 613 (100%) 353 (34.1%) 260 (28.6%)† Women 683 (51.3%) 353 (57.6%)† 1036 (100%) 0 Men 649 (48.7%) 260 (42.4%)† 0 909 (100%) Hypertension 221 (16.6%) 112 (18.3%)∗ 143 (13.8%) 190 (20.9%)‡ Treated hypertension 84 (6.3%) 25 (4.1%) 67 (6.5%) 42 (4.6%) Diabetes mellitus 17 (1.3%) 6 (1.0%) 15 (1.4%) 8 (0.9%) Smokers 356 (26.7%) 156 (25.6%) 240 (23.2%) 272 (30.0%)‡ Drinking 340 (25.5%) 198 (32.5%)† 160 (15.5%) 378 (41.7%)‡ Educational attainment Elementary school 81 (6.1%) 49 (8.0%) 75 (7.2%) 55 (6.1%) Secondary school 906 (68.0%) 409 (66.7%) 680 (65.6%) 635 (69.9%) Higher education 345 (25.9%) 155 (25.3%) 281 (27.1%) 219 (24.1%) Mean of characteristic Age (years) 37.0 ± 11.5 31.3 ± 11.7‡ 35.2 ± 11.6 35.2 ± 12.1 Birth weight (g) 3341 ± 580 3398 ± 573∗ 3275 ± 550 3454 ± 595‡ Body weight (kg) 72.7 ± 14.4 70.0 ± 14.3‡ 65.2 ± 12.8 79.4 ± 12.2‡ Body height (cm) 170.7 ± 9.2 169.8 ± 9.4∗ 164.2 ± 6.2 177.5 ± 6.7‡ BMI (kg/m2) 24.9 ± 4.1 24.2 ± 4.3† 24.2 ± 4.5 25.2 ± 3.6‡ Systolic pressure (mm Hg) 121.6 ± 13.3 121.9 ± 15.6 117.9 ± 14.1 126.0 ± 12.7‡ Diastolic pressure (mm Hg) 75.2 ± 9.9 77.5 ± 10.6‡ 74.2 ± 9.7 77.9 ± 10.3‡ Mean arterial pressure (mm Hg) 90.7 ± 10.0 92.3 ± 11.5† 88.8 ± 10.4 93.9 ± 9.9‡ Heart rate (beats per minute) 68.3 ± 9.2 73.7 ± 9.7‡ 71.8 ± 9.4 67.9 ± 9.6‡ Serum total cholesterol (mg/dl) 202.2 ± 40.6 186.5 ± 42.3‡ 195.9 ± 39.7 198.7 ± 43.9‡ Serum HDL cholesterol (mg/dl) 55.2 ± 15.6 51.9 ± 16.2‡ 59.5 ± 16.5 48.1 ± 12.7‡ Total-to-HDL cholesterol ratio 3.96 ± 1.54 3.93 ± 1.56 3.53 ± 1.22 4.43 ± 1.73‡ Blood glucose (mg/dl) 90.5 ± 20.4 85.5 ± 15.4‡ 88.8 ± 20.1 89.1 ± 17.9 Serum creatinine (mg/dl) 1.00 ± 0.16 0.92 ± 0.17‡ 0.89 ± 0.13 1.06 ± 0.15‡ eGFR (ml/min per 1.73 m2) 86.2 ± 15.3 96.7 ± 18.0‡ 86.8 ± 17.1 92.6 ± 16.2‡ 24-h urinary measurements Volume (l) 1.56 ± 0.69 1.38 ± 0.51‡ 1.51 ± 0.68 1.50 ± 0.61 Sodium (g) 3.98 ± 1.64 4.04 ± 1.48 3.61 ± 1.40 4.44 ± 1.68‡ Potassium (g) 2.77 ± 1.04 1.84 ± 0.73 ‡ 2.27 ± 0.89 2.72 ± 1.15‡ Sodium-to-potassium ratio 1.53 ± 0.68 2.42 ± 1.26‡ 1.78 ± 0.98 1.84 ± 1.00 Creatinine (g) 1.38 ± 0.44 1.05 ± 0.41‡ 1.05 ± 0.32 1.54 ± 0.45‡ Median follow-up IQR (years) 18.7 (15.4-22.5) 13.9 (13.1–14.4)‡ 16.6 (13.9–21.4) 16.6 (13.9–21.7)BMI was weight in kilograms divided by height in meters squared. BP was the average of five auscultatory readings. Hypertension was a BP of at least 140 mmHg systolic or at least 90 mmHg diastolic or being on antihypertensive treatment. Mean arterial pressure was diastolic pressure plus one-third of pulse pressure. Diabetes was a self-reported diagnosis, use of antidiabetic drugs, fasting blood glucose of at least 126 mg/dl (≥7.0 mmol/l), random blood glucose of at least 200 mg/dl (≥11.1 mmol/l), or diabetes documented in practice or hospital records. Smoking was the use of smoking materials on a daily basis. Drinking was an average alcohol intake of 5 g or more per day. SI conversion factors: to convert cholesterol from mg/dl to mmol/l, multiply by 0.0259; glucose from mg/dl to mmol/l, multiply by 0.0555, serum creatinine from mg/dl to μmol/l, multiply by 88.42; urinary sodium, potassium and creatinine from g to mmol, multiply by 43.497, 25.577, and 8.840, respectively. Significance of the between-group differences: ∗P ≤ 0.05; †P ≤ 0.01; ‡P ≤ 0.001. eGFR, glomerular filtration rate estimated from serum creatinine, using the Chronic Kidney Disease Epidemiology Collaboration equation; EPOGH, European Project on Genes in Hypertension; FLEMENGHO, Flemish Study on Environment, Genes and Health Outcomes; HDL, high-density lipoprotein; IQR, interquartile range.
The Outcome cohort included 185 singletons and 1760 related participants belonging to 169 single-generation families and 221 multigeneration pedigrees. Tables S2, S3 and S4, https://links.lww.com/HJH/C186, describe the trends of baseline characteristics across increasing categories of BW, UVNA and UNAK, respectively. A bar diagram shows the overlap of the categories of BW, UVNA and UNAK by cohort (Figure S3, https://links.lww.com/HJH/C186). Compared with the medium category, low BW (≤2500 g) was associated with a lower body height and eGFR (P ≤ 0.039). Compared with the high category, low BW (≤2500 g) was associated with a higher female-to-male sex ratio, lower body weight and body height (P < 0.0001). Fig. 2 illustrates tracking of BW with body weight during adult live; adult weight averaged 69.1 kg in the low-BW category and 77.7 kg in participants with high BW.
 FIGURE 2:
 Boxplots showing the distributions of birth weight (a) and adult body weight (b) at baseline in the low (≤2500 g; yellow), medium (>2500–4000 g; blue) and high (>4000 g; red) birth weight categories. The central line, the upper and lower lines, and the upper and lower caps represent the median, interquartile range, and the 5th–95th percentile interval. The arithmetic means and extreme measurements are represented by circles inside the box and outside the whiskers, respectively. The arithmetic means and standard deviations are given above/beneath the whiskers. The number of the participants in each category is given along the horizontal axis. Significance of the difference with the medium group: ‡P ≤ 0.001.
Low UVNA (< 2.3 g), compared with the medium and high UVNA categories combined, was associated with a higher female-to-male sex ratio, lower body weight, smaller body height, lower SBP, lower total-to-HDL-cholesterol ratio, potassium excretion, UNAK, and creatinine excretion (P ≤ 0.036; Table S3, https://links.lww.com/HJH/C186). Low UNAK (<1), compared with the medium UNAK category was associated with a higher female-to-male sex ratio and higher age (P ≤ 0.030); and compared with the high UNAK category was associated with a higher female-to-male sex ratio, higher age, lower heart rate, higher blood glucose, lower eGFR and higher urinary volume (P ≤ 0.010; Table S4, https://links.lww.com/HJH/C186).
Incidence of endpointsOf 1945 participants making up the Outcome cohort (Table S5, https://links.lww.com/HJH/C186), over a median follow-up of 16.6 years (IQR: 13.9–21.6 years; 5th–95th percentile interval: 11.3–32.1 years), 73 (3.8%) died and 120 (6.2%) experienced a major cardiovascular endpoint. Of 1460 participants enrolled in the Hypertension cohort, over a median follow-up of 16.8 years (IQR: 14.0–21.9 years; 5th–95th percentile interval: 12.1–32.6 years), 396 (27.1%) became hypertensive, because SBP was at least 140 mmHg (n = 106), or DBP was at least 90 mmHg (n = 149), or both SBP and DBP exceeded these thresholds (n = 120), or because at follow-up, they were on antihypertensive drug treatment irrespective of the BP level (n = 24).
Unadjusted analysesIn unadjusted survival function analyses of the Outcome cohort (Fig. 3 and Figure S4, https://links.lww.com/HJH/C186), participants with low or medium BW experienced lower mortality compared with the high-BW group (P = 0.004), whereas the incidence of a major cardiovascular endpoint was lower in the medium-BW group, compared with the low and high-BW groups (P = 0.006). The gradients in absolute risk across the categories of BW, UVNA and UNAK, expressed as incidence rates per 1000 person-years, are presented in Table S6, https://links.lww.com/HJH/C186, for women, men and both sexes combined. Among women, across increasing categories of BW, the incidence of total mortality and hypertension increased. In the low, medium and high-BW categories, the death rates were 2.82, 3.21 and 3.51 fatalities per 1000 person-years (P = 0.048), and the incidence rates of hypertension 18.9, 19.6 and 20.5 cases per 1000 person-years (P = 0.046). In women, the hypertension incidence rates tended to decrease across increasing categories of UVNA (24.6, 19.2 and 16.1 cases per 1000 person-years; P = 0.099) and increasing UNAK (22.8, 20.0 and 16.2 cases per 1000 person-years; P = 0.056). However, none of these trends reached significance in men (P ≥ 0.14). In both sexes combined, the hypertension incidence rates decreased with higher UNAK (30.7, 26.9 and 24.1 cases per 1000 person-years; P = 0.056).
 FIGURE 3:
 Kaplan–Meier survival function estimates for the incidence of total mortality, all cardiovascular endpoints and hypertension. The yellow, blue and red lines in panels a, b and c represent the low, medium and high categories of birth weight (≤2500, >2500–4000 and >4000 g). The yellow and red lines in panels d, e and f represent the low, medium and high categories of 24-h urinary sodium (<2.3, 2.3–4.6, >4.6 g per day. The results for all-cause mortality and all cardiovascular endpoints were obtained in the Outcome cohort, and the results for hypertension in the Hypertension cohort. P values indicate the significance of log-rank test.
Proportional hazards regressionUsing the deviation from mean coding, hazard ratios expressed the risk compared with the average risk in the BW, UVNA and UNAK categories. The unadjusted hazard ratios expressing the risk of death, a major cardiovascular endpoint or incident hypertension in relation to BW (Table S7, https://links.lww.com/HJH/C186), UVNA (Table S7, https://links.lww.com/HJH/C186) or UNAK (Table S8, https://links.lww.com/HJH/C186) were mostly not significant. However, in the medium-BW group (Tables S7 and S8, https://links.lww.com/HJH/C186), the crude hazard ratios were 0.66 (95% CI 0.45–0.97; P = 0.035) for mortality and 0.68 (95% CI 0.51–0.90; P = 0.0082) for the cardiovascular endpoint. In the high-BW group, the crude hazard ratio for a cardiovascular endpoint was 1.67 (95% CI 1.06–2.61; P = 0.027). However, adjustment removed the significance of these hazard ratios
Relation between changes in blood pressure and urinary sodium excretionIn the Blood Pressure cohort, the association of the changes from baseline to follow-up in SBP (Fig. 4) or DBP (Figure S5, https://links.lww.com/HJH/C186) complied with a linear model. With adjustments applied for recruitment frame (FLEMENGHO vs. EPOGH), sex, and the baseline variables age, heart rate, the serum total-to-HDL cholesterol ratio, blood glucose, educational attainment (elementary school vs secondary and high education) and the GFR estimated from serum creatinine, the partial correlation coefficient in the low-BW group associating the change in SBP with the change in UVNA was 0.68 (P = 0.023); the corresponding correlation coefficients in the medium and high-BW categories were 0.32 (P = 0.69), and −0.45 (P = 0.20), respectively. In a sensitivity analysis, in which changes in SBP and UVNA were expressed as a percentage of the baseline value, the correlation coefficients in the low, medium and high-BW categories were 0.55 (P = 0.15), 0.30 (P = 0.97) and -0.33 (P = 0.27), respectively. In similar analyses, correlating the changes in DBP with the changes in UVNA, none of the partial correlation coefficients reached significance.
 FIGURE 4: Relation between the changes from baseline to follow-up in SBP and the changes in 24-h urinary sodium excretion in the low-birth-weight (a), medium-birth-weight (b) and (c) high-birth-weight categories (≤2500, >2500–4000, >4000 g). n and r refer to the number of participants in each group and to the partial correlation coefficients with adjustments applied for recruitment (FLEMENGHO vs. EPOGH), sex, and the baseline variables age, heart rate, the serum total-to-HDL cholesterol ratio, blood glucose, educational attainment (elementary school vs. secondary and high education) and the glomerular filtration rate estimated from serum creatinine. To illustrate the fit of the linear model, the average changes in SBP and in 24-h urinary sodium were computed by quantiles and plotted over the regression lines given with 95% confidence interval. Categories were defined by the median, quintiles and tertiles in the low-birth-weight, medium-birth-weight and high-birth-weight groups, respectively. The results were obtained in the Blood Pressure cohort (see Fig. 1).DISCUSSION
The goal of the current study was to explore in an individual-participant meta-analysis of two family-based European population studies, whether the risk of incident hypertension, death or a composite cardiovascular endpoint were modified by BW. In unadjusted survival function analyses (Fig. 3 and Figure S4, https://links.lww.com/HJH/C186), participants with low or medium BW experienced lower mortality compared with the high-BW group, whereas the incidence of a major cardiovascular endpoint was lower in the medium-BW group, compared with the low and high birth-BW groups. However, absolute risk as captured by the incidence rates of these events and adjusted relative risk as captured by hazard ratios were not significant across the categories of BW, UVNA and UNAK. However, the study generated two relevant observations, one confirmatory and one, to our knowledge, novel. In line with the literature [23–25], adult body weight tracked with BW (Fig. 2). Second, in multivariable-adjusted analyses of the low-BW group, there was a positive association between the changes from baseline to follow-up in UVNA and the corresponding changes in SBP (Fig. 4).
Prematurity as captured by low BW disrupts the perinatal maturation of the microcirculation and impairs arterial structure/function later in life, as exemplified by the narrower retinal arteriolar diameters and sparser retinal fractals in extremely low-BW children and young adults compared with controls born at term [26]. Other adverse health outcomes associated with low BW are hypertension [9] and high cardiovascular disease risk in young adulthood [23–25]. In a systematic review [27], the pooled hazard ratios expressing the risk per 1000 g BW decrements were 1.06 (95% CI 1.03–1.09) for total mortality (36 834 deaths among 394 062 participants followed up) and 1.14 (95% CI 1.10–1.18) for fatal cardiovascular events (11 366 deaths per 325 982 participants). Furthermore, exposure to cardiovascular risk factors in childhood promotes the development of vascular changes that launch young adults towards a trajectory of premature vascular aging. In the Young Finns Study [28], risk factor load at age 3–18 years predicted carotid intima–media thickening, higher aortic pulse wave velocity, hypertension and loss of carotid distensibility on re-examination 21 years later. Confirmatory findings were reported in other birth cohorts [23–25,27–29]. Tracking of adult body weight with BW as observed in the current study (Fig. 2) is in keeping with the literature [23–25].
Brenner was the first to offer a possible explanation for the inverse association between blood pressure and BW [30]. According to his hypothesis, hypertension supervenes when the number of nephrons decreases either by acquired disease during adult life, unilateral nephrectomy, for instance, for allograft transplantation, or impaired nephron development during intra-uterine life. Two studies investigated postnatal glomerulogenesis either in premature infants weighing less than 1000 g [31] or after preterm birth with a gestational age of less than 35 weeks [32]. In 56 extremely low-BW infants and 10 full-term controls, glomerulogenesis, as measured by computer-assisted radial glomerular counts was markedly decreased in all preterm infants and correlated significantly with gestational age (r = 0.87; P < 0.001) [31]. Active glomerulogenesis was absent in preterm infants surviving for 40 days or longer and in all term infants [31]. In the second study [32], renal maturation accelerated in 22 infants after preterm birth, with an increased number of glomerular generations and a decreased width of the nephrogenic zone in kidneys of preterm neonates. According to Guyton's model [33], a smaller number of nephrons necessitates a higher blood pressure to excrete sodium. Our current findings as shown in Fig. 4 are in line with the concept that low BW is associated with fewer functional nephrons, thereby increasing their susceptibility to sodium-driven hypertension.
LimitationsThis current study must be interpreted within the context of its limitations. First, although the Outcome cohort and the Hypertension cohort, included 1945 and 1460 participants, respectively, the present sample size was substantially smaller than in the aforementioned meta-analysis with over 325 000 study participants [27]. Lack of power probably explain why the trends in absolute and adjusted relative risk associated with BW, UVNA and UNAK did not reach significance. Second, BW was collected by self-administered question instead of birth certificates. In major epidemiological studies, such as the Nurses’ Health Study [34] and the Health Professionals Follow-Up Study [35], BW was collected by questionnaire, telephone interviews [36] or self
Comments (0)