
Remember me
The use of electroencephalogram (EEG) to gain insight into cognitive and metacognitive processing during task execution is being pioneered in natural learning contexts; an opportunity not without its challenges. Accordingly, a pilot study was conducted to explore the feasibility of this approach. The aims of this study were: (1) to demonstrate how raw data extracted from an EEG device may be processed; (2) to determine whether there were differences in pre-task cognitive load between senior university students (Group 1), novice university teachers (Group 2) and experienced university teachers (Group 3); (3) To determine whether the peak power (μV2) per brain band (Delta, Theta, Alpha, Beta and Gamma) recorded during task performance was different depending on the type of participant; (4) To determine whether there were un-labelled groupings (clusters), and whether they corresponded to the type of participant. The raw data were processed using the MNE-Python toolkit. No significant differences were found in the perception of cognitive load or in peak power with respect to participant type. However, different frequencies of maximum activation of brain channels in the Delta wave were found by participant type. The largest overlaps were found between Group 1 and Group 2. Future studies will address the influence of other variables such as age, gender, type of studies and cranial tomography. In addition, 3D analyses with integration of brain surfaces and sensors will be applied.
1 IntroductionOne of the primary aims of education is to develop learners’ thinking skills—particularly creative thinking skills—that enable them to address future personal and professional challenges. Information processing during learning involves multiple cognitive and metacognitive processes, such as attention, working memory, and the application of cognitive and metacognitive strategies (Sáiz-Manzanares et al., 2023). These processes are influenced by both internal and external factors, implying that access to information may be facilitated or inhibited by emotional components (Schunk and DiBenedetto, 2020).
Technological advances now allow these processes, together with associated emotional responses, to be recorded through various devices, including eye-tracking systems, galvanic skin response (GSR) sensors, and electroencephalography (EEG) (Sáiz-Manzanares et al., 2024). In educational settings, EEG provides insights into cognitive and metacognitive processes during task execution. Nevertheless, employing EEG data to characterize learning processes remains a challenge that offers significant opportunities but also presents methodological and interpretive difficulties.
The main opportunities lie in the objective, empirical measurement of information processing during learning (Sáez-García et al., 2024). For instance, EEG can quantify the cognitive load imposed by a given task (Sáiz-Manzanares et al., 2024). Such information may be used to determine the most efficient processing strategies across tasks or to optimize task presentation according to individual learners’ processing profiles. These advances represent a significant contribution to neuroscience, cognitive science, and instructional psychology, as the results enable more personalized learning approaches (Beauchemin et al., 2024; Dan and Reiner, 2017; Sarailoo et al., 2022). From a neurotechnological perspective, EEG can also support neurofeedback applications (Kopańska et al., 2022; Kopańska et al., 2023; Kopańska et al., 2024), fostering improvements in cognitive and metacognitive strategies and ultimately enhancing learning outcomes (Jamil et al., 2021).
Although early EEG systems were considered invasive, modern devices are less intrusive and designed for use in naturalistic contexts (Rivas et al., 2025). Depending on the model, EEG signals are recorded through electrodes that may be dry or semidry. Dry electrodes are simpler to use and often embedded in lightweight hardware, such as headbands or adhesive strips. Despite these improvements, data analysis and interpretation remain major challenges. Raw EEG signals require pre-processing and subsequent processing steps (Bigdely-Shamlo et al., 2015; Pion-Tonachini et al., 2019).
EEG data report the intensity of neural activity, i.e., the electrical activity generated by groups of neurons synchronized under each electrode, measured in microvolts (μV). These data can also be transformed from the time domain into the frequency domain (cycles per second of brain activity), providing information about the activation of distinct brain rhythms (Delta, Theta, Alpha, Beta, and Gamma). Interpreting these metrics yields information on signal amplitude (μV), signal power or energy (μV2), and spectral power, which describes the distribution of power across frequency bands. This indicates the energy associated with each frequency range during task-related processing. A summary of the metrics, their units of measurement, and their interpretation is provided in Table 1.
ConceptUnitMeaningAmplitudeμVSignal voltage magnitude (signal size)PowerμV2Signal-related energyExchange rateμV/sFast voltage changeoverMetrics, units of measurement and meaning.
This represents an important milestone in the field of cognitive and instructional psychology. Information regarding the activation of different brain areas makes it easier to understand the type of processing being applied, depending on both the task and the learner profile (Fink et al., 2009). Supplementary Table S1 presents the relationship between brain area signal recordings and their implications for information processing analysis (consulted in Supplementary Table S1). These signals are interpreted using the international 10–20 system, a standardized method for positioning and labeling electrodes in electroencephalography (EEG), which defines their placement on the scalp for consistent measurement and analysis.
As mentioned above, from the signal recorded in microvolts (μV), its frequency can be obtained in hertz (Hz), which provides information about the wavelength during execution of a task. It can also provide information about a learner’s level of activation during a task (see Table 2 for the relationship between brainwaves, their interpretation, cognitive state, and their role in processing visual stimuli).
Brain wavesInterpretationCognitive statusRole in processing visual stimuli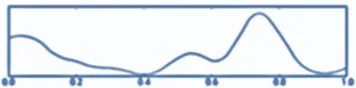
 Alpha waves (α)Alpha (α) waves are electromagnetic oscillations in the frequency range 8 Hz-13 Hz that arise from synchronous, coherent electrical activity. They originate mainly in the occipital lobe during periods of relaxation, with the eyes closed, but still in the waking state.State of relaxation with eyes closed.
 Beta (β) wavesBeta (β) waves are electromagnetic oscillations in the second highest frequency range 13–30 Hz.It is associated with:
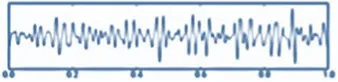 Gamma (γ) waves are a neuronal oscillation pattern that occurs in humans, ranging in frequency from 30 Hz-100 Hz, although the most common presentation is 40 Hz.Sensory integration: help to unify visual information from different parts of the visual field (e.g., shape, color, movement).
Relationship between brainwaves, their meaning, cognitive state and interpretation of visual stimuli.
EEG interfaces can also facilitate objective monitoring of individuals’ cognitive states, such as cognitive load (Spüler et al., 2016). Current EEG interfaces focus mainly on the spectral aspects of EEG, i.e., the type of neural oscillations, or “brain waves,” that can be observed in EEG signals (Niedermeyer and da Silva, 2004). The challenge is to develop techniques that allow real-time processing and interpretation of the data to gain insight into the learner’s cognitive state (Spüler et al., 2016). For example, according to cognitive load theory (Sweller et al., 1998), increasing task difficulty should increase cognitive load and thus brain activity in frontal (domain-general structures) and parietal (domain-specific structures) areas. This means that an increase in cognitive load should result in an increase in EEG power in the Theta band and a decrease in the Alpha band (Pesonen et al., 2007). The Theta and Alpha bands have been found to be the most predictive of cognitive load (Spüler et al., 2016). For example, when looking at facial expressions, the facial fusiform area is involved in processing these stimuli (Mourão-Miranda et al., 2005). In particular, time-averaged and time-synchronized measurement distances after visual stimuli give rise to different components of the power curve (Metzen et al., 2025). Recent studies using EEG devices have found that the measurement and assessment of the learning process with respect to students’ cognitive states is closely related to oscillatory activity in the theta and alpha frequency bands (Li et al., 2017; Nguyen et al., 2020). Theta wave activity has been consistently identified as a robust predictor of changes in cognitive demands, particularly reflecting frontal lobe engagement during executive control, attention allocation, and working memory processes (Grunwald et al., 2014; Roux and Uhlhaas, 2014). Complementarily, alpha-band activity has been associated with attentional modulation and information processing efficiency, with alpha desynchronization typically reflecting increased task engagement, whereas alpha synchronization has been linked to internally oriented processing and creative cognition (Fink et al., 2009). Beyond task-related cognitive demands, recent EEG research indicates that theta and alpha oscillations are also sensitive to the emotional content of visual stimuli, including the perception of emotionally salient images. Emotional processing has been shown to elicit increased theta activity, reflecting integrative and evaluative processes, alongside alpha desynchronization, particularly in posterior and frontal regions, indicating enhanced attentional allocation to emotionally relevant information. These findings suggest that cognitive load and emotional processing are dynamically intertwined and jointly modulate theta–alpha activity during complex learning tasks. Overall, the use of EEG devices provides valuable insights into learners’ diverse cognitive strategies and mental states when engaging with different tasks. However, task performance and neural responses are also influenced by individual characteristics such as age, gender, educational background, and professional experience (Sweller, 2024). Moreover, cognitive, behavioral, affective, and environmental factors, as well as methodological aspects including task design and EEG device characteristics, can significantly impact the interpretation of neural markers of learning and cognitive load (Jamil et al., 2021; Sweller, 2024).
In addition, Machine Learning techniques must be applied to analyze EEG recordings, such as supervised classification techniques to differentiate between different levels of task difficulty. Supervised prediction techniques can also be used (Rivas et al., 2025) (allowing identification of the most significant cognitive demands during task resolution, for example, the oscillations in the Theta and Alpha bands recorded in the parietal electrodes reflect greater difficulty experienced by the learner doing the task) (Spüler et al., 2016). Unsupervised Machine Learning techniques such as clustering may also be applied to EEG signal analysis. This approach is particularly useful, as it allows discovery of hidden patterns and latent structures in brain data (Xiong et al., 2020). For example, it has been used to study EEG data on emotion recognition (Bengalur et al., 2023; Zhang et al., 2023). Similarly, Othman et al. (2021) applied the k-Means algorithm to analyze features of EEG signals to detect situational interest in learning environments, demonstrating the applicability of clustering in educational contexts.
1.1 Challenges in EEG signal processingAs indicated initially, this technology does present significant challenges. Measuring students’ attention during the learning process is still a complex task, but objective resources such as EEG offer more accurate and, more importantly, non-subjective measurements than those provided by off-line methods (self-reports, questionnaires), as the subject’s perception always has a high degree of subjectivity (Veenman et al., 2014). However, signal processing is complex and therefore a major challenge when it comes to using these devices. This is because the data are usually obtained in a raw form, i.e., unprocessed, and to draw accurate conclusions the data have to be first pre-processed (cleaned and sorted) and then processed (treated computationally). The EEG signal is collected in μV, i.e., voltage over time, then a sampling frequency is applied (which in this study was 256 Hz), then the signal must be filtered and cleaned in order to remove non-neural artefacts (in this study it was at 40 Hz), then the artefacts of eye movement, blinks, etc. are removed [e.g., Principal Component Analysis (PCA) and Independent Component Analysis (ICA)]. Subsequently, a spectral analysis (transformation from the time domain to the frequency domain) is performed by applying the Fourier Transform (FFT) or a Wavelet Transform. In this study we applied FFT (see formula).
is equal to the Fourier transform.
is the signal in time.
i is the imaginary unit.
is the angular frequency.
dt infinitesimal increment of the variable ? (derivative of t).
Reducing dimensionality and scaling of EEG features is also essential for efficient analysis. This is typically achieved using Principal Component Analysis (PCA), which identifies orthogonal directions in the data that maximize variance, thereby simplifying the dataset, and Independent Component Analysis (ICA), which isolates statistically independent components rather than merely correlated ones. Applying these methods helps produce cleaner and more representative EEG data.
Accuracy is a critical goal throughout this process (Rehman et al., 2025). Several multi-platform tools support EEG processing, including EEGLAB and MNE. EEGLAB, developed at the University of California, San Diego, is an interactive MATLAB-based environment widely used in cognitive neuroscience and neuroengineering (Delorme and Makeig, 2004). It supports multiple data formats and enables pre-processing tasks such as bandpass filtering, artefact correction, bad channel interpolation, epoch segmentation, event rejection, and time-frequency analysis, with 2D and 3D visualizations of power spectra. MNE is an open-source Python library for MEG and EEG data processing, analysis, and visualization (Gramfort et al., 2014). It allows import of various data formats, supports raw, epoch, and averaged data, and provides functions for filtering, artefact removal, epoch manipulation, averaging, time-frequency and power/phase analysis, as well as 3D visualization integrating brain surfaces and sensors. Despite their popularity and functionality, both EEGLAB and MNE require programming skills for effective use.
1.2 Interpretation of EEG metricsAs discussed above, EEG devices record signals that generate various metrics. Raw data are measured in microvolts (μV), reflecting the instantaneous amplitude of the electrical signal. For instance, the P300 waveform may have an amplitude of 8 μV, providing information about signal strength at a specific moment. This measure is useful for analyzing peaks, latencies, and waveforms (Martinez-Cagigal et al., 2017). Another important metric is μV2, which quantifies the power or energy of the signal over time. Power metrics are typically derived using spectral analysis (e.g., Fourier or Wavelet transforms) and are applied in comparisons across conditions (such as pre- and post-stimulus) or as indicators of brain and muscle activation. These metrics are obtained after appropriate filtering and processing of the data. Recent studies, however, have questioned the rigid assignment of specific brain functions to electrode localization within the international 10–20 EEG system. Scrivener and Reader (2022) reported substantial inter-subject variability in electrode positioning and anatomical correspondence, which may challenge strictly localized interpretations of brain activity. Similarly, Ignatiadis et al. (2022) showed that both individual anatomy and electrode placement significantly influence source localization accuracy in the primary auditory cortex, highlighting the need to account for individual differences in EEG analyses. Advanced methodologies for three-dimensional and automated electrode localization, as described by Taberna et al. (2019) and Bhutada et al. (2020), further underscore the importance of precision when attributing functions to specific brain regions. Additionally, Opitz et al. (2021) demonstrated that individual anatomical variability affects the efficacy of stimulation techniques such as transcranial Direct Current Stimulation (tDCS), while Chella et al. (2016) highlighted that reference choice significantly impacts EEG connectivity patterns. Collectively, these findings suggest that brain functions cannot be universally assigned to specific electrode locations, indicating the need for more dynamic and individualized approaches in contemporary neuroscience research.
1.3 Objectives and research questionsIn light of the above, the overall objective of this study is to examine how EEG data can be applied, processed, and interpreted within a higher education context in order to provide insights into students’ performance during the execution of an avatar visualization task representing different emotional states.
Specifically, the study aims to: (i) analyze perceived cognitive workload among three participant groups—final-year undergraduate students, junior university lecturers, and senior university lecturers—while considering the effects of age group and gender; (ii) examine whether the power or energy of the electrical signal (μV2) across different brainwave frequency bands (Delta, Theta, Alpha, Beta, and Gamma) recorded during task performance varies according to participant type, age group, and gender; and (iii) explore whether unlabeled clusters derived from EEG and cognitive workload measures correspond to participant type.
Based on these objectives, four research questions were formulated to illustrate how EEG, together with appropriate raw data processing and analytical methods, can inform researchers and educational practitioners about cognitive and affective processes in higher education learning contexts.
RQ1: To determine whether perceived cognitive workload (NASA-TLX subscales) differs between participant types (final-year students, adjunct lecturers, and full professors), controlling for age group and gender.
RQ2: To determine whether EEG power across frequency bands (Delta, Theta, Alpha, Beta, Gamma) differs between participant types, controlling for age group and gender.
RQ3: To determine whether unsupervised clusters derived from perceived cognitive workload and mean EEG power across frequency bands correspond to participant type.
RQ4: To determine whether differences exist in the maximum EEG power recorded at specific scalp sensors (AF7, FP1, FP2, AF8, F3, F4, P3, P4, PO7, O1, O2, PO8) according to participant type, based on qualitative frequency analysis.
2 Methods2.1 ParticipantsWe worked with a convenience sample of 22 participants in 3 groups: Group 1: students in the final year of their undergraduate degree (final-year students) (n = 11), average age range: 20–30 years, 9.1% men and 90.9% women; Group 2: university teachers with less than 4 years of experience (junior lecturers) (n = 6), average age range: 20–30 years, 100% women; and Group 3: university teachers with more than 15 years of professional experience (senior lecturers) (n = 5), average age range: 42–52 years, 40% men and 60% women. All participation was informed, voluntary and without compensation.
2.2 Instruments2.2.1 Images representing emotionsThe study used five images, developed ad hoc, of different freely accessible emotions (Sáiz-Manzanares, 2024). These images depicted an avatar representing different emotions. The aim was to check whether there were different cognitive reactions to the different avatars and to check whether these differed depending on the type of user (students in the final year of their undergraduate degree, junior lecturers, senior lecturers). These results will be used in the future design of educational agents to support learning.
2.2.2 NASA-TLX (Task Load Index)The NASA-TLX is a subjective assessment instrument that measures the workload perceived by a person when performing a task (Hart and Staveland, 1988). NASA-TLX assesses 6 dimensions: Mental Load (mental and perceptual effort required); Physical Load (physical effort required); Time Load (time pressure or urgency to complete the task); Performance (subjective evaluation of success in performing the task); Effort (total amount of physical and mental work required) and Frustration Level (feelings of insecurity, stress or irritation). Each dimension is scored on a scale from 0 to 100. The scale can be applied in a weighted or unweighted version. In the weighted version, each participant compares each pair of dimensions (15 in total) and chooses which of the two is considered the most relevant workload for that task, the value obtained being the weighting value. Next, the participant rates each of the 6 dimensions on a scale of 0–100. The value obtained is then multiplied by the weighting value.
In the unweighted application only, the simple average is applied and the paired comparisons step is omitted.
The NASA Task Load Index (NASA-TLX) is a widely used subjective instrument for assessing perceived workload, encompassing dimensions such as mental demand, effort, frustration, and temporal demand (Hart and Staveland, 1988). Although originally developed for complex control and operational tasks, its applicability has been extended to perceptual, visual, and emotional tasks, in which participants must process stimuli, maintain sustained attention, and make rapid decisions (Recarte et al., 2008; Brouwer et al., 2012).
In the present study, participants viewed images representing different emotions, which entails perceptual processing, emotional categorization, and potential affective regulation, all of which consume limited cognitive resources (Pessoa, 2008, 2009; Schupp et al., 2006). The perceived cognitive workload is complemented by objective neurophysiological measures obtained via EEG, which have been shown to correlate with subjective NASA-TLX scores in tasks involving attention and visual processing (Berka et al., 2007; Galy et al., 2012).
Therefore, the NASA-TLX is an appropriate tool for capturing the subjective experience of cognitive workload in emotional processing tasks, allowing for a comprehensive analysis combining subjective and objective indicators.
2.2.3 HeadsetDry-sensor EEG optimized to monitor emotional and cognitive states in real-world applications (Bitbrain, 2025, Zaragoza, Spain). It is lightweight (190 g) and flexible, allowing it to adapt to the morphology of each head (85% of the global population). It has 12 dry sensors and a design that reduces impedances and ensures stable contacts, along with active shielding to maximize SNR. It also has a small, lightweight (125 g) mobile amplifier that records with 24-bit resolution at 256 Hz. It has an internal IMU (9 DOF), and online relative impedance control. It can record to microSD or over Bluetooth at a range of over 10 m, and provides up to 8 h of continuous recording. It comes with a software package and SDK for programmers, and is compatible with Matlab, Python, etc. The device is shown in Figure 1.

(a) Bitbrain headband. (b) Arrangement of the 12 electrodes.
The Bitbrain EEG headset provides objective neurophysiological measures of cognitive workload by recording electrical brain activity associated with attention, working memory, and information processing. Cognitive workload has been shown to modulate specific EEG markers, such as theta and alpha band power, event-related potentials (ERPs), and frontal–parietal activation patterns (Berka et al., 2007; Gevins and Smith, 2003; Klimesch, 2009).
In the present study, participants performed an emotional image visualization task, which, despite not being analytically complex, engages perceptual processing, attentional control, emotional categorization, and potential affective regulation. These processes consume limited cognitive resources, which are detectable in EEG recordings. The Bitbrain headset has been validated in research settings for capturing these neural signatures of workload, showing reliable correlation with both task demands and subjective measures of mental effort (Brouwer et al., 2012; Galy et al., 2012).
2.3 ProcedureThe procedure followed for the study is described below:
Step 1. Approval for the study was obtained from the Bioethics Commission of the University of Burgos (No. IO 5/2024).
Step 2. Written informed consent was obtained from all participants.
Step 3. First, the NASA-TLX scale was applied in its weighted form.
Step 4. The experimental phase was carried out using the Bitbrain headband EEG device. This phase consisted of presenting the subjects with five images representing different emotions. Each image was displayed for 6 s, and between each image, a rest stimulus (lasting 5 s) and a white cross on a black background (lasting 3 s) were shown. An example is shown in Figure 2.

(a) Image display. (b) Rest stimulus between image displays.
Step 5. Pre-processing to remove artefacts and noise. This was done using the Python programming language, and a notebook was created in Jupyter where the following steps were executed:
Step 5.1. The following libraries and modules were imported: pandas (Python library specializing in data analysis); NumPy (Python library specializing in numerical computation for data analysis); matplotlib (Python data visualization library); SciPy (mathematics, science and engineering library built on top of NumPy); MNE (Minimum Norm Estimation), an open source Python module for processing, analyzing and visualizing functional neuroimaging data (EEG, MEG, ECoG, and fNIRS).
Step 5.2. Definition of electrodes and frequency bands [“Delta”: (1, 4), “Theta”: (4, 8), “Alpha”: (8, 12), “Beta”: (12, 30), “Gamma”: (>30)] to define the wavelength range per band, Webster’s classification (Webster, 2020) was applied using Bitbrain’s recommended band-pass filter from 1 to 40 Hz.
Step 5.4. Initial configuration:
Independent Component Analysis (ICA)
After artifact removal
Step 7.Time acquisition for each image:
Step 8.Frequency processing:
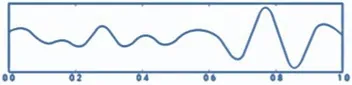
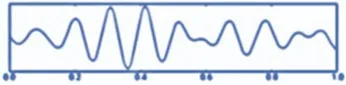
Step 10. Visualization (see Figure 3):
Visualizations produced.
EEG raw chart.
Topographical maps.
Descriptive graphs.
Power per band.

Cerebral tomography representation.
Step 11. Statistical data
Step 12. Save results:
In sum, EEG activity was recorded using a 12-channel dry-sensor Bitbrain headset (Bitbrain, Zaragoza, Spain) optimized for monitoring cognitive and emotional states. The device records at 256 Hz with 24-bit resolution, employs active shielding to maximize signal-to-noise ratio (SNR), and uses online relative impedance control. Participants wore the headset while viewing emotional images, each presented for 6 s with interspersed rest periods.
Raw EEG data were preprocessed using MNE-Python v1.5.1. A zero-phase FIR band-pass filter (1–100 Hz, Hann window, 53 dB stopband) was first applied to remove slow drifts and high-frequency noise, followed by average referencing across channels. Independent Component Analysis (ICA) using the fastica algorithm was applied to remove ocular and muscular artefacts, with an average of 3.2 ± 0.9 components removed per participant and no channels rejected. Residual noisy segments were excluded, resulting in 7.5 ± 3.2% of data rejection. After preprocessing, the cleaned EEG signals exhibited an average standard deviation of 4.3 μV across channels, indicating low-noise and stable recordings. A second FIR band-pass filter (1–45 Hz) was applied post-ICA to finalize the signal for analysis.
EEG epochs were defined relative to each stimulus, spanning from −0.2 to +1.0 s, with the first 50 ms excluded to remove transient artefacts associated with stimulus onset. Stimulus timestamps were converted from the recorded absolute timestamps to sample indices based on the EEG sampling frequency. Across participants, this procedure resulted in 9 usable epochs per subject. Baseline activity was controlled using a pre-stimulus interval from −2 to 0 s.
Also, frequency analysis was performed for each epoch using Welch’s method with 512-sample windows, 50% overlap, and a Hann window. Power spectral density (PSD) was averaged for canonical frequency bands: Delta (1–4 Hz), Theta (4–8 Hz), Alpha (8–12 Hz), Beta (12–30 Hz), and Gamma (>30 Hz), and normalized relative to the pre-stimulus baseline using percentage change to ensure that spectral measures reflected stimulus-induced activity. These frequency-domain measures provided objective indicators of cognitive workload, complementing subjective assessments from the NASA-TLX questionnaire (Berka et al., 2007; Brouwer et al., 2012; Galy et al., 2012).
All steps were required in order for the analysis of the datasets (Md Nor et al., 2022). The procedure is summarized in Figure 4.

Raw data processing with minimum norm estimation (MNE).
2.4 Design and data analysisThe study employed a cross-sectional, descriptive–correlational design (Campbell and Stanley, 2005). Research questions RQ1 and RQ2 were addressed using a quantitative approach, RQ3 was addressed using a computational-exploratory clustering approach, and RQ4 was addressed using a comparative frequency-based approach.
Prior to interpreting the results of the MANOVA, the multivariate assumptions of homogeneity and normality were considered. Rather than testing normality for each dependent variable individually, the value of Pillai’s Trace was used to assess the overall multivariate effect. Pillai’s Trace is robust to moderate violations of multivariate normality and provides a global indication of whether the combination of dependent variables is significantly influenced by the independent factors. Only when Pillai’s Trace indicated a significant multivariate effect were follow-up univariate analyses conducted.
To address RQ1, perceived cognitive workload was analyzed using a three-factor between-subjects multivariate analysis of variance (MANOVA), with the NASA-TLX subscales entered as dependent variables and participant type, age group, and gender specified as fixed factors. Given the relatively small sample size, Pillai’s Trace was used to assess multivariate effects due to its robustness to violations of multivariate normality. When significant multivariate effects were observed, follow-up univariate analyses were conducted for each NASA-TLX subscale, with Bonferroni-adjusted post-hoc comparisons applied where appropriate. Effect sizes (partial eta squared, ηp2) were reported only for the univariate analyses.
For RQ2, EEG power (μV2) in the Delta, Theta, Alpha, Beta, and Gamma bands was analyzed using a multivariate general linear model (MANOVA), with participant type specified as the main fixed factor, and age group and gender included as additional fixed factors. A multivariate approach was adopted due to the continuous and correlated nature of the EEG frequency bands. Multivariate effects were assessed using Pillai’s Trace, and when significant, follow-up univariate analyses with Bonferroni-adjusted post-hoc comparisons were conducted. Effect sizes (partial eta squared, ηp2) were reported only for the univariate analyses. Effect sizes were interpreted according to Cohen (1988), whereby partial eta squared values (ηp2) of 0.01 ≤ ηp2 < 0.06 were considered small, 0.06 ≤ ηp2 < 0.14 moderate, and ηp2 ≥ 0.14 large.
To address RQ3, an unsupervised k-means clustering analysis was performed using perceived cognitive workload and mean EEG power across Delta, Theta, Alpha, Beta, and Gamma bands as variables. The optimal number of clusters (k) was determined using the elbow method. Subsequently, the correspondence between the resulting clusters and participant type was evaluated using contingency tables and chi-square tests, complemented by measures of association.
RQ4 was analyzed using frequency-based methods, including contingency tables and the contingency coefficient, to examine differences in maximum EEG power recorded at scalp sensors (AF7, FP1, FP2, AF8, F3, F4, P3, P4, PO7, O1, O2, PO8) according to participant type. Age group and gender were not included, as doing so would extend the scope of the study beyond its primary objectives and substantially increase the number of comparisons.
A summary of the relationship between the research questions (RQs) and data processing can be found in Table 3.
Quantitative studyContrast testsData analysis softwareRQ1Three-factor between-subjects MANOVA with fixed effects (participant type, age group, gender); partial eta squared (ηp2) reported for univariate analysesStatistical package SPSS v.31 (IBM Corp, 2016)RQ2MANOVA with participant type as fixed factor, controlling for age group and gender; partial eta squared (ηp2) reported for univariate analysesStatistical package SPSS v.31 (IBM Corp, 2016)RQ3k-means cluster analysis; optimal number of clusters determined using the elbow method; cluster-participant group correspondence assessed with contingency tablesPython library (McKinney, 2010)
Comments (0)