
Remember me
This HIPAA-compliant retrospective multicenter cohort study was approved by the institutional review board at Massachusetts General Hospital, and the need for written informed consent was waived.
DatasetsSix independent, non-overlapping datasets consisting of full volumetric CT scans of the HN, chest, and AP from five institutions and 3126 patients were used. Images were acquired between 1996 and 2023 on 68 different scanner models from six different manufacturers (Table S1). Prior studies have reported on 958 patients included in the current study [20, 21].
Datasets I (n = 558) and IV (n = 598) consisted of different, independent HN CT scans from 1151 patients made available through The Cancer Imaging Archive [22, 23] with ground truth contrast labels curated by Ye et al. [24]. Datasets II (n = 601) and V (n = 400) consisted of chest CT scans [21] from 994 patients, while datasets III (n = 631) and VI (n = 350) consisted of CT scans of the AP from 981 patients. Two trained research assistants (LM, JAW) and a radiologist with four years of experience (RAB) established ground truth of body part classification and intravenous contrast presence in datasets II, III, V, and VI. Ground truth of datasets I and IV was provided with the datasets and was manually reviewed by residency-trained radiologists. A multi-body part dataset (n = 1020), dataset VII, was created by randomly sampling 170 series with and 170 series without intravenous contrast from datasets I, II, and III.
Datasets I, II, III, and VII were used for training, internal validation, and internal testing (Fig. S1). Each dataset was split 80:20 to produce a development and an internal testing subset. Datasets IV, VI, and VI were used for external testing of the final models (Fig. S2). If a patient contributed a scan to the training dataset, their other scans were excluded from testing.
Patient sex, age, and image acquisition parameters were retrieved from DICOM attributes or provided with the dataset (Table 1). Race and ethnicity were self-reported. To compare FALCON with results from Ye et al. [24] and DICOM attributes, we extracted intravenous contrast presence from DICOM solely for comparison.
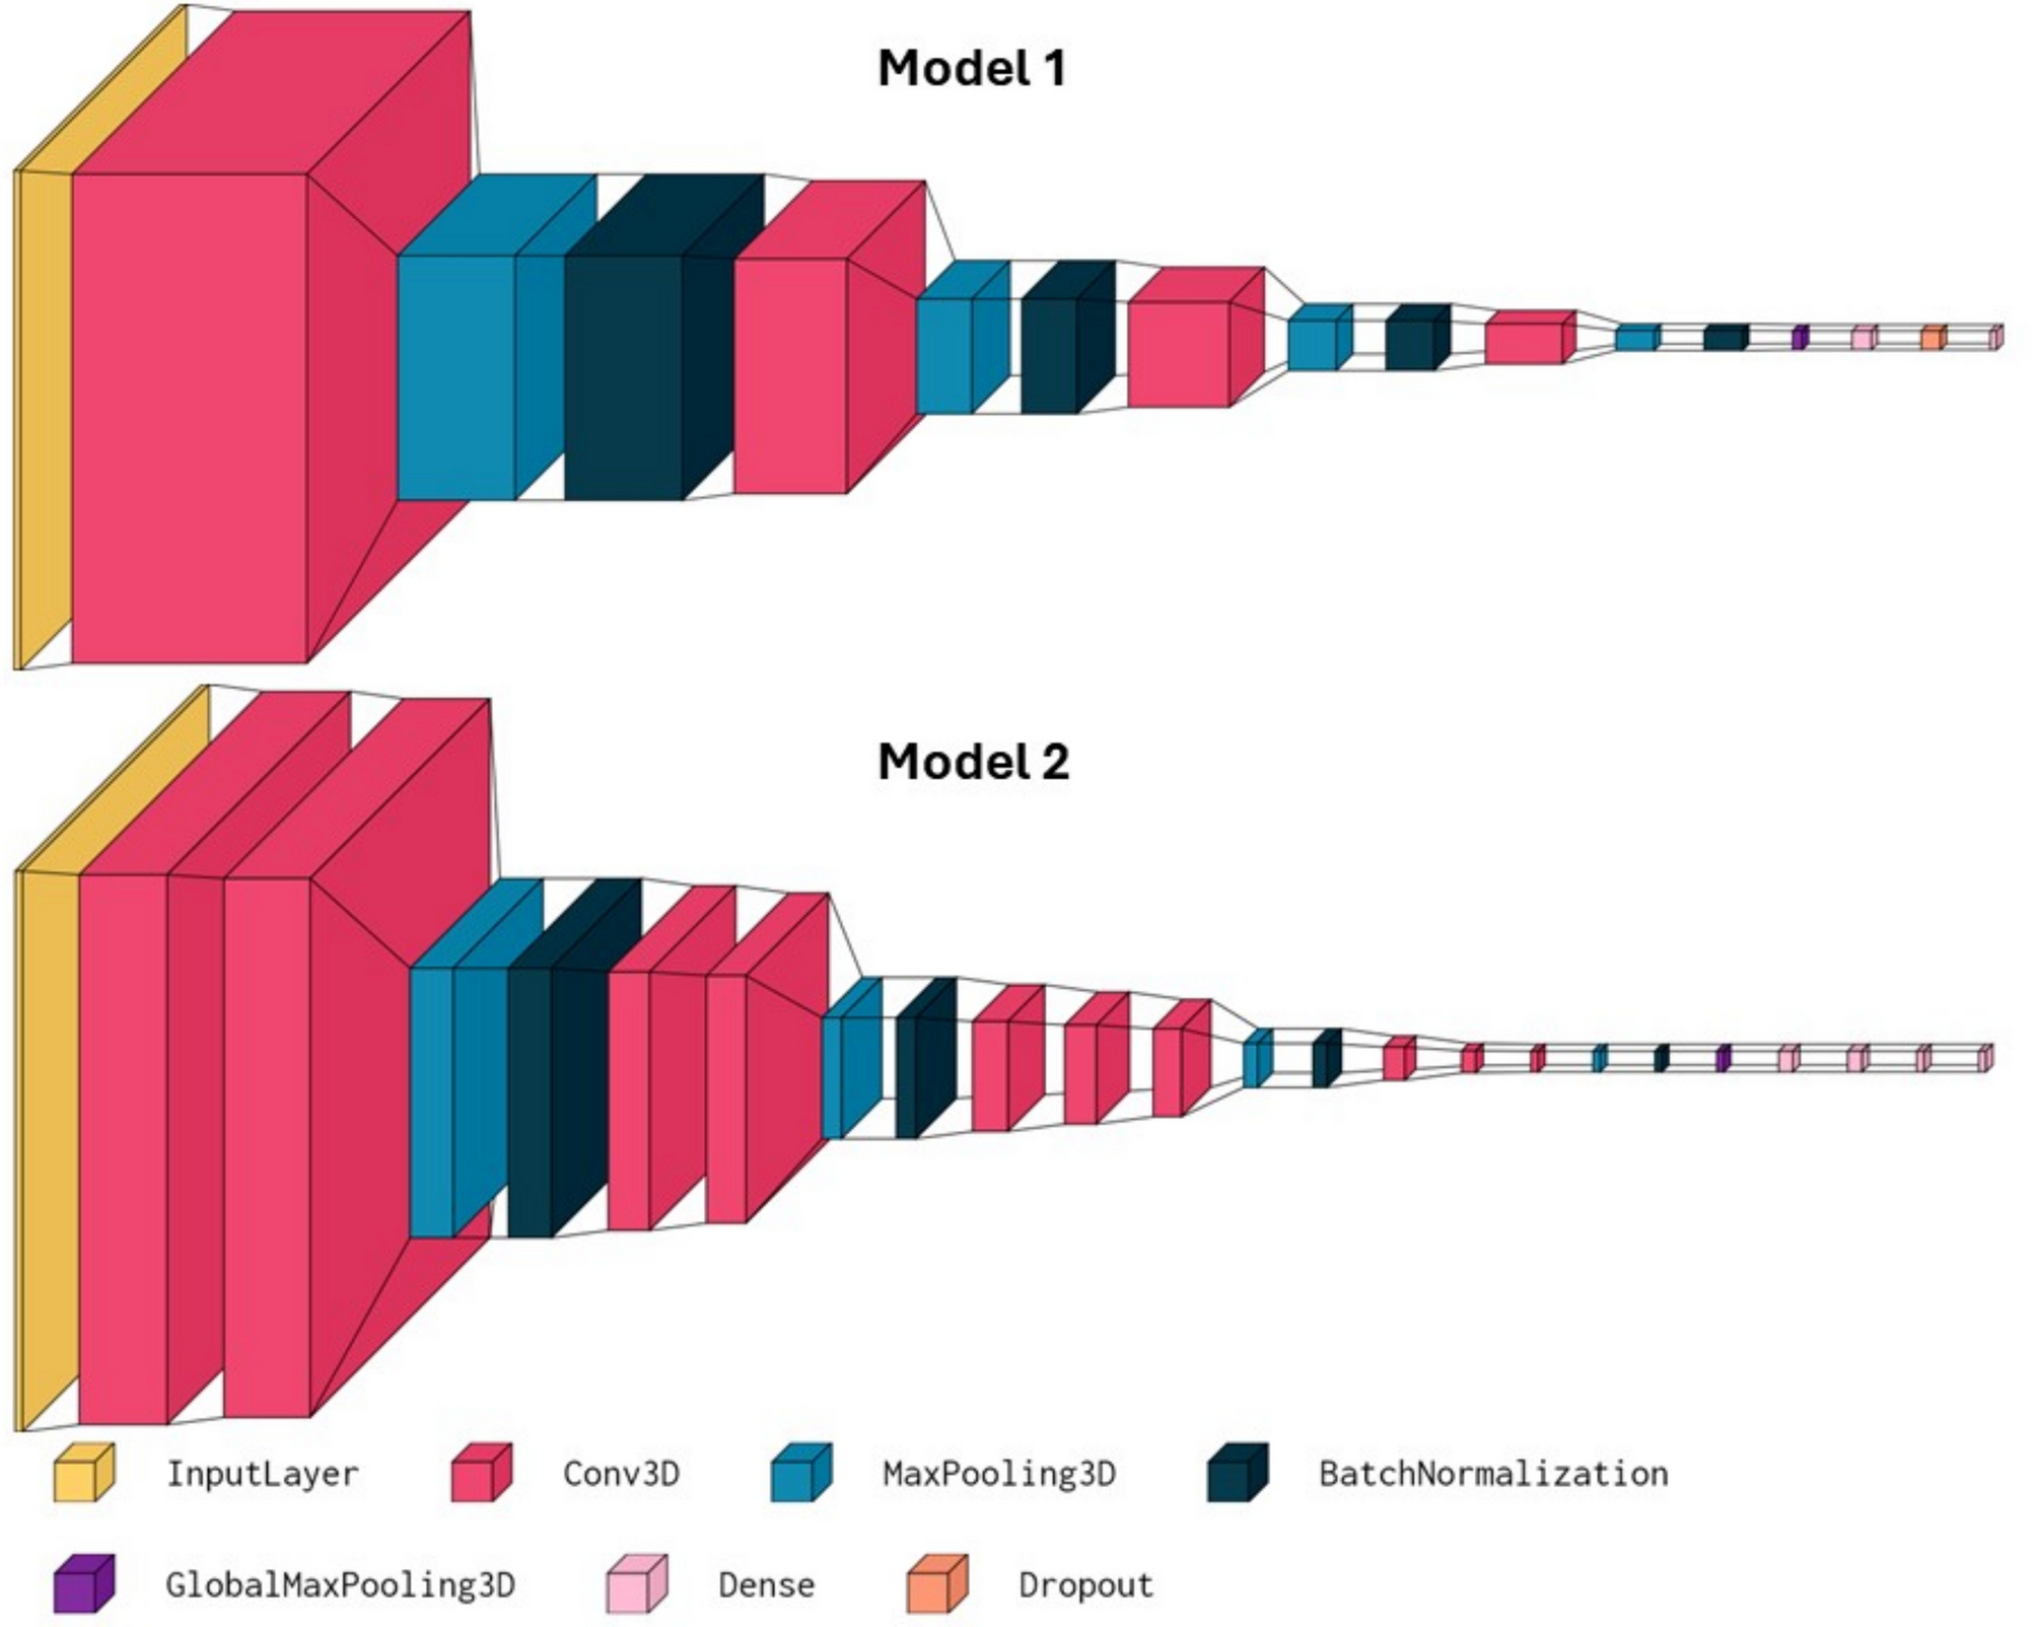
Table 1 Participant characteristics stratified by datasetPipeline Overview, Preprocessing, and Model ArchitectureThree-dimensional volumetric CT data were fed into the model and preprocessed to select a single central axial slice, defined as the middle slice in the series (Fig. 1). For CT scans of the HN, axial 1.25 mm or 3 mm cuts were used; for chest, axial 3 mm cuts; and for AP, 5 mm axial cuts. The selected slice entered a body part classifier sub-algorithm, which selects one of three distinct contrast classification models, one for each body part (HN, chest, AP). Subsequently, the selected slice entered its corresponding contrast detection sub-algorithm to predict intravenous contrast presence with a confidence level. Preprocessing, based on related studies [24,25,26,27] and streamlined for computational efficiency (Fig. 2), was utilized in model development and is part of the final model (Fig. 3). The ResNet9 architecture was used for all four models: body part, HN contrast, chest contrast, and AP contrast (Fig. S3).
Fig. 1
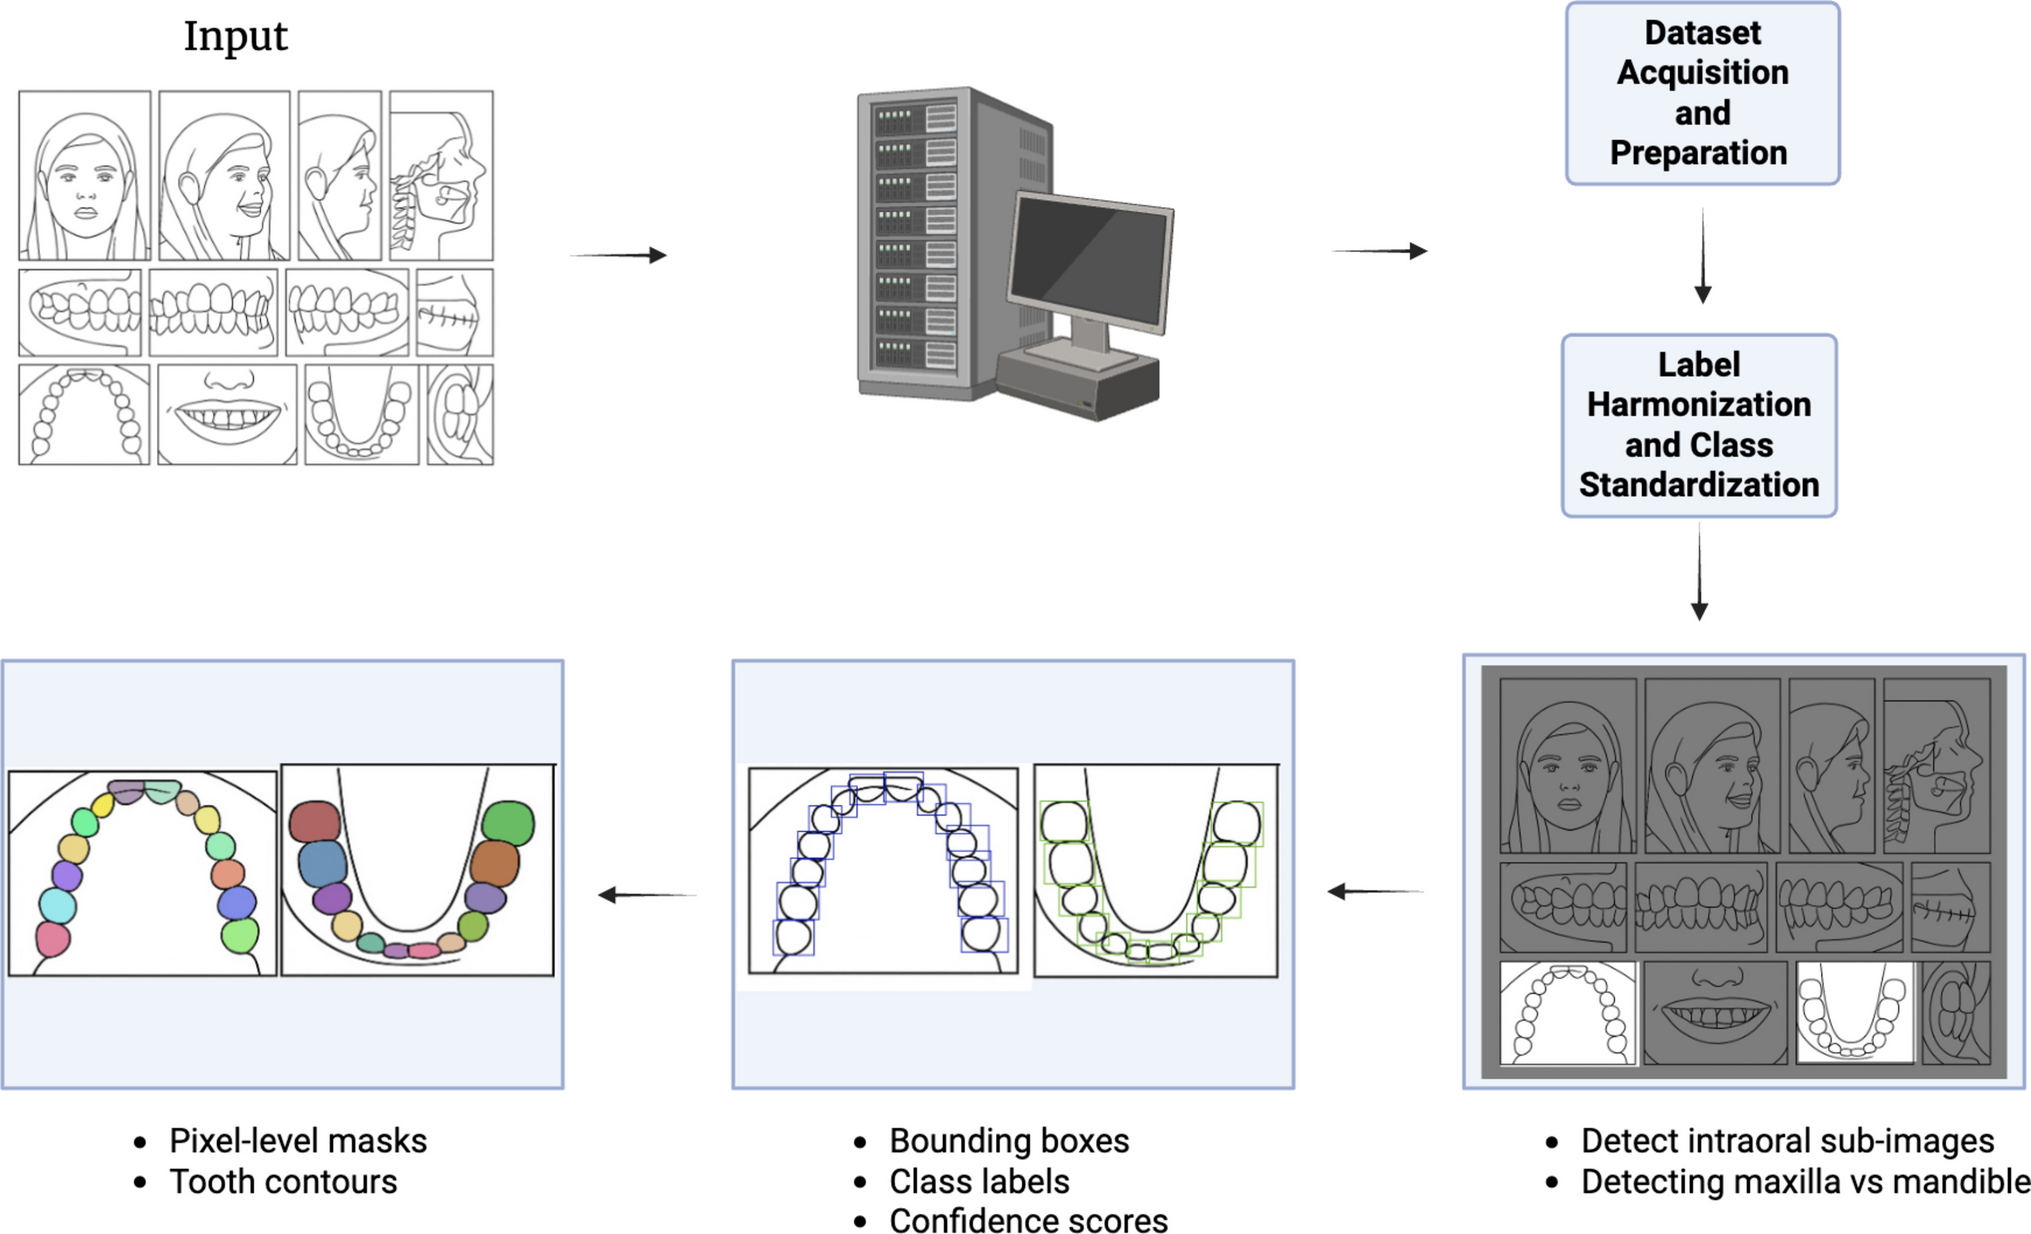
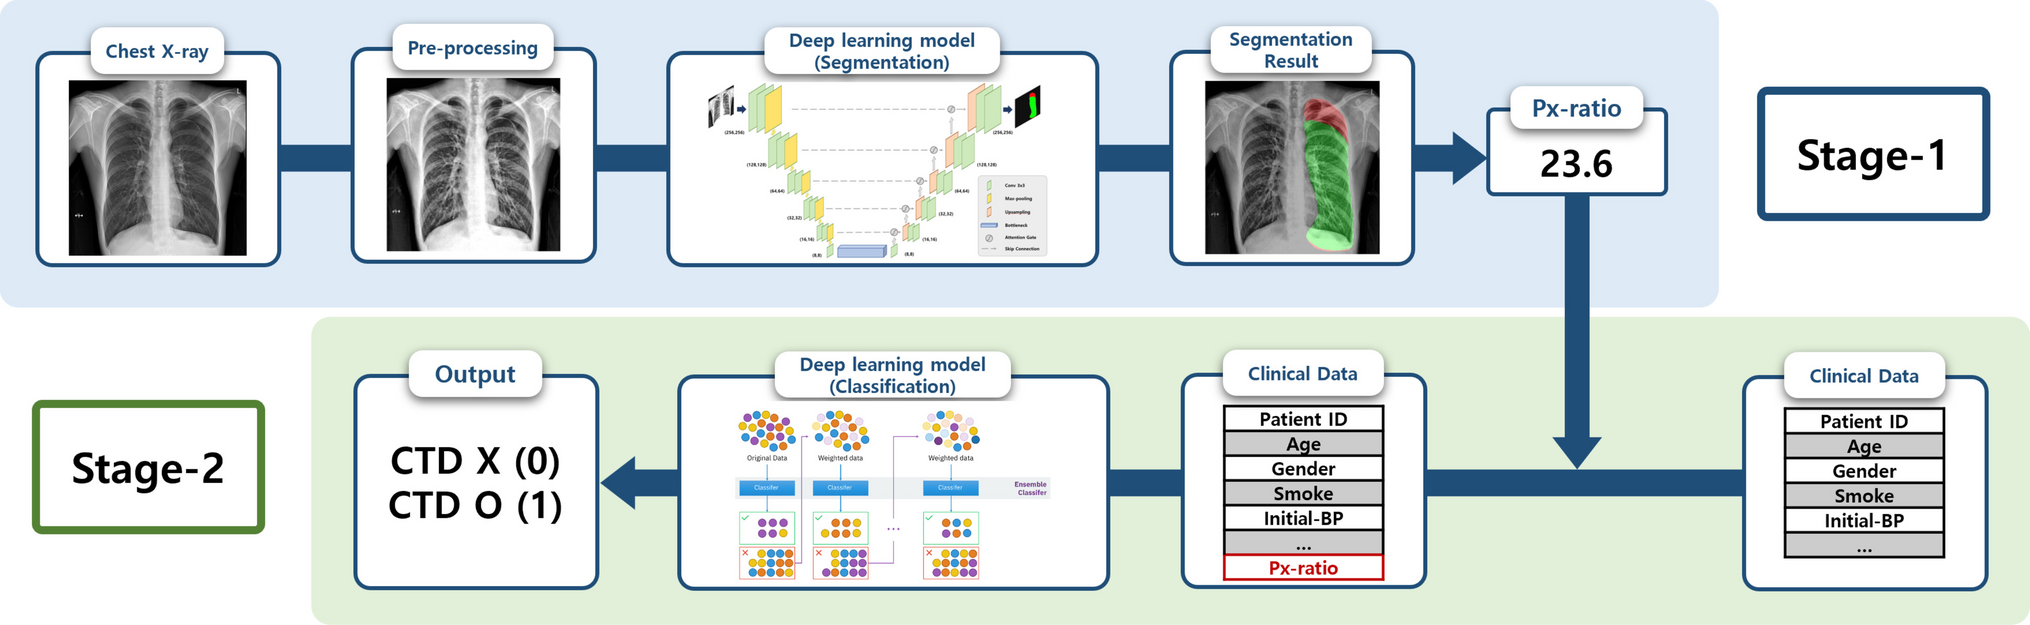
Overview of the FALCON model. First, a three-dimensional computed tomography volume is fed into the body part detection stage. Second, the CT is preprocessed to yield a single central axial slice. Third, this slice enters the body part classifier, which identifies the image belonging to the head-neck, chest, or abdomen-pelvis region. Alternatively, body part labels can be provided, and thus, the body part detection stage can be skipped. Fourth, the probability of intravenous (IV) contrast presence is calculated according to each body part model during the IV contrast detection stage. This results in a binary output: intravenous contrast presence or absence
Fig. 2
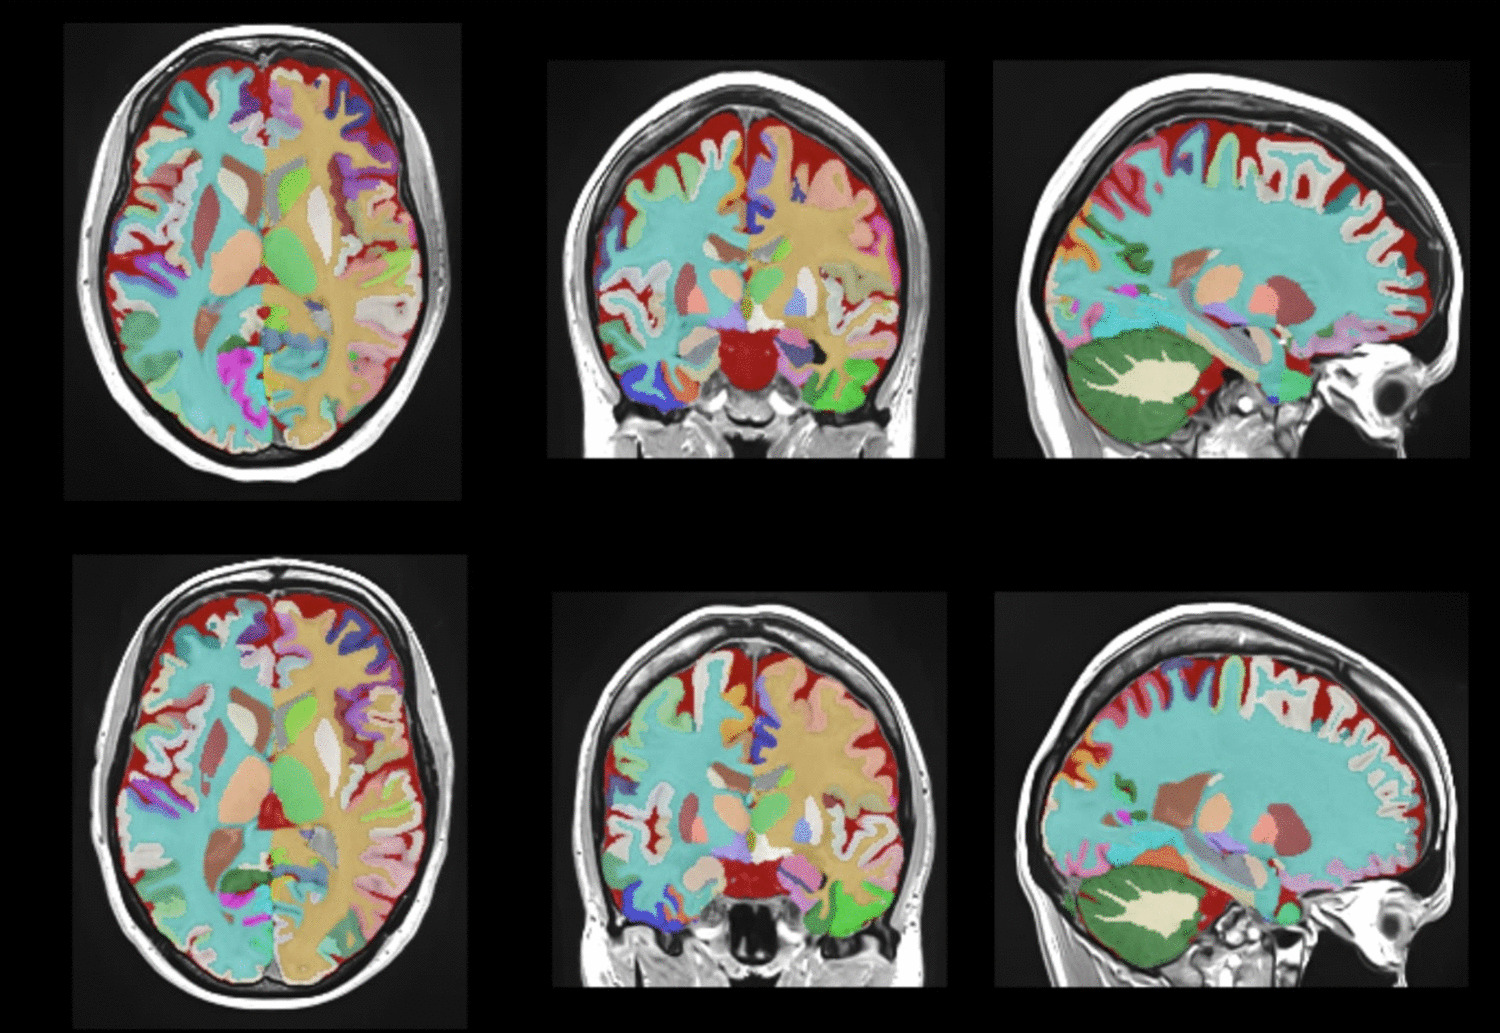
Preprocessing image selection workflow. Initially, DICOM scans were converted to Hounsfield units, values were clipped, scans were respaced, and the scans were cropped around the center of mass (A) to yield the region of interest (B). This cropped volume is subsequently decomposed into its two-dimensional axial slices (C), which are used for training and prediction. The exact slice range used for training and prediction was optimized based on the internal validation set
Fig. 3
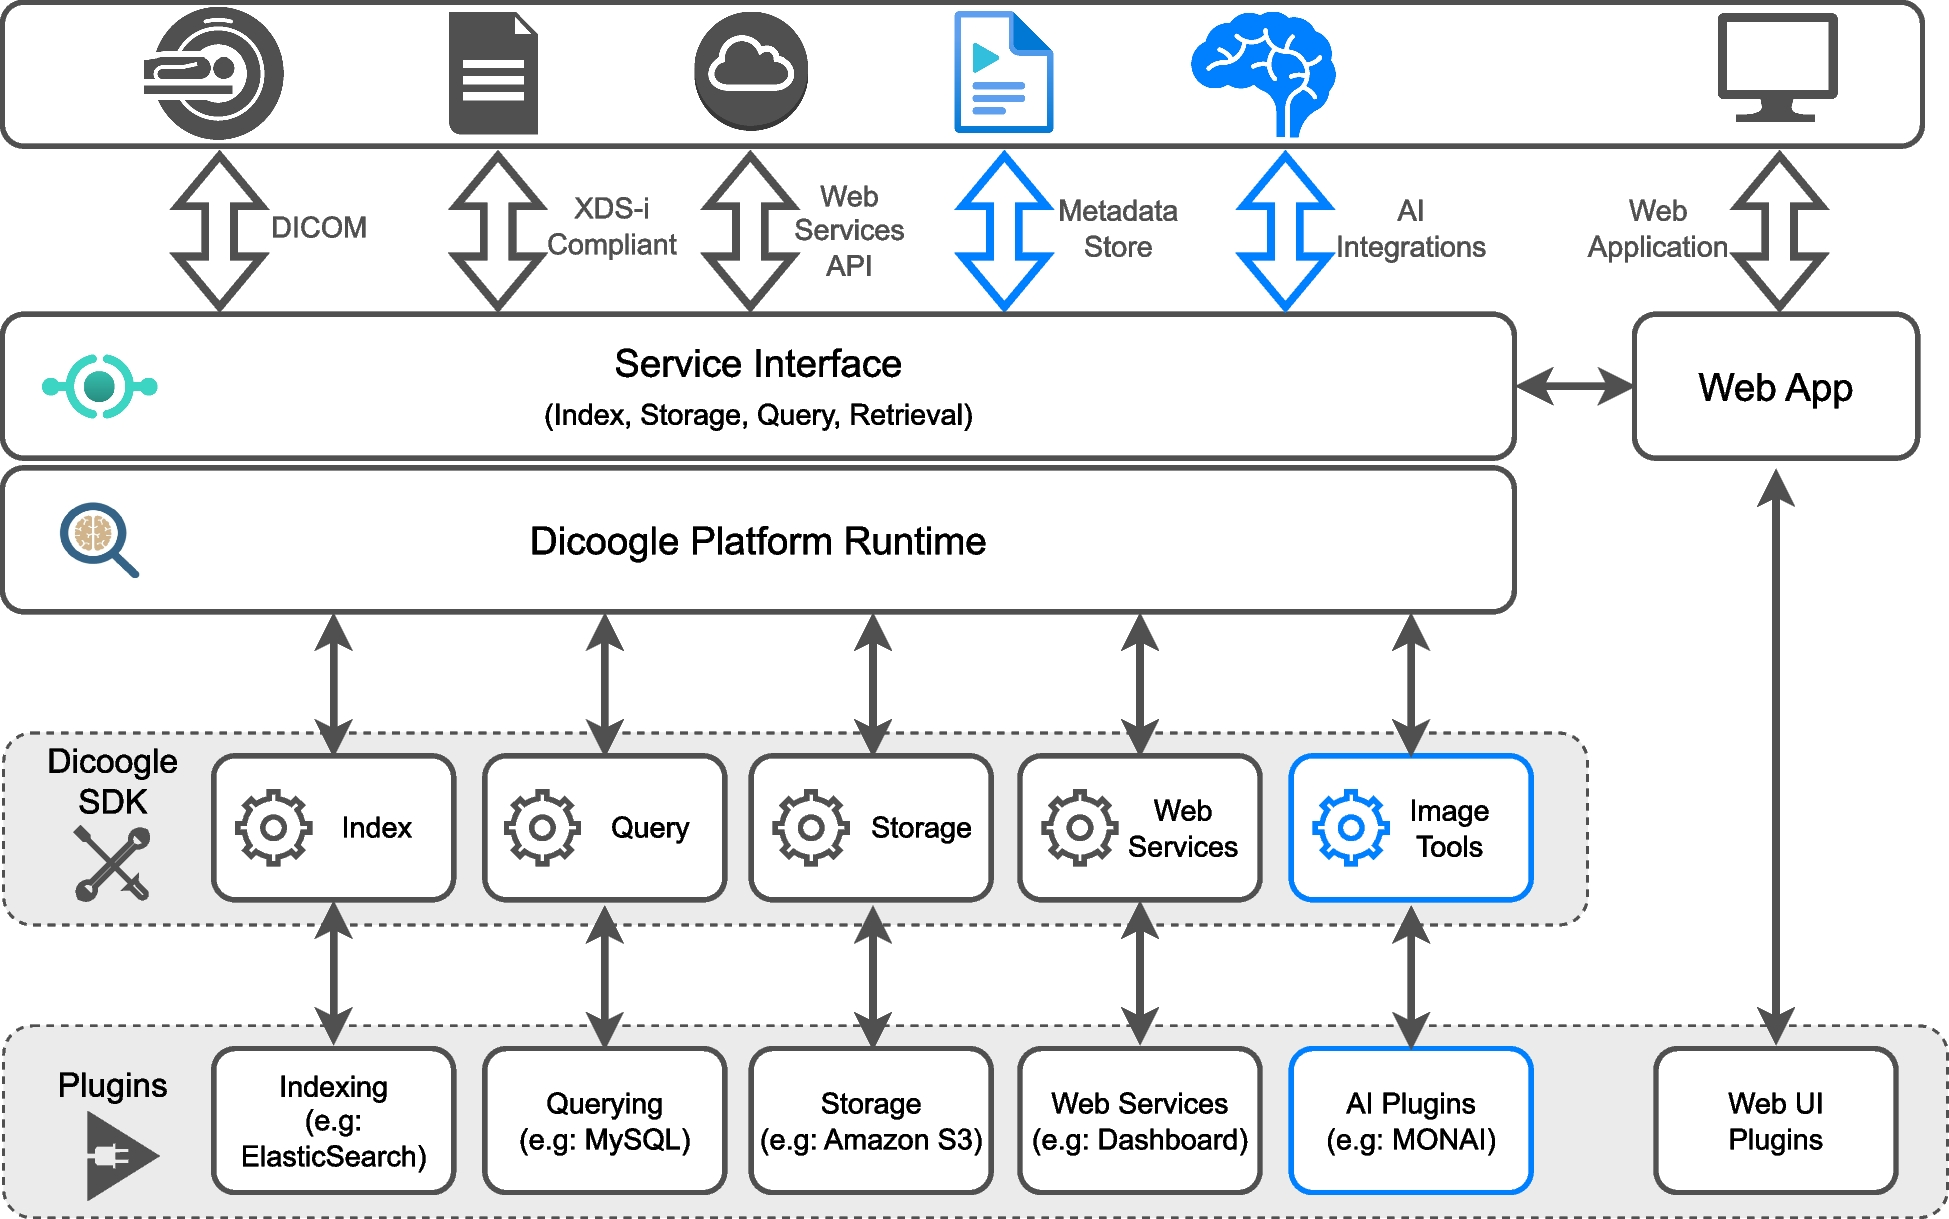
FALCON (Fully Automated Labeling of CT anatomy and intravenous CONtrast) graphical user interface. Screenshot shows the graphical user interface at startup. A directory containing computed tomography scans can be selected and loaded into the tool. FALCON will provide body part labeling and the probability of intravenous contrast presence for each CT scan. If the user provides the body part labels of all input scans, the first sub-algorithm can be skipped, and FALCON only provides the probability of intravenous contrast presence
Model TrainingTo train the four models, we used a large, specified range (Table 2) of axial slices from the preprocessed CT scans (Fig. S4). Model training utilized high-performance computing clusters to analyze the full volumetric data of each CT scan; details are provided in the Supplementary Information.
Table 2 Technical characteristics stratified by datasetModel PerformanceWe measured the average time FALCON required to assess intravenous contrast presence on a randomly selected scan from the external test set for each body part. In the first part, FALCON calculated the contrast probability with the body part label provided. In the second part, we measured the time for both body part classification and contrast detection on randomly selected scans. All assessments were performed with and without a dedicated GPU (graphics processing unit). Discrepant cases between the algorithmic predictions and the reference contrast labels were analyzed to characterize failure modes.
Graphical User InterfaceA graphical user interface (Fig. 3) was developed using Python 3.9.18 to facilitate clinical implementation.
OutcomesThe primary outcome was the accuracy and F1 score of FALCON compared to ground truth for intravenous contrast detection and body part classification. The secondary outcome was the average time required to annotate a CT scan of the HN, chest, and AP using FALCON compared to data published by Ye et al. [24] and to ground truth data obtained from a radiologist with four years of experience. The reference annotation time per CT scan was obtained from a previously published study [24], which reported the time to manually annotate 1315 HN scans and 664 chest scans by two radiation oncologists with four and seven years of clinical experience, which we refer to as expert clinicians. The reference annotation time per CT scan for AP was obtained by a radiologist with four years of experience through manually annotating 981 scans from Datasets III and VI, preloaded into RadiAnt DICOM viewer version 2025.2 to minimize loading times.
Statistical AnalysisWe calculated sensitivity, specificity, F1 score, overall accuracy, positive predictive value, and negative predictive value for internal and external test sets. Sensitivity and specificity were calculated with a 50% contrast probability threshold, defined during training. For the external test set, mean F1 score, accuracy, and Matthews Correlation Coefficient with 95%CIs were estimated via bootstrapping (1000 iterations).
Model accuracy was evaluated using confusion matrices, accuracy, and F1 scores. A χ2 test compared accuracy to ground truth, and agreement was assessed with Yule’s Q. Receiver-operating-characteristic (ROC) curves and area-under-the-curve (AUC) analyses were performed for the development dataset to discriminate contrast presence. Model speed was evaluated using relative differences.
Cohen’s kappa coefficient was computed for Datasets II, III, V, and VI to quantify interreader reliability between a research assistant and ground truth provided by a radiologist with four years of experience.
Statistical analyses were generated in Python 3.9.18 and R 4.4.1. P-values of < 0.05 were considered statistically significant. Missing data was excluded from statistical analyses. All source code and the model can be found at https://github.com/FintelmannLabDevelopmentTeam/Falcon.
Comments (0)