
Remember me

At age 10, the patient presented with an acute abdomen and bitemporal hemianopia. Abdominal magnetic resonance imaging (MRI) revealed bilateral ovarian enlargement with polycystic follicles. Laboratory tests showed elevated FSH (33.7 mIU/mL), estradiol (E2, 3840 pg/mL), and low LH (< 0.5 mIU/mL). Head MRI identified a dumbbell-shaped tumor extending from the intrasellar to the suprasellar region. The tumor was resected via microscopic transsphenoidal surgery. Histopathology confirmed a PitNET with FSH and slight LH positivity (Supplementary Fig. 3). Owing to residual tumor and persistent hormonal elevation, 50 Gy local radiotherapy was performed, normalizing FSH and E2 levels, reducing ovarian size, and shrinking the tumor. These early management details were previously reported [4, 5]. She developed diabetes insipidus and hypopituitarism, requiring desmopressin, cortisol, thyroxine, growth hormone (GH), and estrogen-progesterone therapy. GH was paused at age 13, and resumed at age 18; the FSH levels gradually rose subsequently (Supplementary Fig. 1).
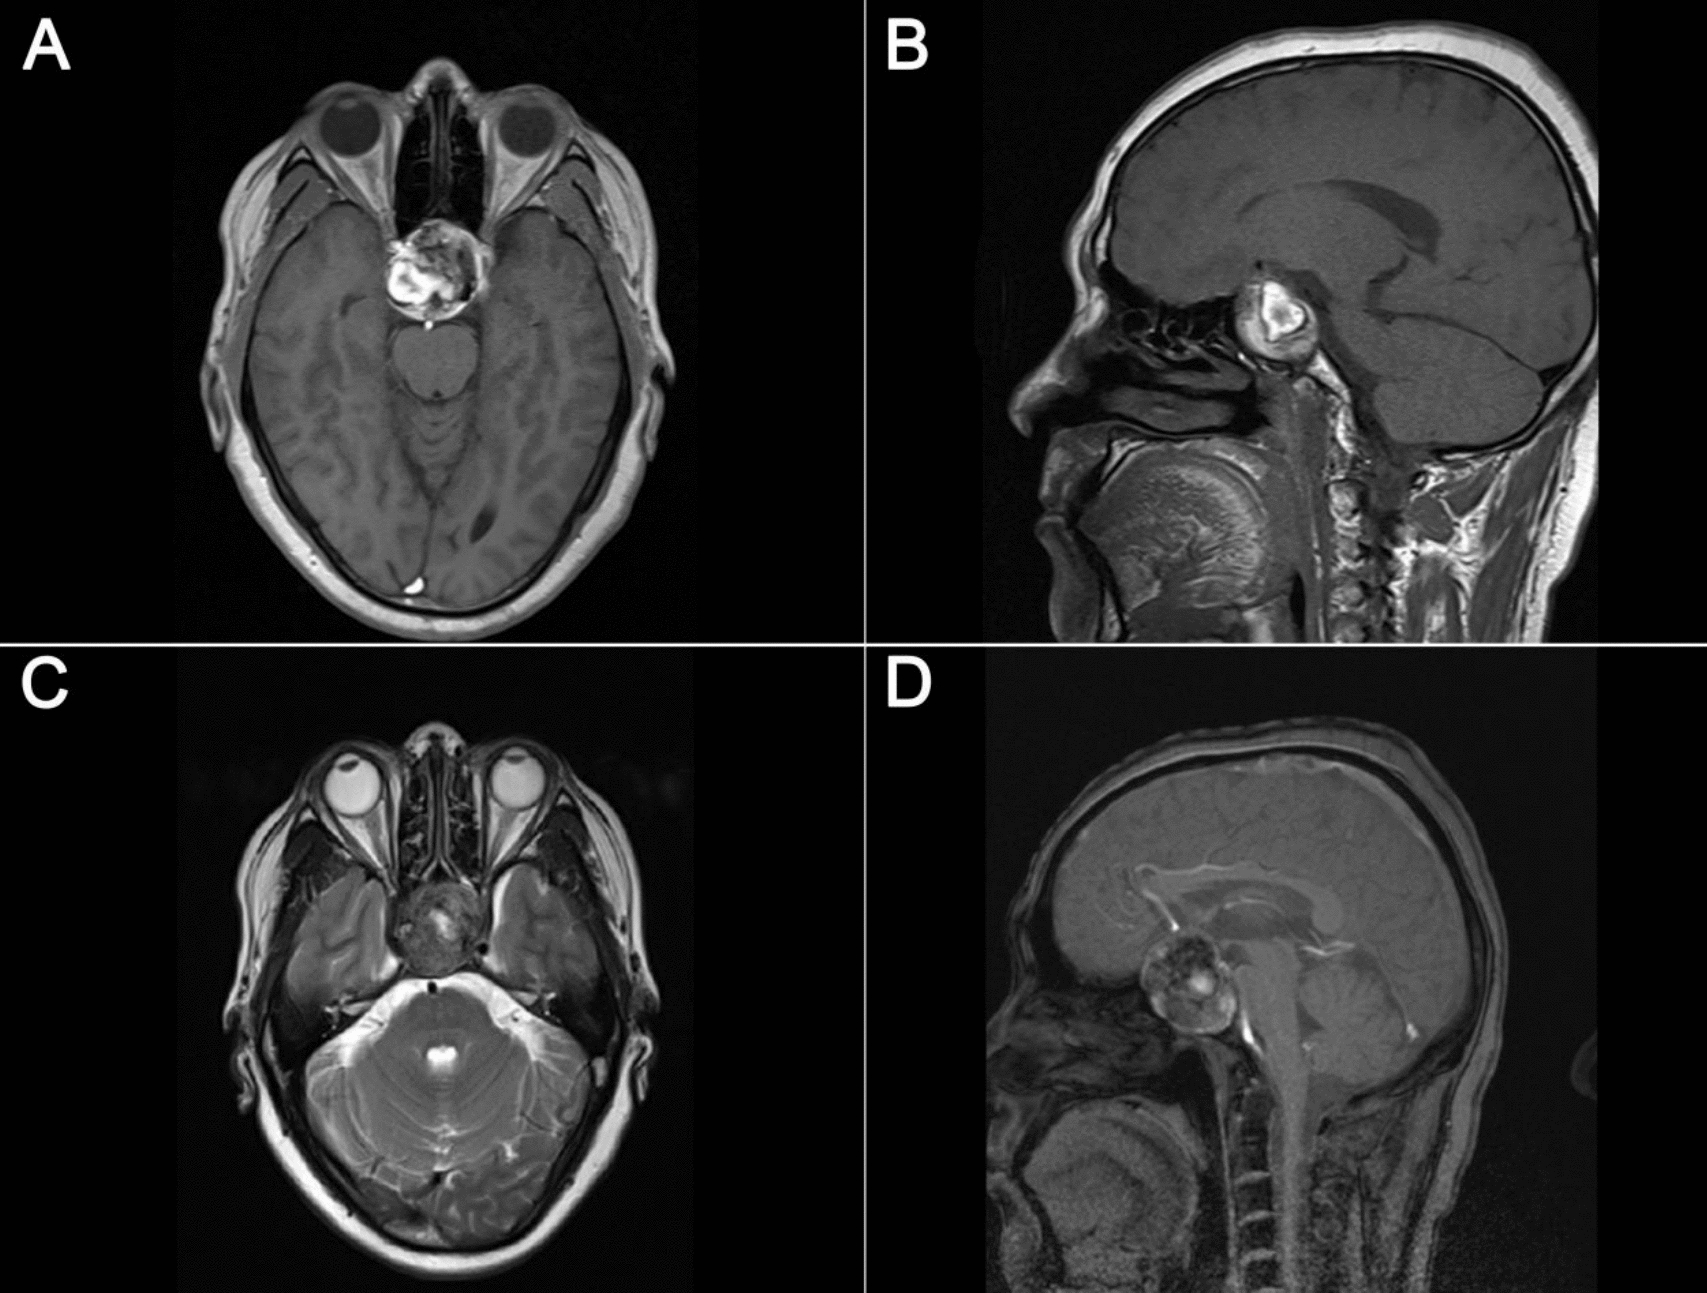
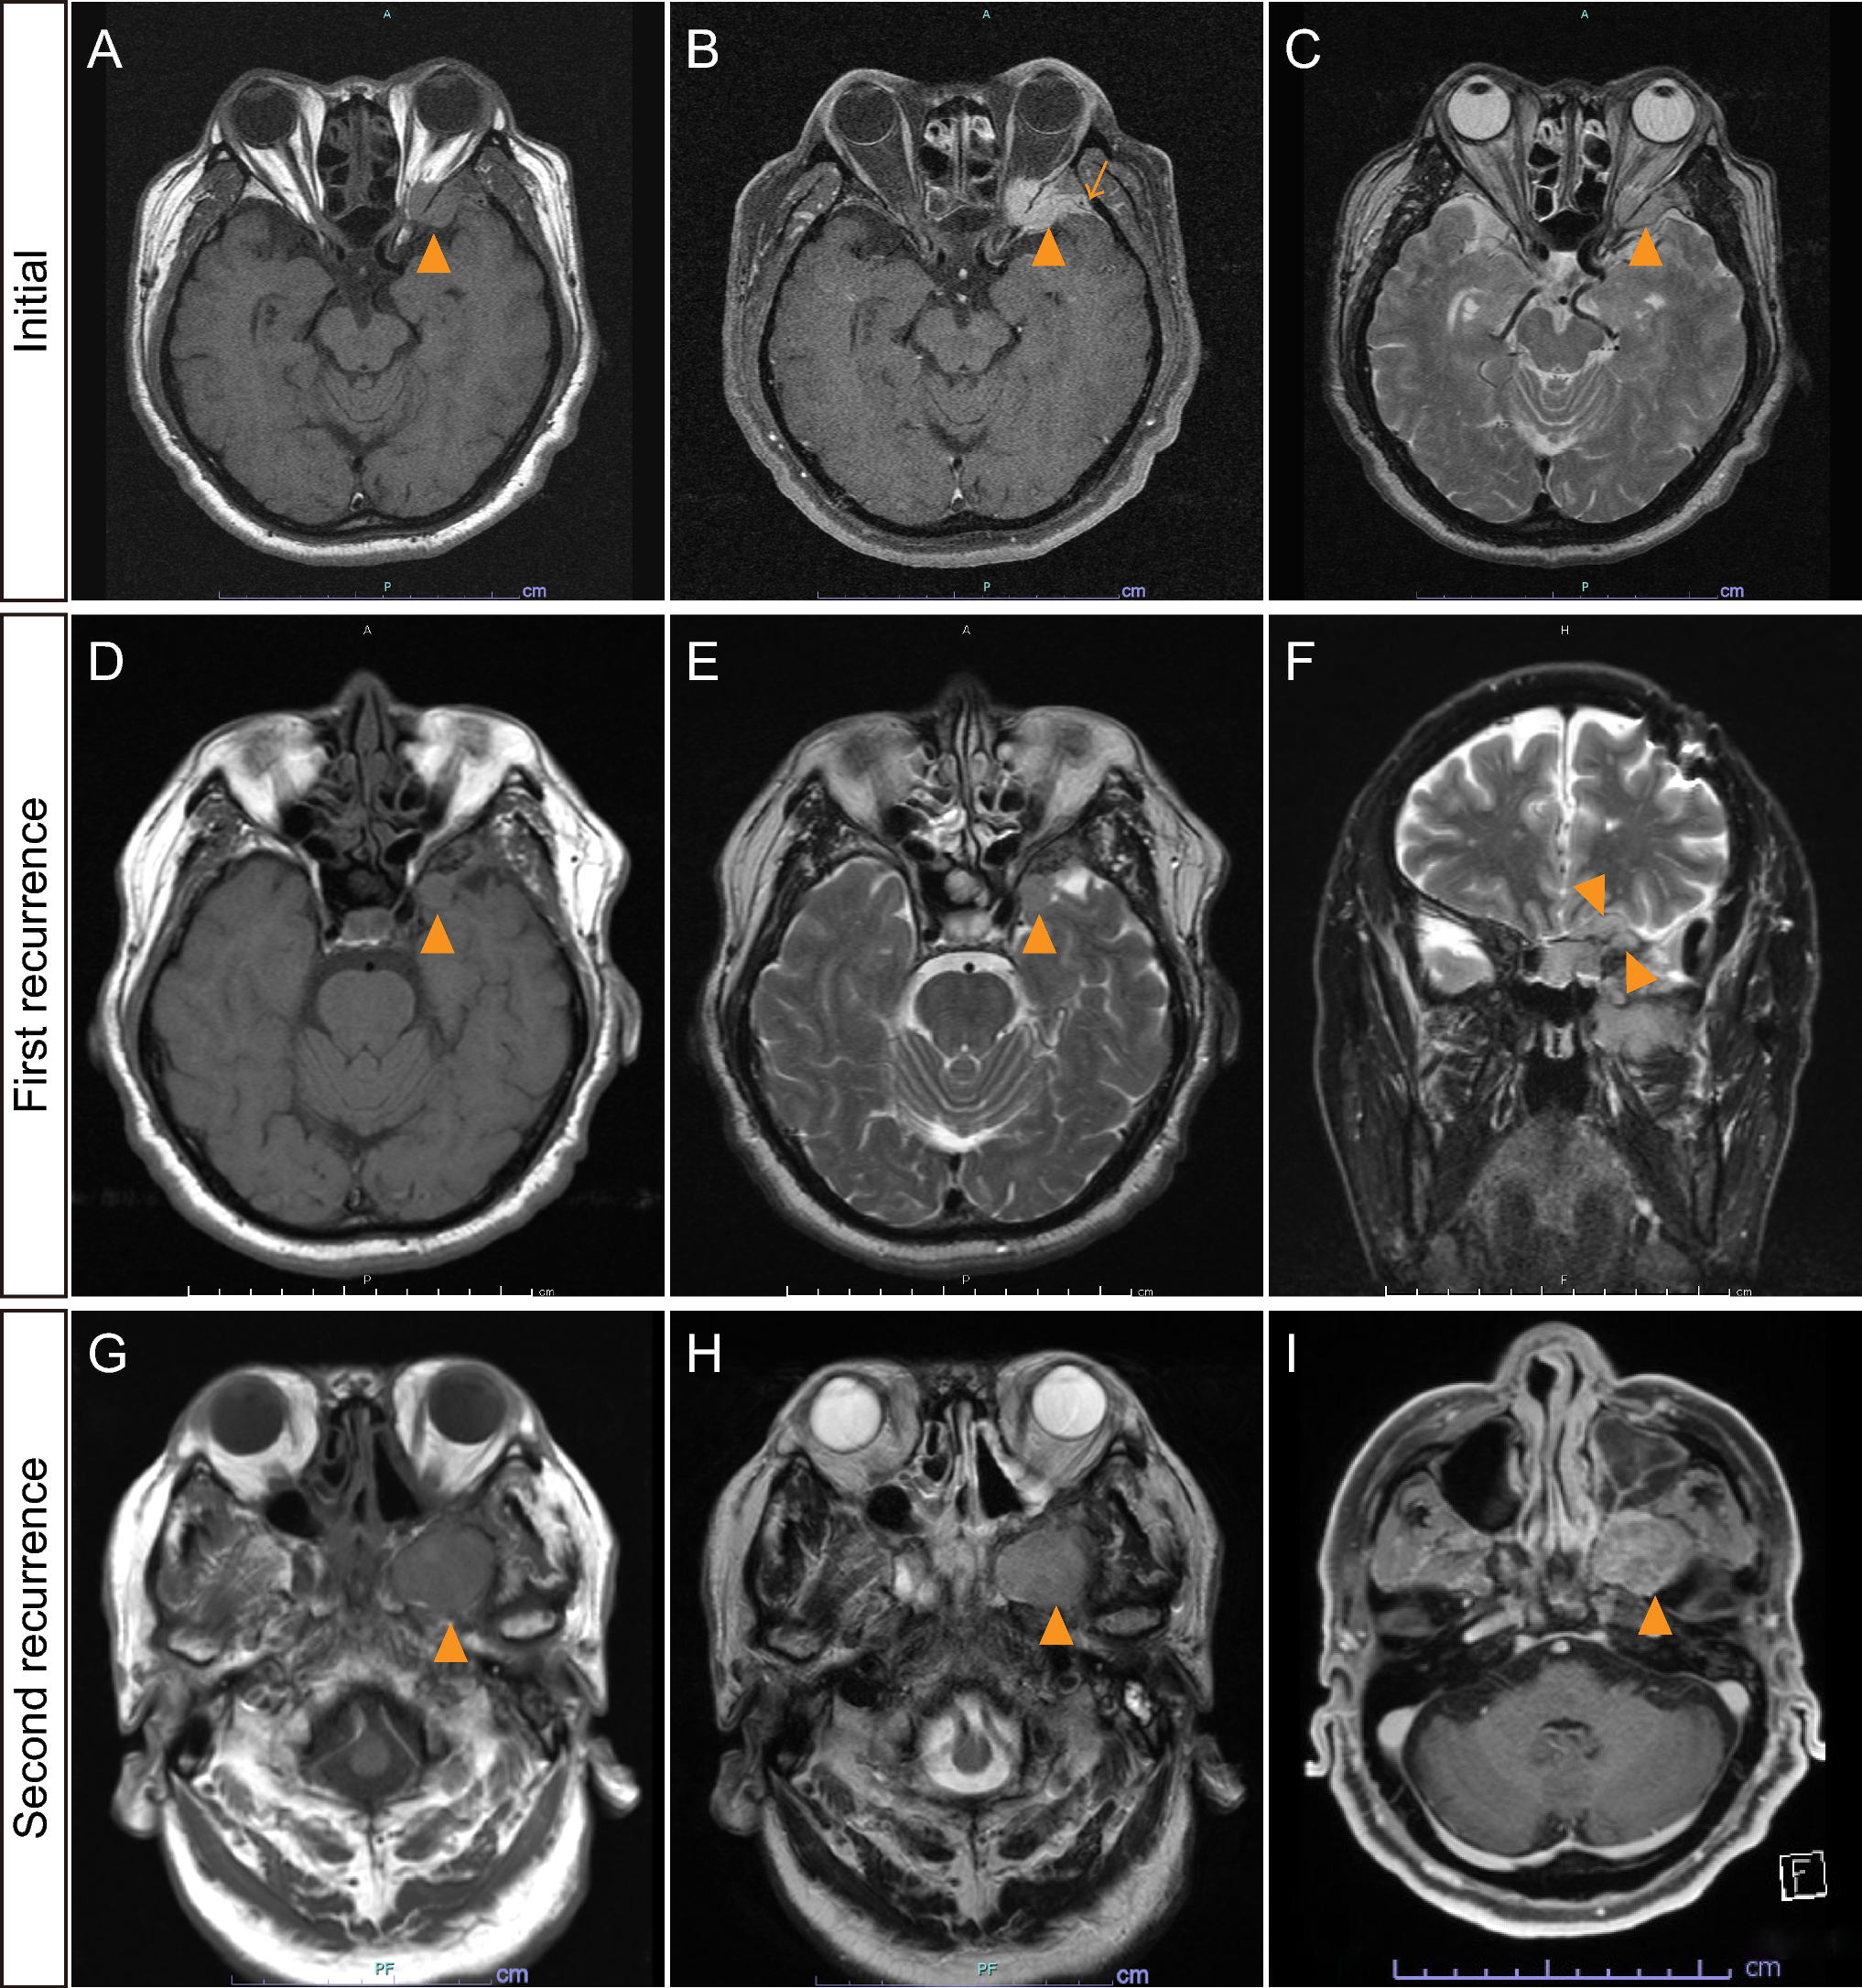
At age 20, ovarian enlargement and hormonal elevation recurred without MRI evidence of tumor (Fig. 1a, b). Cavernous sinus sampling showed no central-peripheral FSH gradient (peripheral: 9.6–10.3 mIU/mL; right and left cavernous sinuses: 9.4–11.1 mIU/mL). Bromocriptine, a dopamine agonist, partially suppressed FSH; octreotide was ineffective (Supplementary Fig. 2a-b). A second endoscopic transnasal resection confirmed recurrent PitNET with FSH and slight LH positivity (Fig. 2a-c and Supplementary Fig. 3). Ki-67 was < 1% and, DRD2 staining was positive (Fig. 2d). Cabergoline (0.25 mg/week), another dopamine agonist, reduced FSH and ovarian size. Despite therapy, tumor recurred at age 28 (Fig. 1c) without FSH elevation or ovarian enlargement. Resection revealed FSH-negative pathology (Supplementary Fig. 3); cabergoline maintained disease stability.
Fig. 1
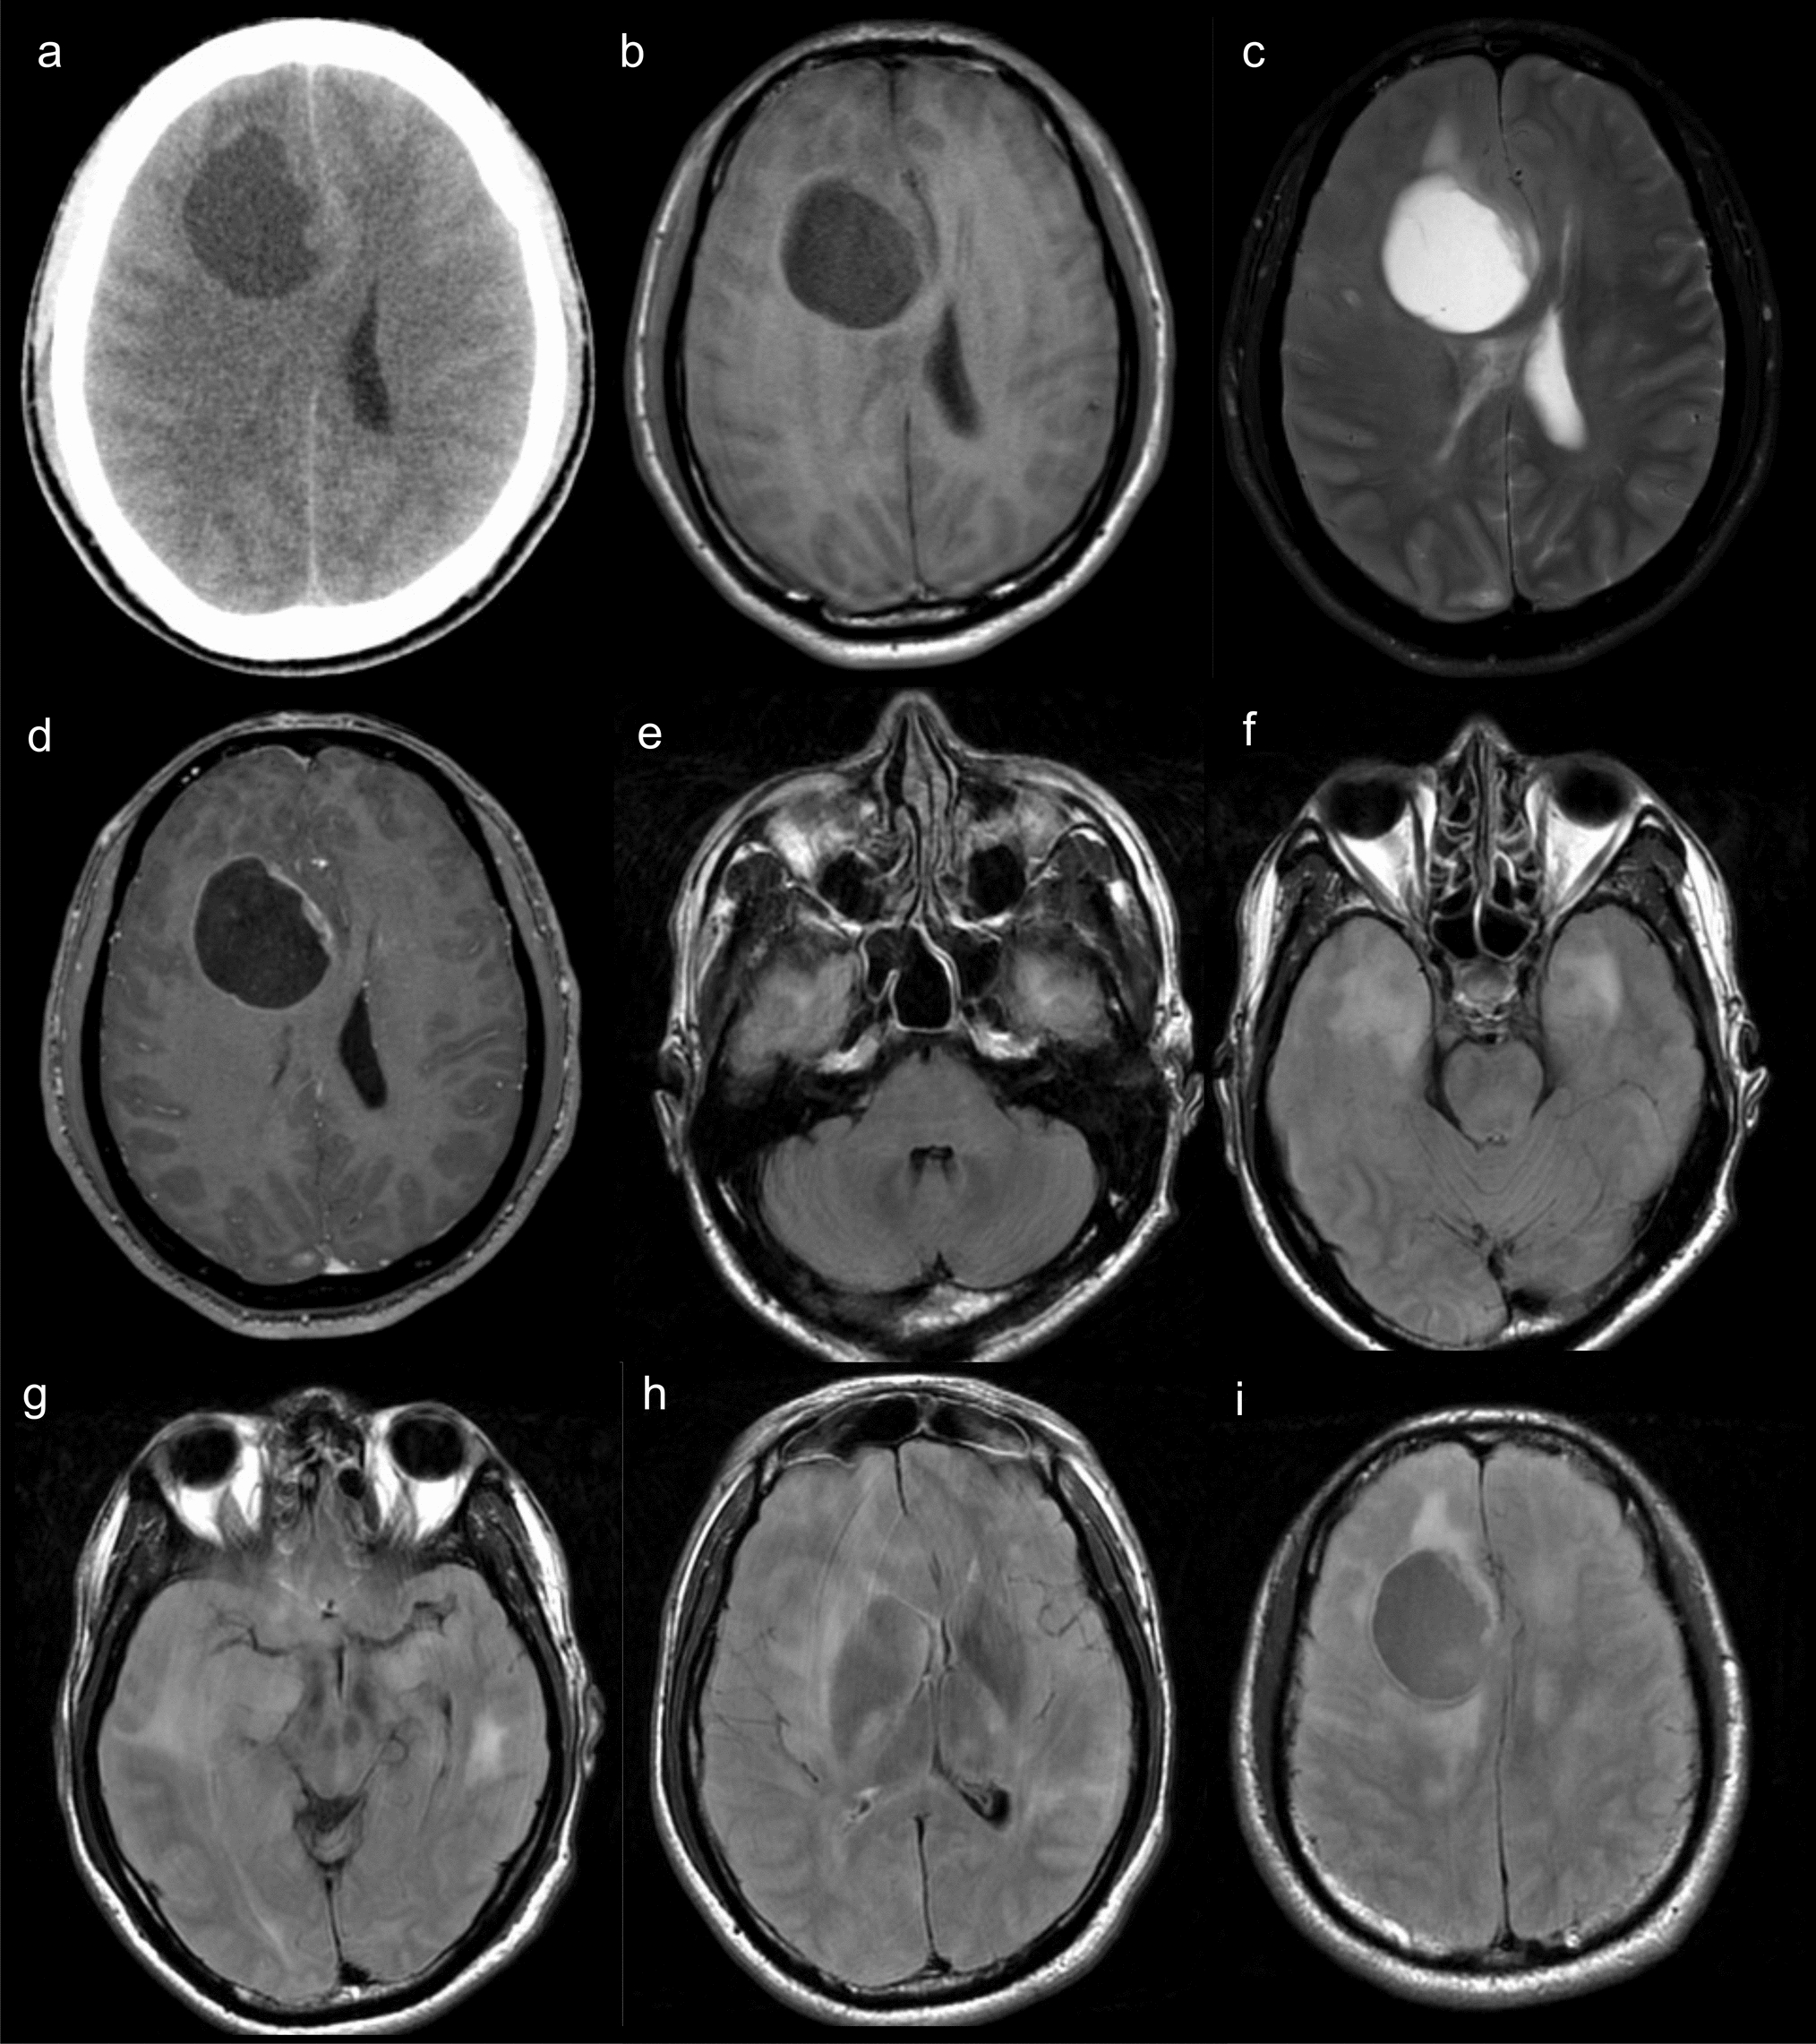
Radiographic findings of case 1. a Abdominal MRI T2-weighted image (T2WI) showing bilateral ovarian enlargement and polycystic follicles. b Head MRI T1-weighted image (T1WI) with gadolinium (T1-Gd) enhancement showing no remarkable recurrence of the pituitary tumor at age 20. c Head MRI T1-Gd showing tumor regrowth in the left cavernous sinus at age 28. d Head MRI T1-Gd showing no obvious tumor recurrence in the pituitary at age 35. e Abdominal MRI diffusion-weighted image showing multiple masses in the liver. f–h 18 F-fluorodeoxyglucose positron emission tomography (FDG-PET) scan showing metastases to the liver (f), multiple bone metastases in the cervical, thoracic, and lumbar spine, both scapulae (g), and the right femur (h)
Fig. 2
Pathological findings of case 1 . a Hematoxylin and eosin (HE) staining, b follicle-stimulating hormone (FSH), c luteinizing hormone (LH), and d dopamine receptor D2 (DRD2, cat. no. 324393, Calbiochem) from the pituitary tumor resection at age 20. e HE staining, f Chromogranin A, g Synaptophysin, h Insulinoma-associated protein 1 (INSM1), i FSH, j steroidogenic factor 1 (SF-1), k Ki-67, and l DRD2 from the liver biopsy at age 35
At age 35, during infertility treatment, cabergoline was stopped, leading to ovarian enlargement; FSH 21.7 mIU/mL and E2 1710 pg/mL were initiated. Head MRI showed no recurrence (Fig. 1d), but abdominal MRI found multiple liver masses (Fig. 1e), and 18 F-fluorodeoxyglucose positron emission tomography (FDG-PET) revealed metastases in the liver, bones, and cavernous sinus (Fig. 1f-h). Indium-111 pentetreotide scintigraphy (OctreoScan®) a nuclear imaging test for detecting somatostatin receptor-positive neuroendocrine tumors, was negative. Liver biopsy showed PitNET-like cells (Fig. 2e) with positive for neuroendocrine markers (Fig. 2f-h) and for FSH (Fig. 2i), with Ki-67 < 1% (Fig. 2k). DRD2 positivity (Fig. 2l) supported cabergoline use. As in the primary PitNET, steroidogenic factor 1 (SF-1/NR5A1) was positive (Fig. 2j), while pituitary-specific positive transcription factor 1 (PIT1/POU1F1) and T-box pituitary transcription factor (TPIT/TBX19) were negative (Supplementary Fig. 4), supporting gonadotroph lineage differentiation. Cabergoline (0.5 mg daily for 10 days) was administered based on ovarian hyperstimulation syndrome (OHSS) treatment protocols, followed by 0.25 mg once weekly as maintenance, sustaining FSH reduction and improvement in ovarian enlargement. Though not ideal during fertility treatment, cabergoline controlled tumor activity. Over three years, MRI and FDG-PET showed stable disease and tumor shrinkage.
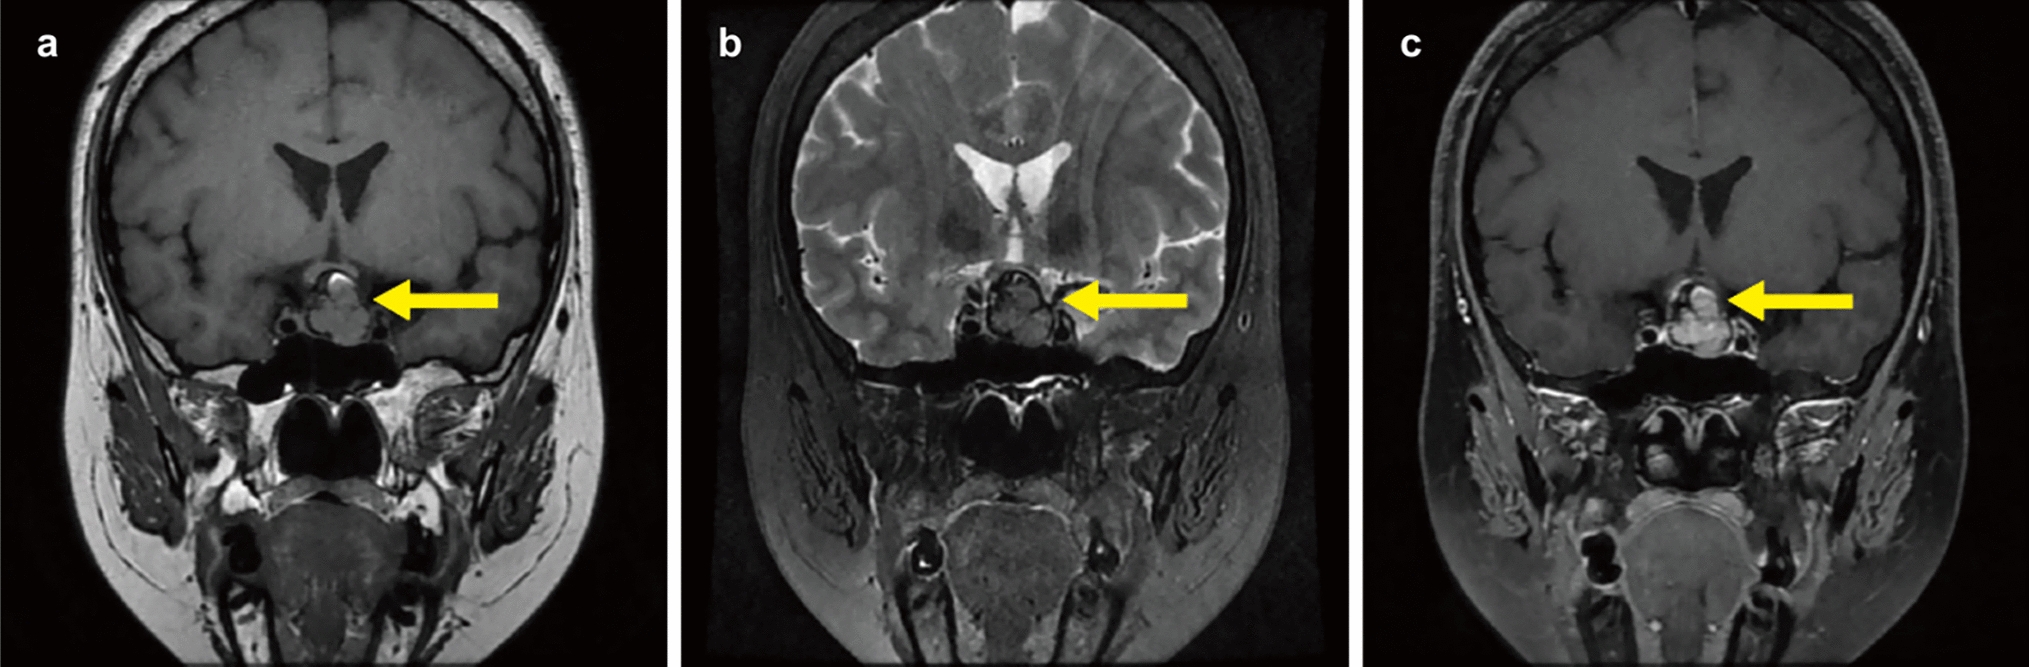
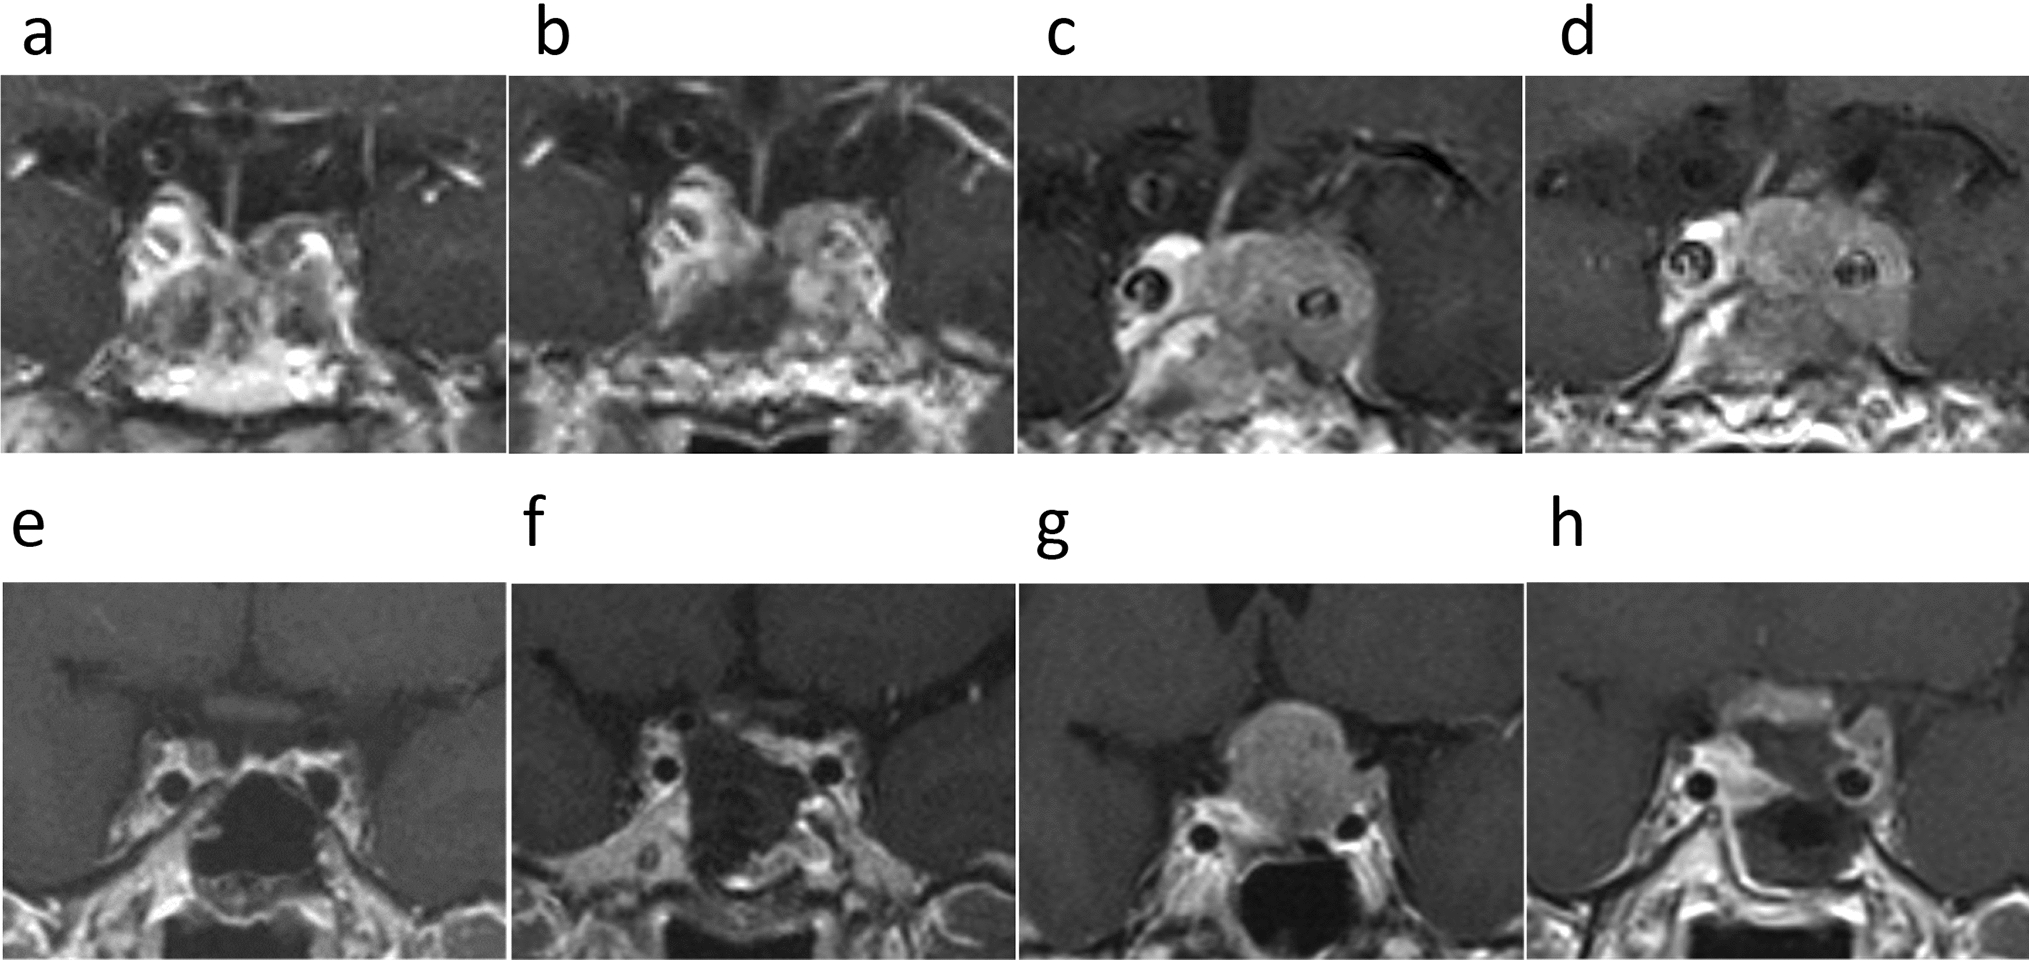
Case 2A 26-year-old woman presented with abdominal pain and bitemporal hemianopia. Abdominal MRI revealed bilateral ovarian enlargement (Fig. 3a); tests revealed FSH 31.6 mIU/mL, E2 707.9 pg/mL, LH < 0.2 mIU/mL. Head MRI revealed a pituitary tumor (Fig. 3b). Endoscopic resection normalized hormone levels (FSH < 1.0 mIU/mL, E2 < 25.0 pg/mL), and ovarian size improved and reduced ovarian size. No residual tumor was seen on follow-up MRI. Histopathology confirmed Gn-PitNET with partial FSH positivity, negative LH (Fig. 3c-e), Ki-67 < 1%, and negative DRD2 (Fig. 3f). Ovarian enlargement has not recurred in the following 20 years.
Fig. 3
Magnetic resonance imaging (MRI) and pathological findings of case 2 (a–f) and case 3 (g–l). a Abdominal T1-weighted image (T1WI) with gadolinium enhancement (T1-Gd) showing bilateral ovarian enlargement and polycystic follicles. b Head MRI T1-Gd showing a pituitary tumor. c Hematoxylin and Eosin (HE) staining, and immunostaining for d follicle-stimulating hormone (FSH), e luteinizing hormone (LH), and f dopamine receptor D2 (DRD2, cat. no. 324393, Calbiochem) in case 2. g Head MRI T1-Gd showing a pituitary tumor. h Post-treatment head MRI T1-Gd showing the resected pituitary tumor. i HE staining, and immunostaining for j FSH, k LH, and l DRD2
Case 3A 48-year-old man presented with bitemporal hemianopia; MRI showed a tumor compressing the optic nerve (Fig. 3g). FSH was 251.4 mIU/mL, LH 2.4 mIU/mL, and testosterone 414.9 ng/dL. No testicular enlargement was noted. Bromocriptine partially suppressed FSH (Supplementary Fig. 2c). Endoscopic surgery resolved visual symptoms and normalized FSH (7.2 mIU/mL). Histopathology showed Gn-PitNET with strong FSH and partial LH positivity (Fig. 3i-k), Ki-67 < 1%, and partial DRD2 positivity (Fig. 3l). Testosterone levels later declined, requiring replacement therapy.
Pathological findingsImmunohistochemistryFormalin-fixed, paraffin-embedded sections were stained using following antibodies with validated controls: FSH (Clone C10, Dako, CA, USA) at 1:100, LH (Clone C93, Dako, CA, USA) at 1:100, Chromogranin A (clone 5H7, NCL-CHROM-430, Leica Biosystems, Newcastle upon Tyne, UK) at 1:400, Synaptophysin (clone 27G12, Leica Biosystems, Newcastle upon Tyne, UK) undiluted, Insulinoma-associated protein 1 (INSM1)(clone A-8, Santa Cruz Biotechnology, Santa Cruz, CA, USA) at 1:200, SF-1 (clone N1665, Perseus Proteomics, Tokyo, Japan) at 1:200, PIT1 (cat. no. ab235915, Abcam, Cambridge, UK) at 1:500, TPIT (cat. no. MA5-31431, Thermo Fisher Scientific, Waltham, MA, USA) at 1:1000, somatostatin receptor (SSTR): SSTR2A (clone EP149, Nichirei, Tokyo, Japan) at 1:4, and SSTR5 (AB5681, Chemicon, Temecula, CA, USA) at 1:800, prolactin (cat. no. A0569, DAKO, Glostrup, Denmark) at 1:500, growth hormone (GH) (cat. no. N1561, DAKO, Glostrup, Denmark) undiluted, thyroid-stimulating hormone (TSH) (cat. no. M3503, DAKO, Glostrup, Denmark) at 1:100, and adrenocorticotropic hormone (ACTH) (cat. no. M3501, DAKO, Glostrup, Denmark) at 1:100. DRD2 immunostaining was performed with two rabbit polyclonal antibodies: Calbiochem (cat. no. 324393; Darmstadt, Germany) at 1:500, and Bioss (cat. no. bs-1008R; Woburn, MA, USA) at 1:200. Human hippocampal tissue obtained at selective amygdalohippocampectomy for hippocampal sclerosis–related temporal lobe epilepsy, known to harbor D2-positive cells, was used as the positive control (Supplementary Fig. 5). Immunohistochemical specimens for DRD2, SSTR2A, and SSTR5 were evaluated by a single pathologist.
Histomorphological featuresHistopathologic diagnosis was rendered according to the WHO Classification of Tumours, 5th edition (2022), Endocrine and Neuroendocrine Tumours, “Pituitary Tumours” section.
Case 1: Serial comparison of pituitary tumor resections at ages 10, 20, and 28 (Fig. 2a–d and Supplementary Fig. 3) showed, on HE sections, a densely cellular neoplasm composed of small round-to-oval nuclei, consistent with a PitNET. No significant cytologic atypia, tumor necrosis, or increased mitotic activity was identified at any time point. The Ki-67 labeling index was < 1% at age 20 and rose slightly to 2–3% at age 28. IHC demonstrated FSH positivity and weak/focal LH positivity at ages 10 and 20, whereas both FSH and LH were negative at age 28. SF-1 was positive, whereas PIT1 and TPIT were negative, consistent with gonadotroph lineage (Supplementary Fig. 4). Across all time points, tumor tissue was weakly positive for prolactin, whereas GH, TSH, and ACTH were negative (data not shown).
Liver biopsy (Fig. 2e–l): HE showed a dense proliferation of small round tumor cells within hepatic parenchyma, morphologically resembling the sellar tumor and supporting metastatic PitNET. Neuroendocrine markers (chromogranin A, synaptophysin, INSM1) were positive. The Ki-67 index was < 1%. As previously described, lineage markers were FSH positive and SF-1 positive, whereas PIT1 and TPIT were negative (Fig. 2 and Supplementary Fig. 4).
Case 2: Pituitary tumor (Fig. 3c–f): HE revealed papillary growth of tumor cells with round nuclei; in areas, tall columnar cells formed perivascular rosettes. No malignant features were identified. The Ki-67 index was < 1% (data not shown). IHC showed FSH positivity (Fig. 3d) with weak/focal LH positivity (Fig. 3e). SF-1 was positive, whereas PIT1 and TPIT were negative (Supplementary Fig. 4).
Case 3: Pituitary tumor (Fig. 3i–l): HE confirmed a PitNET without marked atypia, necrosis, or increased mitotic activity. IHC demonstrated FSH positivity (Fig. 3j) and LH positivity in ~ 10–20% of tumor cells (focal) (Fig. 3k). The Ki-67 labeling index was < 1% (data not shown). SF-1 was positive, whereas PIT1 and TPIT were negative (Supplementary Fig. 4).
Evaluation of DRD2 expressionAs cabergoline was effective in Case 1, DRD2 immunostaining was exploratorily performed on both the primary pituitary and metastatic liver tumors to assess the potential mechanism of drug response. To investigate expression patterns, DRD2 staining was also applied to the other cases.DRD2 expression was evaluated using the Histo-score (H-score) [6, 7], Wang’s [8], and Vieira’s score [9]. The H-score combines staining intensity (0–3+) and percentage of positive cells, with scores ≥ 50 considered positive. Wang’s score evaluates intensity (0–3) and extent (0–4), with total scores > 2 considered as positive (2–3: low, > 3: high expression). Vieira’s score categorizes the percentage of stained cells as 0 (< 25%), 1 (25–50%), and 2 (> 50%). Nuclear staining was evaluated using the Allred score [10], combining proportion (0–5) and intensity (0–3) for a total score of 0–8. Scores 0–2 were negative and 3–8 were positive. Membranous staining was evaluated using the HER2 [7, 11] and Volante’s scores [12]. The HER2 score was originally developed for evaluating human epidermal growth factor receptor-2 (HER2) expression in breast carcinoma. It applies a four-point scale (0, 1+, 2+, 3+) based on the intensity, completeness, and extent of membranous staining. A score of 0 indicates no staining or membranous staining in \(\:<\)10% of tumor cells; 1+ indicates weak or incomplete membranous staining in \(\:>\)10% of cells; 2+ indicates moderate complete staining; and 3+ indicates strong complete membranous staining. Tumors with a HER2 score of 2+ or 3+ were considered positive. Volante’s score assesses SSTR2A expression in pituitary and neuroendocrine tumors based on subcellular localization and extent of staining. It uses a four-point scale (0, 1, 2, 3). A score of 0 indicates no staining; 1 indicates cytoplasmic staining only; 2 indicates membranous staining in <50% of tumor cells; and 3 indicates circumferential membranous staining in >50% of tumor cells. For analysis, scores of 2–3 were considered positive and 0–1 negative.
Because DRD2 immunoreactivity could be antibody-dependent and some antibodies can yield non-specific or misleading patterns (e.g., apparent membranous or nuclear labeling), as previously described, we used two DRD2 (Calbiochem, cat. no. 324393; Bioss, cat. no. bs-1008R) to ensure an objective and reliable assessment, and added the comparative results in Fig. 4. In the results, for DRD2, cytoplasmic staining was predominantly observed in the PitNET and liver metastasis tissues of case 1, and in the PitNET tissue of case 3, whereas staining was minimal in the PitNET tissue of case 2. In case 3, partial nuclear staining of DRD2 was noted. Membranous staining for DRD2 was generally weak across all cases (Fig. 4). The Calbiochem antibody occasionally showed stronger cytoplasmic and focal nuclear labeling, with granular, intensely staining foci; however, overall cytoplasmic staining patterns were largely concordant between the two antibodies in samples from Cases 1–3 (Fig. 4) and in human hippocampus as positive control (Supplementary Fig. 5). Given the inherent limitations of DRD2 IHC, among the multiple scoring systems used in this study, the H-score most closely reflected the magnitude of cytoplasmic staining across cases. SSTR2A and SSTR5 expression were evaluated based on Volante’s score, and SSTR2A showed membranous staining in the PitNET and liver metastasis tissues of case 1 and in the PitNET tissue of case 3, but staining was poor in the PitNET tissue of case 2. SSTR5 exhibited only minimal membranous staining in all cases. The detailed scores for each case are summarized in the table within Fig. 4.
Fig. 4
Pathological analysis in case 1–3 . Hematoxylin and Eosin (HE) staining, and immunostaining for dopamine receptor D2 (DRD2; cat. no. 324393, Calbiochem and cat. no. bs-1008R, Bioss) and somatostatin receptors (SSTR): SSTR2A and SSTR5. In the table below, multiple scoring methods are used to assess various staining properties for each marker. The values in brackets indicate the score range. The values in parentheses indicate the corresponding interpretation (negative, positive or low/high expression). PitNET: pituitary neuroendocrine tumor
Comments (0)