
Remember me
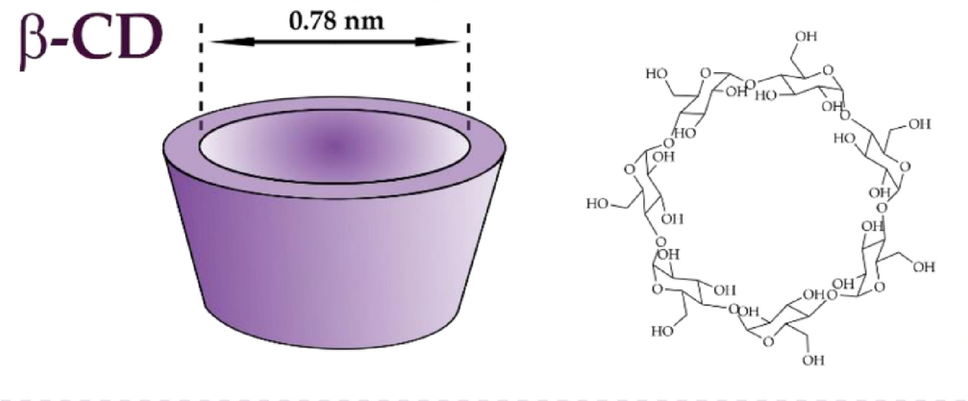

CSD search revealed the presence of a total of 293 structures containing β-CD or its inclusion complexes. In this large group, 285 structures presented the hydrates of β-CD or its complexes, with various degrees of hydration, from monohydrates to nonadecahydrates. Besides, 8 structures presented the anhydrous forms of the β-CD. In most cases (192 structures, 67%), the 1:1 host:guest molar ratio was observed, however, other values were also noticed, i.e., refocode XUBXUN (2:1) or NAJJAK (2:3). Usually, the inclusion complexes were stabilized by the presence of one or more H-bonds. Additionally, intermolecular interactions were also observed between the neighboring CD or guest molecules. Concluding, due to the Z’ > 1 in some cases, the total 437 unique β-CD conformations, originating from the crystal structures deposited at CSD, have been extracted and used as initial geometries for DFT optimization, as described in Sections "In vacuo DFT calculations" and "Implicit solvent (PCM) DFT calculations". Detailed information on the studied structures is presented in Table S1.
In vacuo DFT calculationsWhile most of the experimental studies on CD’s inclusion complexes concern their aqueous solutions, we decided to begin with the in vacuo calculations for a few reasons. First, since the structures from the CSD reflect the solid state, adding the implicit solvent model could distort the initial conformation. Second, as we have shown in our recent review, a lot of computational studies on CDs, both at the MM and QM level, are conducted in vacuo [29, 30]. The results of the calculations are presented in Fig. 2. The data are presented on histograms and a box-whisker plot for the results of DFT calculations of G values and energy with zero-point energy. Based on the graph analysis, the presence of outliers has been identified, which was also verified using the ROUT method (Q = 1%). As a result, 3 conformations (i.e., MUPNEQ01_CD, MUPNEQ_CD, HAXJIB_CD) have been detected as outliers. Even though the data do not follow normal distribution, the mean and median for the set of all G values for in vacuo calculations have similar values, namely mean: − 2682280.9 kcal/mol (95% CI [− 2682281.4, − 2682280.4]) and median: − 2682281.5 kcal/mol (95% CI [− 2682281.9, − 2682281.0]).
Fig. 2
Histogram and box-whisker plot of Gibbs free energy and electronic energy values with zero point energy (EE + ZPE) for DFT calculations performed in vacuo. The box represents the interquartile range (IQR) with whiskers representing the full range
The high differences in G values between conformations reflect corresponding structural divergences (Fig. 3a). The calculated range of the G of the studied conformations was found to be ca. 38 kcal/mol. Subsequently, conformations were grouped into clusters using hierarchical clustering based on their G values (Fig. 3b).
Fig. 3
a The superposition of all 437 β-CD molecules obtained via in vacuo calculation (hydrogen atoms not shown for clarity), b Hierarchical clustering dendrogram generated based on the similarity in G values. A vertical line on the dendrogram represents the agglomeration distance selected for further analysis
In each of the 18 selected clusters, β-CD molecules were characterized by high conformational similarity (Fig. 4a), while the major differences have been observed between the structures originating from different clusters (Fig. 4b). The range of G within each cluster was lower than 2 kcal/mol, except for Cluster_2 and Cluster_4 in which high G conformations were grouped. The number of structures per cluster was uneven, ranging from 1 (Cluster_1) to 64 (Cluster_12). The details of clusters, including their range, mean and median values with 95% CI for each cluster, can be found in Tables S4 and S5.
Fig. 4
a Superposition of β-CD conformations that belong to Cluster_18, b Superposition of conformations with the lowest G value (in vacuo) from each cluster
The graph of mean and median calculated for clusters has been presented in Fig. 5. The Shapiro–Wilk normality test of G values has been performed and the results were presented in Table S4. Based on the results, the data follow normal distribution within most of the clusters. It is worth mentioning that part of the clusters contains only a small number of conformations, making it difficult to unambiguously assess normality using standard statistical tests, thus the results differ based on used method. However, it is reasonable to assume that values within clusters may be approximately normally distributed. To verify whether the differences between clusters were statistically significant, ANOVA test was performed with Dunnett's T3 multiple comparisons correction (detailed results can be found in Table S7). The correction was added to avoid multiple comparison errors. Based on the analysis for non-single element clusters, the differences in mean values between clusters were statistically significant (except for the comparison between Cluster_2 and Cluster_3, containing high G value conformations characterized by high variability). The significant differences are also evident in Fig. 5, as 95% CIs do not overlap between clusters. A similar graph for EE + ZPE values was included as Fig. S1 in the Supplementary Information. A statistical comparison between DFT (in vacuo) and COMPASS III relative conformer energies for all CSD-derived structures gave a correlation coefficient of R ≈ 0.45, indicating moderate agreement. This level of agreement is consistent with the general-purpose design of COMPASS III, which aims at broad transferability rather than system-specific accuracy, but it also highlights the challenges of reliably modeling flexible carbohydrate macrocycles. This limitation should be kept in mind when applying such force fields to β-CD systems.
Fig. 5
Mean (red) and median (blue) of G values calculated using in vacuo approach for each cluster. The error bars represent 95% CI. The structures of most and the least stable conformations were presented. Statistical analysis was performed using Brown–Forsythe and Welch’s ANOVA with Dunnett’s T3 correction for multiple comparisons
Implicit solvent (PCM) DFT calculationsAs the CDs are mostly used for their abilities to form inclusion complexes in aqueous solutions, the addition of the solvation effects is usually applied when modeling such systems, both at MM and QM levels. According to [29], PCM implicit solvent model is the method of choice for the DFT calculations of CDs and their complexes. For example, it has been shown that, when combined with an appropriate DFT functional and basis set, the inclusion of PCM implicit solvent model can significantly increase the accuracy of the calculations of ΔG of complex formation [40]. The results of the geometry optimization of the structures, including the PCM solvation, are presented in Fig. 6. Correspondingly to the in vacuo approach, outliers were identified in the graph and tested using the ROUT method (Q = 1%), where 3 conformations (MUPNEQ01_CD, MUPNEQ_CD, HAXJIB_CD) have been detected as outliers. The mean and median for the full range of G values: mean: − 2682322.7 kcal/mol (95 CI [− 2682323.1, − 2682322.3]), median: − 2682322.9 kcal/mol (95% CI [− 2682323.7, − 2682322.7]. Despite deviation from normal distribution, mostly due to the presence of outliers, the median value remains within 95% CI of the mean, suggesting reliability in mean estimation.
Fig. 6
Histogram and box-whisker plot of Gibbs free energy and electronic energy values with zero point energy (EE + ZPE) for DFT calculations with implicit solvation model PCM. The box represents the interquartile range (IQR)with whiskers representing the full range. The median (square) and mean (cross) of the full range were presented
All 437 conformations have been overlapped to present the spectrum of obtained conformers (Fig. 7a). The calculated range of the G of the studied conformations was found to be ca. 40 kcal/mol, slightly larger than in the case of in vacuo calculations (38 kcal/mol). Subsequently, conformations were divided into clusters using hierarchical clustering based on their G values (Fig. 7b).
Fig. 7
a The superposition of all 437 β-CD molecules obtained via PCM calculation (hydrogen atoms not shown for clarity), b hierarchical clustering dendrogram generated based on the similarity in G values. A vertical line on the dendrogram represents the agglomeration distance selected for further analysis
Within each of 17 selected clusters, β-CD molecules were characterized by high conformational similarity (Fig. 8a), while major differences have been observed between the structures originating from different clusters (Fig. 8b). The range of G within each cluster was lower than 2 kcal/mol, except for Cluster_4, for which the range was 3.4 kcal/mol. The number of structures per cluster was uneven, ranging from 1 (Cluster_1, Cluster_2, Cluster_3) to 58 (Cluster_11). The details of each of the clusters, including its range, mean and median values with 95% CI, can be found in Tables S2 and S3.
Fig. 8
a Superposition of β-CD conformations that belong to Cluster_17, b superposition of conformations with the lowest G value (PCM) from each cluster
For each cluster, mean and median values of G value were calculated and the results were presented in Fig. 9. Detailed information, including results of Shapiro–Wilk normality test, can be found in Table S2. Similarly to the in vacuo approach, in many clusters, the normality test was passed; however, some clusters contain a small number of elements, making it difficult to test normality via standard tests. The differences between clusters were tested using ANOVA analysis with Dunnett's T3 multiple comparisons correction (detailed results can be found in Table S6). The differences in mean values between clusters were significant, except for the comparison between Cluster_4 vs Cluster_5 and Cluster_6. Notably, Cluster_4 contains high G value conformations characterized by high variation. The significant differences are also noticeable in Fig. 9, as 95% CIs do not overlap between clusters. A similar graph for EE + ZPE values was included as Fig. S2 in the Supplementary Information.
Fig. 9
Mean (red) and median (blue) of G values calculated using PCM approach for each cluster. The error bars represent 95% CI. The structures of the most and the least stable conformations were presented. Statistical analysis was performed using Brown–Forsythe and Welch’s ANOVA with Dunnett’s T3 correction for multiple comparisons
Comparison of in vacuo and implicit solvent DFT calculationsA moderate significant correlation was observed between G values calculated in vacuo and using the PCM model (Spearman’s r = 0.60, 95% CI 0.53–0.65, p-value (two-tailed) < 0.0001). Although data do not follow normal distribution, the Pearson’s correlation coefficient has also been tested and the results are similar to non-parametric Spearman correlation (Pearson’s r = 0.58, 95% CI 0.52–0.64, p-value < 0.0001), suggesting an approximately linear and monotonic correlation between those two variables. Thus, linear regression analysis has been performed and the equation has been presented in Fig. 10. While the inclusion of implicit solvent during calculations affects both the process of geometry optimization, thus the final conformation, in this study, a moderate linear correlation (R2 = 0.34) between the G of the structures optimized in vacuo and using the PCM solvent model has been observed. It is worth mentioning that the same 3 conformations were assessed as outliers in vacuo and PCM approach. Remarkably, excluding outliers (i.e., MUPNEQ01_CD, MUPNEQ_CD, HAXJIB_CD) did not improve the goodness of fit; therefore, the analysis was presented for the whole set of conformations. Addition of the implicit aqueous conditions resulted in higher deviation of normal distribution, leading to the increase in the number of clusters by one, and substitution of the lowest free energy conformation (XUJVIK_CD1) by another one (KUFHOI_CD). Also, the range of the G increased by 5%. Although the overall correlation between vacuum and PCM energies is moderate, the redistribution of conformers among clusters indicates that solvation can shift the relative stability of families rather than simply preserving cluster membership.
Fig. 10
Correlation between Gibbs free energy values of the structures optimized in vacuo and PCM solvent model. Red solid line represents linear regression. Dot lines represent 95% CI bands of the best-fit line
Conformational search using simulated annealing and quench calculationsAnnealing (AD) and quench (QD) dynamics are among the most popular methods used for the conformational search. Annealing dynamics consists of a dynamics simulation where the temperature periodically increases from an initial temperature to a mid-cycle temperature and back again. This procedure allows for gradual minimization of the energy without trapping the structure in a conformation that represents a local energy minimum. The higher temperature stages allow the simulation to overcome energy barriers to move into other low-energy areas. Quench dynamics alternates periods of dynamics simulation with a quench period that minimizes the structure. This provides a means of searching conformational space for low-energy structures.
It should be emphasized that the AD/QD runs were performed as a supplementary exercise to the CSD-based survey, and were not designed to achieve exhaustive sampling of the β-CD conformational space. The purpose of these trajectories was to provide a small, independent set of trial structures for comparison, rather than to replace large-scale MD simulations.
In this work, both AD and QD simulations have been used for a conformational search of β-CD. Additionally, two distinct conformations of β-CD have been used as initial for those calculations, namely XUJVIK_CD1 and MUPNEQ01_CD. Those two structures were characterized by the lowest (XUJVIK_CD1) and highest (MUPNEQ01_CD) G values, respectively, according to the in vacuo DFT calculations. By choosing two diverse conformations as initial, we have additionally increased the number of calculated conformations during AD and QD and the area of the PES of β-CD that has been effectively screened. Ten and eleven low-energy structures have been generated from AD and QD, respectively, for each of those two conformations (XUJVIK_CD1, MUPNEQ01_CD). Those newly obtained conformations have then been optimized at the DFT level. The results of those calculations can be found in Table 1. The conformations generated during AD and QD are named with “A” and “Q”, respectively. To distinguish conformations generated using MUPNEQ01_CD as the initial structure, the name of the new conformations includes the suffix “_M”.
Table 1 Gibbs free energy and electronic energy with zero-point energy (EE + ZPE) and relative Gibbs free energy (referenced to the most stable conformer) of results obtained from DFT optimizations of β-CD conformations generated via Quench and Annealing simulations, ordered from lowest to highest Gibbs free energy valuesAnalysis of the results in Table 1 revealed that the choice of the initial conformation for both AD and QD affects the final outcomes of those conformational searches. Choosing the conformation of less negative G (MUPNEQ01_CD) resulted in the structures that were characterized by the G similar to those of the structures from the range from Cluster_1 to Cluster_10. However, surprisingly, starting from the thermodynamically most stable, lowest G conformation (XUJVIK_CD1), we obtained the conformations of the G lower than any of the conformations extracted from the crystal structures that have been divided into new clusters with a range of G value up to 1.1 kcal/mol.
Particularly, conformations Q_1, A_5, A_2 and Q_2, during the DFT optimization, have converged into a single one, characterized by the G lower by 9 kcal/mol than conformation XUJVIK_CD1. The overlap of Q_1 and XUVJIK_CD1 conformations has been presented in Fig. 11. We found it intriguing why those low G conformations have not been found in the experimental structures. While this could be explained by the fact that the formation of the inclusion complex is driven by the minimization of the G of the whole complex, and not its particular components, non-complexed β-CD molecules were also included among the DFT-optimized structures. The other possible explanation can be that due to the intermolecular forces, mostly H-bonds, formed between the β-CD molecules in the solid state, the lowest G conformation in the solid state and the implicit solvent calculations are not the same ones.
Fig. 11
Superposition of Q_1 (gray) and XUVJIK_CD1 (green) conformations
It remains an open question why the lowest G conformation, according to the DFT results, is not observed experimentally, at least in one of the solid state structures. One potential reason may be attributed to the kinetic trapping effect influenced by other factors, such as the solvent shell. It may be linked to crystal packing and intermolecular interactions. It is important to note that calculations were conducted for isolated molecules, however, in crystalline structures, the presence of additional molecules, such as guests or solvent molecules, can influence the conformation of β-CD. Nevertheless, further analysis is required to explore this topic.
Is there a correlation between the structure of the guest molecule and β-CD conformation?To explore the possible correlation between the structure of the guest molecule and the conformation of the β-CD in its inclusion complex, a wide variety of descriptors have been calculated for each of the guests extracted from all studied complexes (Table S1). It is worth noting that due to the highly dynamic nature of the guest in certain structures, its conformation could not be reliably determined. Consequently, such entries were excluded from the analysis. In case of Z′ > 1, and guest conformation was registered only in one of the β-CD complexes, the structure of the guest was duplicated and used for analysis of both β-CD conformations. Consequently, 368 β-CD conformations and guests were tested, where 53 of the guest molecules with non-zero charge. The Spearman correlation between quantitative variables representing molecular properties and G value calculated in vacuo, as well as using PCM solvation model, was investigated. The results of univariable analysis that show only significant correlations were listed in Table S12. Detailed results of the analysis, including the 95% confidence intervals of the Spearman correlation coefficients (r), p-values are presented in Tables S9 and S10. Since 164 properties were tested using univariable analysis, correlations that were not statistically significant are not reported therein for the remaining properties.
While indeed a significant correlation between certain properties of the guest molecule and the G value of the host β-CD has been observed, its strength varies depending on the particular property. It ranges from weak correlations observed for properties within categories such as Fast descriptors, whereas moderate strength of correlations were found for Jurs Descriptors calculated solely for charged guest molecules. Interestingly, for the majority of the tested properties, statistically significant correlations were observed with the G value calculated in vacuo, whereas the same properties did not show statistically significant correlation with G value calculated using PCM solvation model, and vice versa (see Table S12).
Although several statistically significant correlations have been identified between guest molecular properties and the G values of β-CD, the strength of the correlation was found to be generally weak. This suggests these relationships are exploratory in nature and should not be interpreted as predictive models. The possible further exploration of this topic includes the application of AI methods, particularly ML, to create a model that would accurately predict the conformation of the CD, based on the properties of the guest molecule. However, this aim was not within the scope of this work. Besides, this task might be even more challenging to accomplish, taking into account that the in some of the cases of Z′ > 1 and 1:1 molar guest:host ratio, the two significantly different conformations of β-CD were present, i.e. ASEVUQ_CD1 (Cluster_13, in vacuo) and ASEVUQ_CD2 (Cluster_6, in vacuo). It should be stressed that these correlations, even when moderate (e.g., Jurs descriptors for charged guests), are exploratory in nature and not predictive models. Future multivariate analyses such as principal component analysis (PCA) or partial least squares (PLS) regression may provide more interpretable structure–property relationships, but this was beyond the scope of the present study.
Final remarks and implications of the resultsTaking into account the high conformational flexibility of the β-CD, the large number of minima on its PES was expected. However, the analysis of 874 DFT optimized β-CD conformations, originating from the experimentally derived crystal structures, revealed that the ranges of the G value at the level of c.a. 40 kcal/mol, depending on the approach used, which is a large value. That information can be useful and should be considered in a variety of computational works on β-CD and its inclusion complexes.
For example, in cases when the crystal structure of the inclusion complex is not known, molecular docking is commonly used to predict it. Quite often, the structure of β-CD hydrates (usually BCDEX10 or BCDEXD03) is used for that purpose, however, in some works the choice of structure seems to be quite random, or even the sketched and geometrically optimized β-CD is being used. Besides, even if the low G conformation of β-CD is being used for docking, this paradoxically may not be the best choice, as we have shown in this work that the conformations found in the experimental crystal structures are not of the lowest G. The choice of the β-CD conformation used for molecular docking may have a significant impact on the received results, both the structure of the complex and the docking score. This influence may be even more important than in the case of molecular docking to protein structures due to the relatively very large number of flexible H-bond donors and acceptors in the binding grid of β-CD.
As chiral molecules, CDs are widely applied in various enantioselective methods, with β-CD playing a major role in this field. As highlighted in our recent review, even small differences in binding affinity between enantiomers, less than 1 kcal/mol, can be sufficient to achieve effective chiral recognition using β-CD as a chiral selector [10]. Given the spectrum of conformations of β-CD in the range of ca. 30–40 kcal/mol, the selection of different conformations in molecular modeling studies may likely lead to contradictory results. Notably, use of molecular docking to explore enantioselective binding mechanisms is an emerging area in computational chemistry [25]. In parallel, numerous studies aim to predict the binding affinity of various molecules to CDs. Inclusion complexes of CD are particularly well suited for theoretical exploration, as their binding thermodynamics can be precisely measured using isothermal titration calorimetry (ITC). As a result, host–guest complexes with β-CD are becoming reference models for evaluating the accuracy of noncovalent interaction predictions in molecular modeling [41].
The conformational clusters proposed in this study offer a useful resource for improving the prediction of β-CD inclusion complexes, e.g., drug inclusion simulations, as the conformational clusters derived here provide a representative ensemble of β-CD geometries. Using one conformer from each cluster may allow docking studies to capture the diversity of possible host shapes, rather than relying on a single frequently used conformation. This diversity suggests that relying on a single conformation may overlook relevant binding poses and reduce modeling accuracy.
Another common computational approach consists of calculating the energy (E), or free energy and other thermodynamic quantities, usually at the DFT level, of inclusion complex formation based on the reaction:
$$ \upbeta} + } \rightleftharpoons }@\upbeta} $$
using equation: Ecomplexation = EL@ β-CD − Eβ-CD − EL.
Again, to calculate the Eβ-CD various conformations of β-CD, usually extracted from one of the multiple previously deposited crystal structures, are being used. Also in this case, the choice of the conformation may have a significant impact on the results.
However, we are also aware of the limitations of this work, for example the choice of solely one DFT functional and implicit solvent model. However, due to the very large number of structures, performing the calculations using the other combinations was not feasible. The choice of both DFT functional and solvent model was based on our earlier experience [42] and literature review [29]. It should be emphasized that our results are inherently biased toward crystallographic conformers of inclusion complexes, and the limited AD/QD sampling cannot recover the full conformational ensemble of free β-CD in aqueous solution. Thus, the present study should not be interpreted as a complete description of β-CD flexibility in water. It should also be noted that the RRHO treatment neglects conformational entropy, which can be a substantial component of the total free energy for flexible carbohydrate macrocycles.
Comments (0)