
Remember me

This study examines and compares the effect of fermentation on the extraction of phenolics and antioxidant activity from fig leaves, lemon myrtle leaves, olive leaves and olive flowers, rosemary leaves, common sage and white sage leaves. A difference, in terms of the number of bands and their intensity in HPTLC fingerprints of nonfermented and fermentation-assisted extract, was observed in the ferric chloride chelating assay (Fig. 1) and in the DPPH⋅ assay (Fig. 2). The ferric chloride chelating assay is commonly used to determine the presence of phenolic compounds in samples. It is a visual colorimetric assay based on the chelation power of ferric ions to form complexes with phenols that are violet or blue in color, whereas flavonoids produce a greenish-blue hue [10]. The assay can also detect some carbonyl compounds with high enol content. However, the coloration fades rather quickly with this stain, so observations should be recorded immediately. DPPH⋅ assay was used to visualize the antioxidant activity. When compounds with antioxidant properties are separated on a plate and treated with DPPH, they appear as bright-yellow zones against the purple background of the reagent. DPPH is a stable free radical with a deep purple color. When it reacts with an antioxidant, it gets reduced and changes color to yellow. The total area of the colored bands in the iron chelating assay and the total areas of yellow zones in the DPPH free radical assay were used to compare the total phenolic content and the antioxidant activity in extracts (Table 1).
Fig. 1
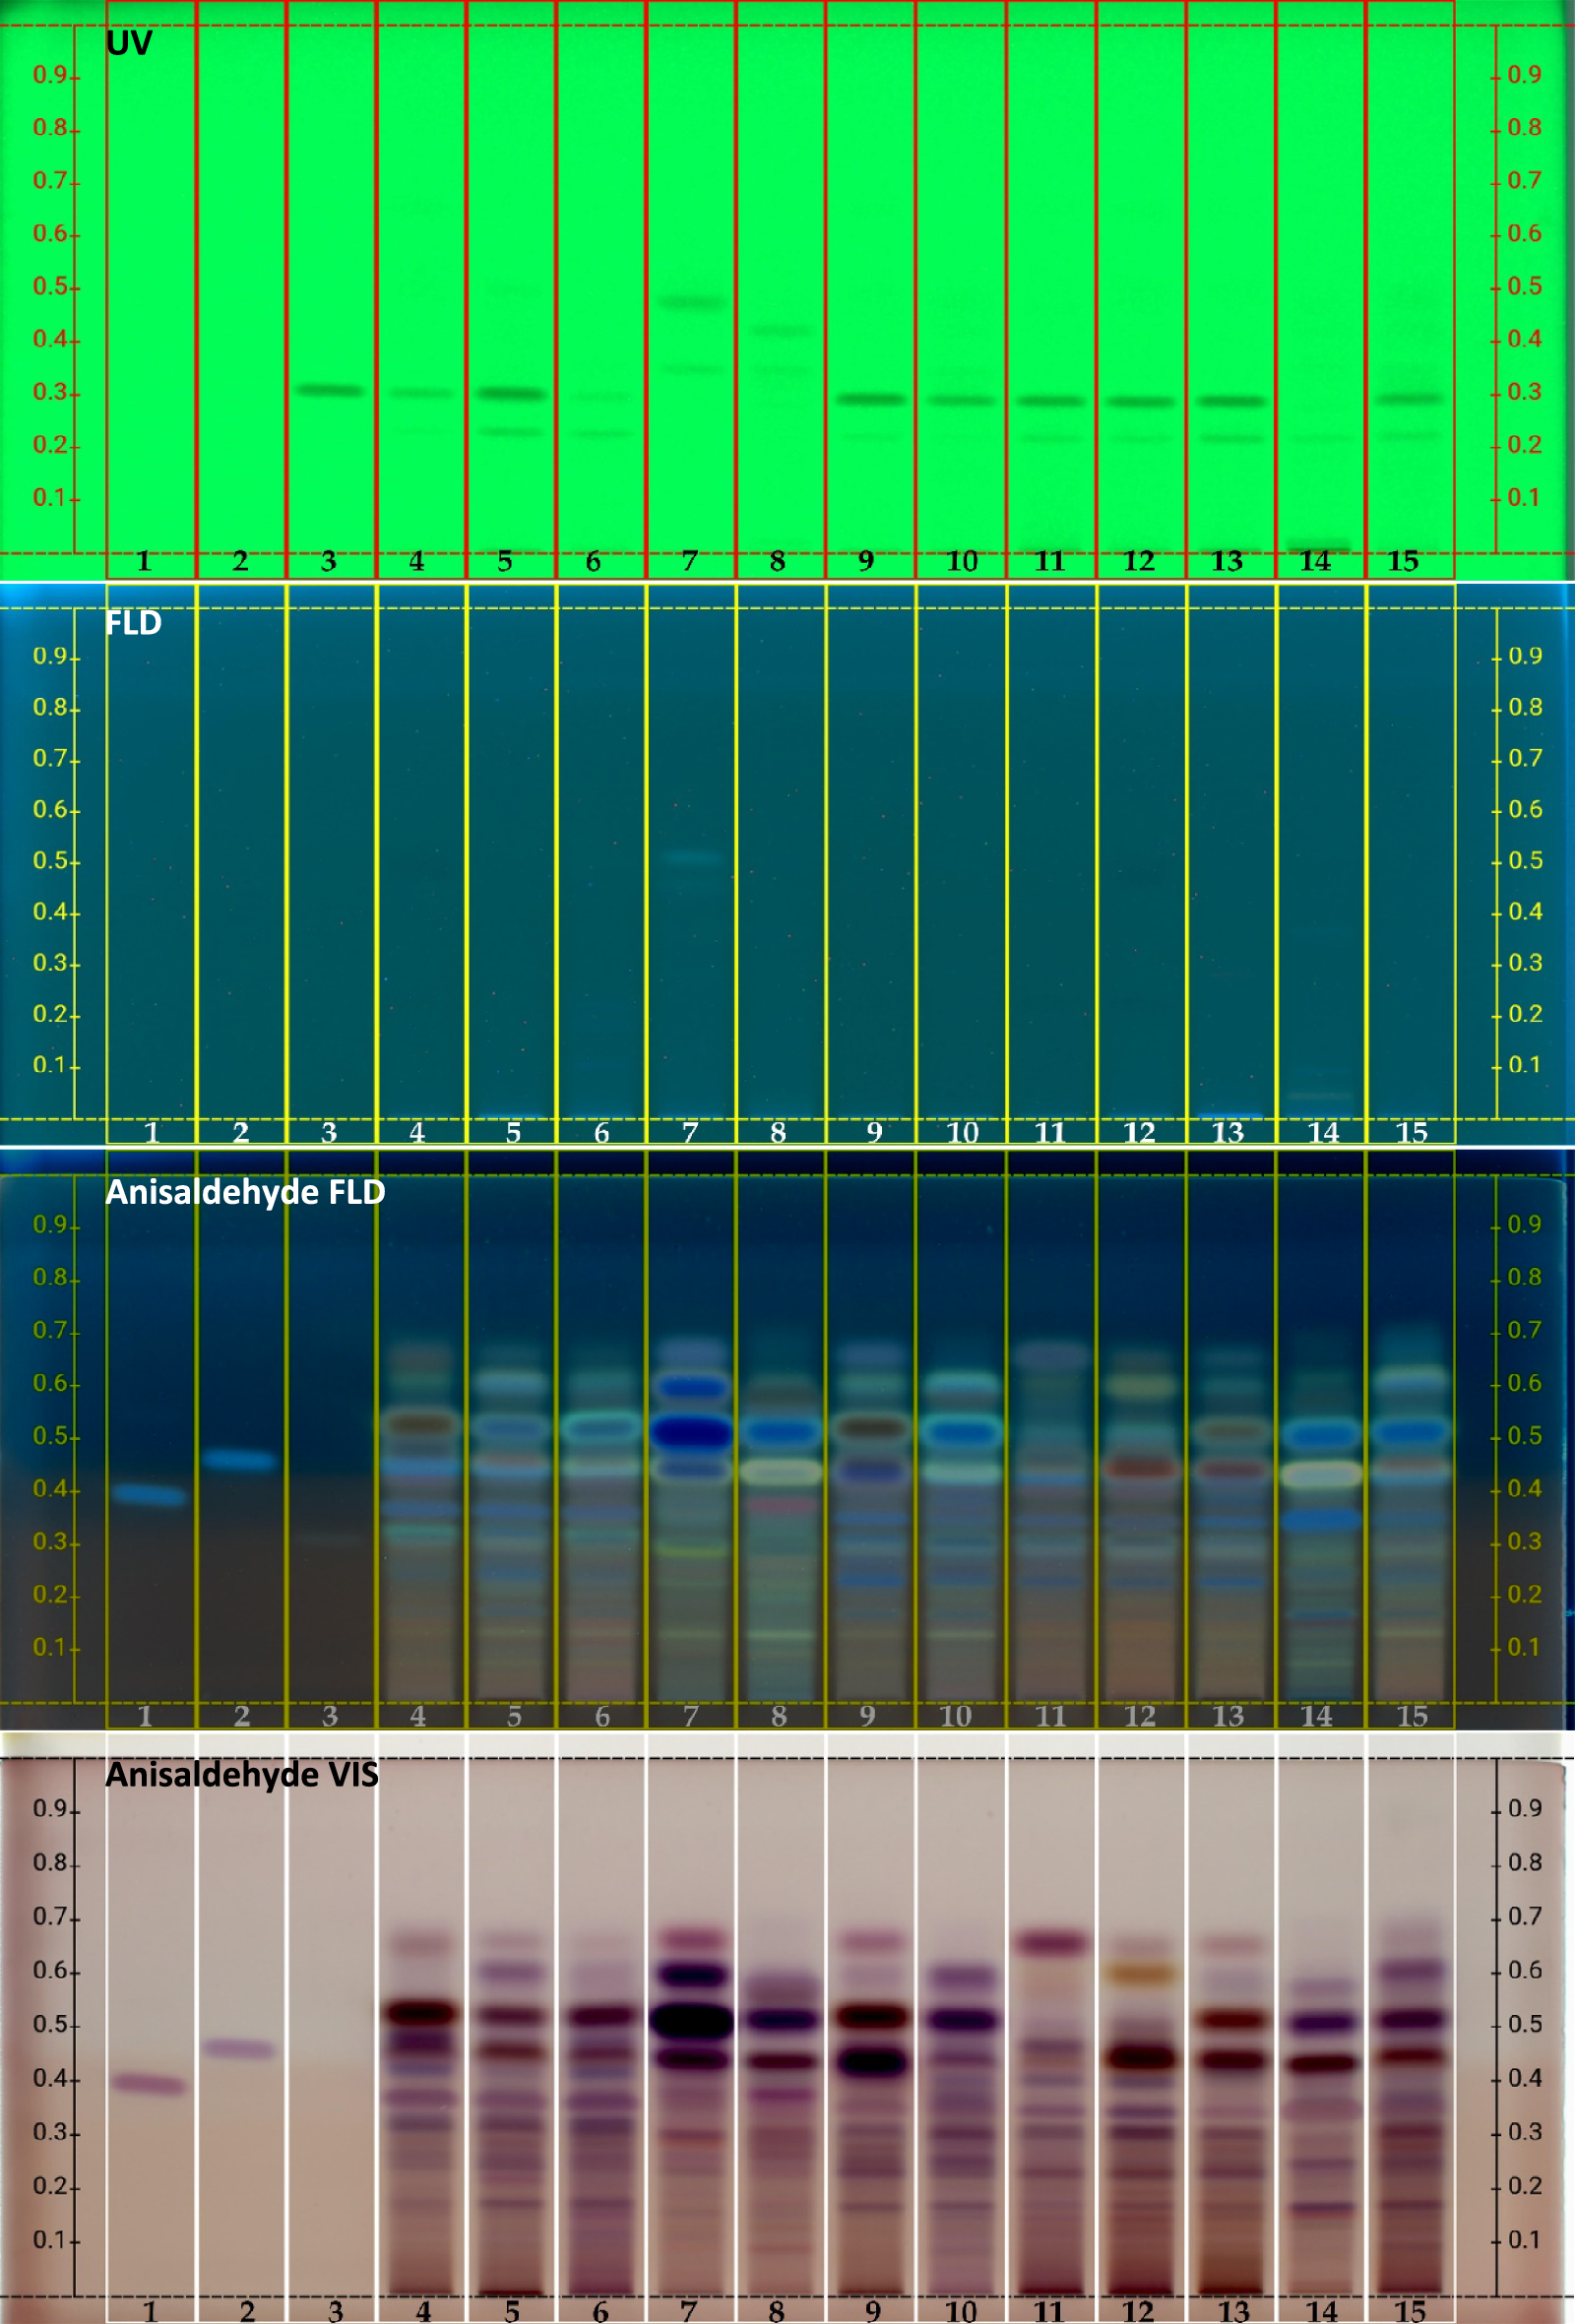
HPTLC fingerprints in ferric chloride chelating assay of nonfermented (track 1) and fermentation-assisted (track 2) extract with superimposed chromatogram from fig leaf (a), lemon myrtle (b), olive flower (c), olive leaf (d), rosemary (e), common sage (f), and white sage (g). Mobile phase: n-hexane‒ethyl acetate‒glacial acetic acid (15:9:1, V/V)
Fig. 2
HPTLC fingerprints in DPPH assay of nonfermented (track 1) and fermentation-assisted (track 2) extract with superimposed chromatogram from fig leaf (a), lemon myrtle (b), olive flower (c), olive leaf (d), rosemary (e), common sage (f), and white sage (g). Mobile phase: n-hexane‒ethyl acetate‒glacial acetic acid (15:9:1, V/V)
Table 1 Total phenolic content and antioxidant activity of the extracts expressed as areas of colored bands in ferric chloride colored test and areas of yellow zones in DPPH free radical assayThe results suggest that fermentation significantly increased the total phenolic content in ferric chloride assay only in the olive leaf and rosemary leaf extracts. Ferric chloride chelating assay is a basic method commonly used to screen for phenolics in a sample. A color change in a ferric chloride assay indicates the presence of phenolic groups due to the formation of a colored complex between the iron(III) ions and the phenolic compound. If positive, the ferric chloride test indicates an increased concentration of phenols in the sample. However, a lack of color in ferric chloride test may be not only due to the absence of reactive phenolic groups but also due to a very low concentration of phenolic compounds. Compounds with a phenol group(s) will form a violet, purple, blue, green, or reddish-brown color with neutralized ferric chloride solution [11]. Most phenolics can effectively chelate iron(III), especially those with adjacent hydroxyl groups (such as catechol or galloyl groups), forming stable complexes, The spatial arrangement of the hydroxyl groups is crucial for the chelation process, as it allows the formation of stable ring structures with the metal ions. There is a very little interaction between the transition metal ions and aromatic molecules with nonadjacent OH groups. The actual structure of these complexes is debated [12]. Hantzsch and Desch have shown [13] that an active hydroxyl group is essential for the color reaction. The ferric iron-phenol colors are due to the formation of complex coordinated negative ions of the type [Fe(ArO)6]3−, wherein OAr− represents the ionized phenol [11]. Since ferric chloride is acidic in nature, the ferric chloride solution reagent must be neutralized as only a phenoxylate anion will chelate iron(III). Thus, the stoichiometry and color of the iron-phenol complexes is pH-dependent, as the complexing capacity will increase at higher pH. At pH 8 and above, red-colored 1:3 iron‒polyphenoxylate complexes dominate [14]. At slightly acidic pH (5–6.5), each iron(III) is typically bound to two to three phenoxylate ligands, creating complexes with a blue-purple hue. Polyphenols bind iron in a 1:1 ratio at higher acidic pH values (less than 4), creating blue-green complexes [14]. As fermented plant materials have a pH level that is typically between 3.87 and 4.20, this may lead to a false negative result with the ferric chloride assay [15]. Freeze-drying of the plant material after fermentation does not remove lactic acid, but it can be a useful method for preparing samples for subsequent extraction.
Comparing fermented with nonfermented extracts, the antioxidant activity was higher in all extracts except in lemon myrtle. Antioxidant activity in lemon myrtle leaves is associated with the presence of citral, a monoterpene aldehyde. Lemon myrtle leaves contain the highest amount of citral of any plant known in the world [16]. However, citral decomposes rapidly at acidic pHs through various oxidation and cyclization reactions [17]. Fermented plant materials are typically acidic. Thus, lactic acid, released during fermentation, will lead to acid-catalyzed cyclization and the oxidative degradation of citral. The highest increase in the antioxidant activity was measured in rosemary leaf extract (by 3.5 times), fig leaf extract (by 3 times), and in olive flower extract (by 2.5 times). When compared with olive leaf extracts, olive flower extracts have a higher increase in antioxidant activity, in contrast to phenolic content that was more increased by fermentation in the leaf extract. The different results of the antioxidative activity may be due to the fact that some compounds have a higher antioxidant capacity.
These differences imply both qualitative and quantitative differences between nonfermented and fermentation-assisted extracts. They also confirm that fermentation effectively enhances the release of phenolics with antioxidant activity [4].
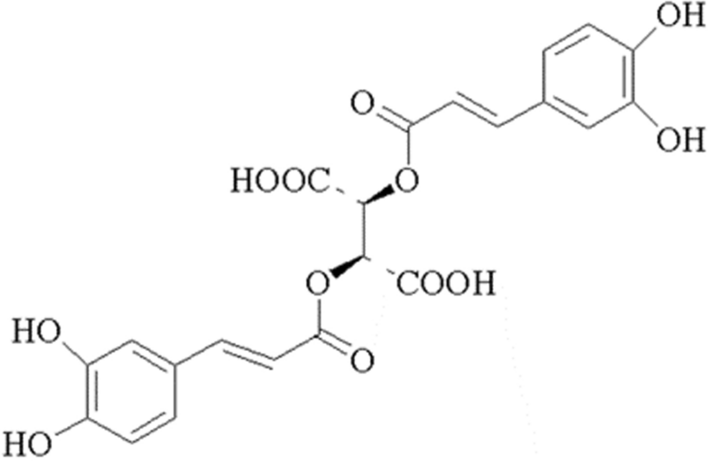
As phenolic compounds are mostly polar molecules, a high-to-moderate positive correlation is commonly observed between total phenolic contents and in vitro antioxidant assays in both methanol and aqueous extracts. However, although methanol and ethanol commonly show a higher percentage of extraction yield, acetone and ethyl acetate extracts, although having lower extraction yield, have higher phenolic content and antioxidant activity [5, 18]. Ethyl acetate as a universal and a green solvent was selected for this study, since it offers a balance between the solubility of lipophilic and hydrophilic antioxidants. Generally, highly hydroxylated phenolic aglycones are soluble in alcohols (ethanol and methanol), water, and hydroalcoholic mixtures, whereas highly methoxylated and less polar aglycones are extracted into less polar solvents (acetone, chloroform, and ethyl acetate) [19]. The lack of correlation between the total phenolic content and antioxidant capacity in our plant samples also suggests that phenolics are not the only contributors to antioxidant activity. It has been suggested that the presence of carnosic acid and carnosol (Fig. 3) contribute to more than 90% of the antioxidant properties in rosemary extract [20]. Carnosic acid is a lipophilic antioxidant found in rosemary and sage, highly soluble in ethyl acetate. Since it contains a phenolic group, carnosic acid is often classified as a phenolic compound. However, its biosynthetic pathway, cellular distribution, roles, and solubility properties substantially differ from other phenolics groups and instead resemble a terpenoid [21]. Fig leaves contain high levels of furanocoumarins [5, 22]. Coumarins are lactone-based bicyclic aromatic compounds that are analogs of 2H-1-benzopyran-2-one (coumarin). Their highly conjugated system of double bonds is responsible for their relatively high free radical scavenging activity and makes them strong antioxidants [23]. Bergapten and psoralen (Fig. 3) are the primary furanocoumarins reported in the fig tree. Recent studies found high concentrations of these two metabolites in the bark and woody parts of the fig tree and even higher concentrations in leaves [24].
Fig leaf and olive leaf [25] contain a notable amount of p-coumaric acid. The Lamiaceae plants, such as rosemary and sage, contain a high levels of rosmarinic acid, a potent antioxidative polyphenol [26]. Rosmarinic acid is known to hydrolyze (break down) during fermentation, when exposed to the enzymes produced by probiotic lactic acid bacteria. Hydrolysis of the ester bond in rosmarinic acid releases caffeic acid and 3,4-dihydroxyphenyllactic acid [27]. Caffeic and p-coumaric acid are both phenolic acids that are derivatives of cinnamic acid and are known for their antioxidant properties [28]. The presence of an additional hydroxyl group in the ortho position (catechol) in caffeic acid enhances its antioxidant activity owing to an increased stabilization of resonance and formation of o-quinone (Fig. 3) [29].
Fig. 3
Chemical structures of psoralen (a), bergapten (b) carnosic acid (c), carnosol (d), p-coumaric acid (e), caffeic acid (f) and its o-quinone (g)
Differences in phenolic fingerprint profiles (Fig. 1) and antioxidant (Fig. 2) fingerprint profiles between nonfermented and fermented extracts are primarily observed in the lower parts of chromatograms, where more polar compounds such as phenolic acids are expected to be present.
The most distinctive changes in fingerprints are observed in the middle part of the chromatograms from RF = 0.2‒0.5, corresponding to the RF values of phenolic acids such as rosmarinic, caffeic, coumaric, and maslinic acids (Fig. 4). Plant phenolics can be classified into simple phenols, phenolic acids (benzoic acids and cinnamic acids), and flavonoids. Phenolic acids are the main bound, unextractable, phenolic compounds in plants. They serve as building blocks for the cell wall matrix and support the formation of rigid cell wall structures by cross-linking insoluble macromolecules such as cellulose. The increased antioxidant activity in the fermentation-assisted rosemary extract can be linked to increased extraction of rosmarinic acid and depolymerized lignin [3]. Microbial and enzymatic catalysis are clean and efficient methods for lignin depolymerization. Typically, lignin bioprocessing involves the decomposition of lignin into lignin-based aromatics through the action of extracellular microbial enzymes [30]. In contrast, fig leaves contain high amounts of p-coumaric acid, as well as 5-O-caffeoylquinic acid and ferulic acid, which are potent antioxidants [31].
Fig. 4
Detection of phenolic and triterpenoid acids. HPTLC detection under 366 nm (tracks 1, 4, and 6), under 254 nm (track 3) and under white light after derivatization with anisaldehyde‒sulfuric acid regent (ASA) (tracks 2, 5, and 7). Track 1, chlorogenic acid; track 2, rosmarinic acid; track 3, gallic acid (lower) and caffeic acid (upper band); track 4, caffeic acid; track 5, coumaric acid; track 6, coumarin; and track 7, maslinic acid (lower band) and oleanolic acid (upper band). Mobile phase: n-hexane‒ethyl acetate‒glacial acetic acid (15:9:1, V/V)
Comments (0)