
Remember me
Quantitative MR imaging was performed by using a multi 2D axial MR-STAT sequence to map multiple parameters (e.g. T1, T2, and PD) simultaneously from a five-minute full-brain scan [7, 15]. The MR-STAT sequence is a spoiled gradient echo acquisition method that uses a non-selective inversion pulse followed by flip angles varying between 0° and 90° in concomitance with a Cartesian-encoded sampling.
For the MR-STAT, the problem can be written in a matrix format with a factorization of the time-domain signal [19]:
$$\underset}\frac^_}_^UY(_)^(_)\right\Vert }_^$$
(1)
where \(D\in }^_\times _}\) is the measured signal, \(_\) is the number of voxel in phase encoding (y) direction, \(_^\in }^_\times _}\) is the diagonal phase encoding matrix for the \(i\)-th line of voxel in y direction, \(U\in }^_\times _}\) is the SVD-based compression matrix for echo time signal, \(Y(_)\in }^_\times _}\) is the compressed echo time signal for the \(i\)-th line of voxel, \(^(_)\in }^_\times _}\) is the readout encoding matrix for the \(i\)-th line of voxel.
The reconstruction of \(\alpha\) (i.e. T1, T2, and proton density maps) was performed according to the alternating direction method of multipliers (ADMM) method present by Liu et al. [19].
Physics-based FLAIRA physics-based signal model that is fully determined by the quantified tissue parameters and sequence parameters was used for the synthetic FLAIR images [7, 20]:
$$S_ = PD.\frac }}} \right)}} + e^ }}} \right)}} }} }}} \right)}} \cos \theta }}.e^ }}} \right)}}$$
(2)
where \(PD\) is proton density, \(TI\) is inversion time, \(TR\) is repetition time, \(TE\) is echo time, \(_\) is longitudinal relaxation time, \(_\) is transverse relaxation time, \(\theta\) is flip angle.
The process to generate images in this way is referred to as “physics-based” synthetization. Previously published studies demonstrated that physics-based synthetic FLAIR images show a sub-optimal lesion appearance compared to conventional FLAIR images due to certain un-modeled physical effects, including but not limited to: magnetization transfer (MT), partial volume, diffusion, and susceptibility [3, 9].
One dominant effect contributing to the contrast mismatch is related to MT. The MT effect arises from the interaction between protons in a “free pool” (bulk water) and a “bound pool” (protons bound in proteins and other large macromolecules). Although these pools share the same central resonance frequency, the bound pool has a much broader spectral width, allowing it to be selectively saturated by off-resonance power deposition [21]. In TSE images, strong MT effects are evident due to long echo trains with multiple refocusing pulses, which result in off-resonance power deposition in slices adjacent to the excited slice [22, 23]. In contrast, MT effects are expected to have a lower influence on gradient echo based MR-STAT acquisitions, which include only a single refocusing pulse.
While it is possible to extend the quantitative imaging protocol to map these additional effects, the scan time can become impractical, and the physical modeling can be challenging. As a result, in the following section we will introduce an alternative synthetization method.
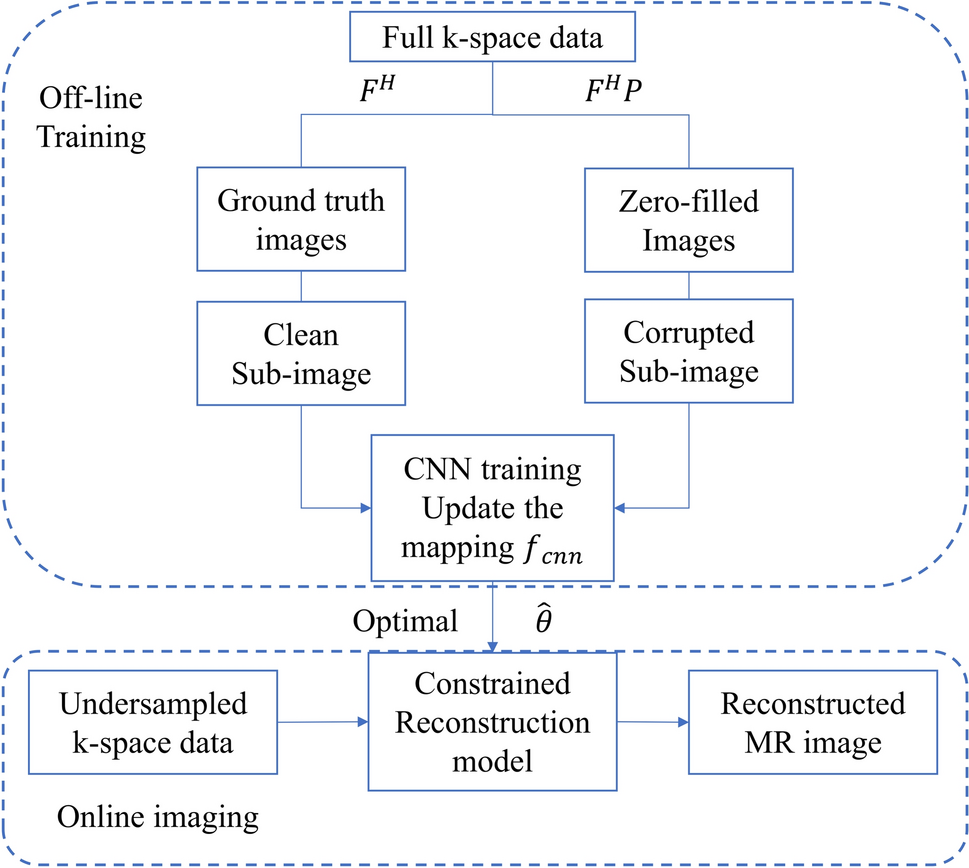
Hybrid frameworkThe proposed “hybrid” acquisition and reconstruction procedure consists of the following five steps (see Fig. 1):
Fig. 1
Flowchart of the proposed hybrid FLAIR synthetization method
Step 1: full brain MR-STAT acquisition (five minutes) and undersampled acquisition (same field of view (FOV) and resolution of the MR-STAT sequence) of conventional FLAIR data. The MR-STAT reconstruction is represented by Eq. (1).
Step 2: preliminary physics-based synthetic FLAIR images are reconstructed with MR-STAT quantitative parameter maps (T1, T2 and proton density) as input. See Eq. (2).
Step 3: registration and brain-only extraction. We apply a registration step by using a rigid transformation model with the MATLAB inbuilt ‘‘imregister’’ function to align the conventional low resolution FLAIR images to the physics-based synthetic FLAIR images. Subsequently, we apply a BET (Brain Extraction Tool) from the FSL toolbox to remove the skull area [24]. The fractional intensity threshold is set to 0.5. This step eliminates artifacts caused by high-intensity signals in extra-cranial and non-brain tissues. The removed skull area will be reinserted in step 5.
Step 4: K-space normalization (see Eq. (3)) and combination (see Eq. (4)) are performed, where the central region (contrast information) of the physics-based FLAIR k-space is replaced by the ultra-undersampled conventional FLAIR k-space.
Step 5: the hybrid FLAIR image is finally obtained by taking the Fourier transform of the combined k-space and reinserting the skull region from the physics-based FLAIR image.
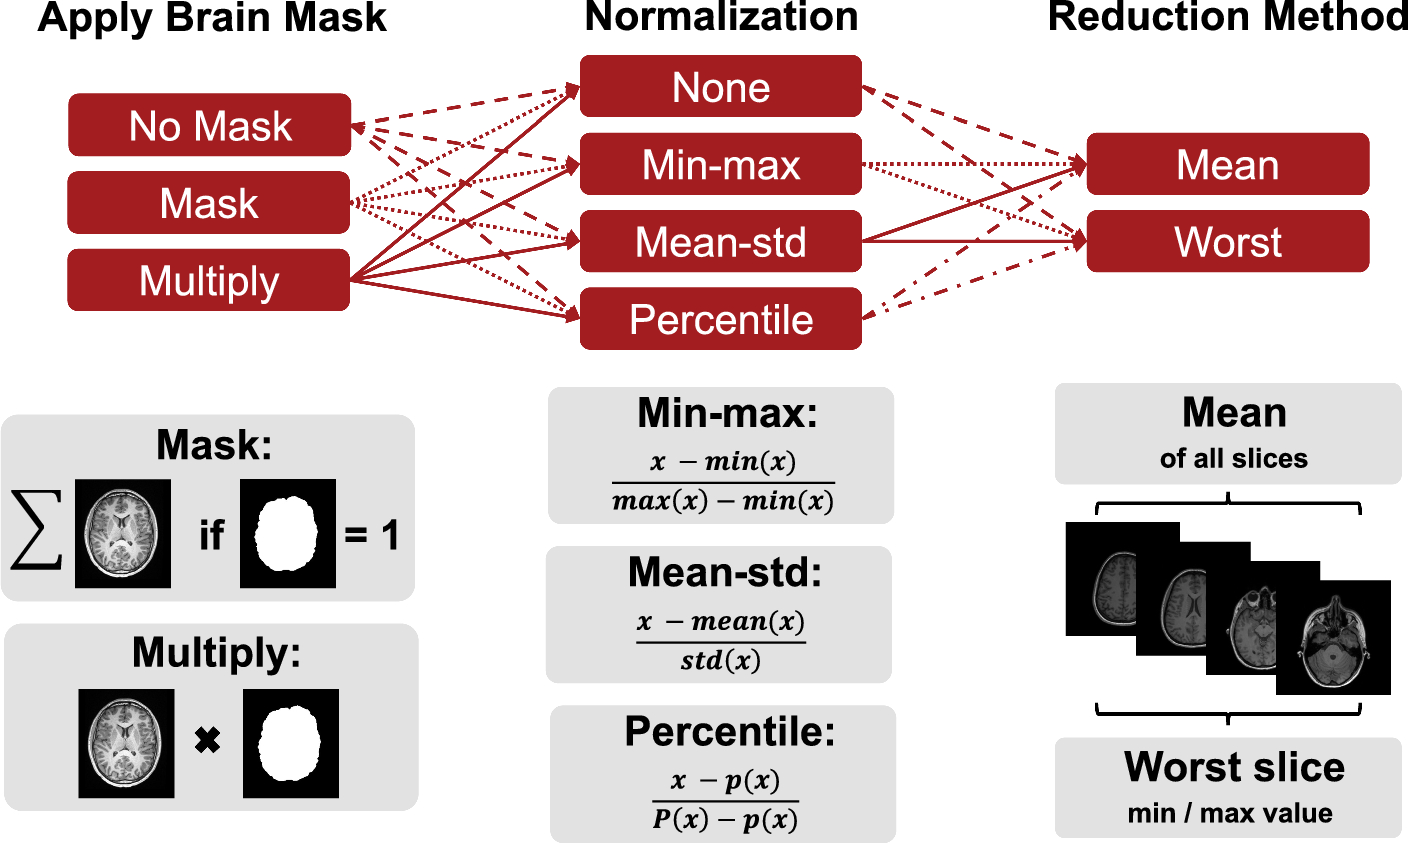
Image normalizationA mismatch between the image intensities in the physics-based FLAIR and conventional FLAIR may affect the hybrid FLAIR quality. Here, k-space data for each FLAIR image was normalized. The normalization scaling factor is defined by the following equation:
$$N_ = \frac}\left(} \right)\,.\,w\left(} \right)}\right)}}}\left(}\right)\,.\,w\left(}\right)}\right)}},$$
(3)
where RMS is the root mean square, \(\mathbf}\) is Fourier transform and \(w(_)\) is a smoothing Tukey window function for soft thresholoding, \(_\) is the phase encoding lines with an undersampling factor of R, \(_\) is the undersampled conventional FLAIR image with an undersamling factor of R, and \(_\) is the physics-based FLAIR image.
K-space combination with Tukey window functionA hybrid FLAIR image can be reconstructed by the following equation:
$$H_ = }}^ \left( }}\left( } \right)\,w\left( } \right) + N_ \cdot\,}}\left( } \right)\cdot\left( } \right)} \right)} \right)$$
(4)
where \(}}^\) is inverse Fourie transform.
The Tukey window, also known as the cosine-tapered window, is defined as follows [25]:
$$w\left( } \right) = \left\l} \left\\left[ - \frac} \right]} \right)} \right\}, 0 \le y_ \le \frac} \\ \le y_ \le 1 - \frac} \\ \left\\left[ - 1 + \frac} \right]} \right)} \right\}, 1 - \frac \le y_ \le 1} \\ \end } \right.$$
(5)
where \(r\) is the ratio of cosine-tapered section length to the entire window length with \(0\le r\le 1\).
Algorithmic parameters were empirically set to optimize the reconstructed hybrid FLAIR based on visual inspection. In this section, we outline this step.
The smoothing Tukey window serves the purpose of minimizing the artifacts caused by residual discontinuities in the frequency distribution when the high-frequency and low-frequency components are combined. To illustrate this point, we conducted a comparison using one patient dataset, where we applied both a rectangular-shaped window, a Hann-shaped window and the window we used in this study (\(r\) = 0.25), see Figure S1. When using a rectangular shape window, we observed truncation artifacts, while the use of a Hann shape window resulted in heavy blurring and less improvement in lesion appearance. Therefore, the Tukey window represents a trade-off between these two kinds of artifacts and therefore was chosen in this study.
For heavily undersampled acquisitions of conventional FLAIR, we explored accelerating factors across a wide range (R = 16, 8, 4, 2). The data from the conventional FLAIR and the physics-based FLAIR was merged using a Tukey window function (Eq. 4). To determine the optimal accelerating factor of the conventional acquisition, hybrid FLAIR images were reconstructed by applying these four undersampling factors to fully sampled conventional FLAIR from one tumor patient. The comparison among physics-based synthetization, hybrid synthetization with different accelerating factors and fully sampled conventional FLAIR images of a tumor patient is depicted in Figure S2. In terms of SSIM, the values for R = 16 and R = 8 are very close. However, visually, the lesion indicated by the arrow is better highlighted for R = 8 compared to R = 16. Similar observations across other datasets have led us to select R = 8 for this study.
Study participants and designImage acquisition and processingAll study participants underwent quantitative 2D axial MR-STAT imaging and conventional fully sampled 2D axial FLAIR imaging on a 3 T Ingenia MRI scanner with a 15-channel receiver head coil (Philips, Best). Sequence parameters are shown in Table 1. For the patient scans, fully sampled conventional FLAIR data were acquired and retrospectively under-sampled. To demonstrate the validity of this retrospective acquisition analysis, one additional healthy volunteer was scanned, and both fully sampled and partially sampled FLAIR data was prospectively acquired. The scan time for the partially sampled 2D FLAIR includes the preparation and calibration time (20 s) and the duration for acquiring the k-space data (20 s). The proposed hybrid approach was applied as described above.
Table 1 Acquisition parameters of the MR-STAT and conventional FLAIR sequencePatient datasetsPatient datasets were already acquired in a recently completed clinical study [7], where whole brain MR-STAT and conventional FLAIR images were acquired in 40 patients with 4 different neurological diseases, namely: brain tumor (n = 11), epilepsy (n = 10), multiple sclerosis (MS, n = 10) and stroke (n = 9). The study was approved by the local Ethic Review Board (NL69544.041.19, METC 19/282) and written informed consent was obtained before inclusion of the study participants.
Retrospective analysis on patient datasetsTo assess the efficacy of improving lesion appearance with the proposed method, a retrospective comparison was conducted among FLAIR images synthesized according to the physics-based model, the hybrid method, and conventional FLAIR images across forty patients.
Prospective validation on a healthy volunteerTo validate the potential prospective application of the proposed method on patients in the future, a comparison between a prospective and retrospective under-sampling implementation of the hybrid synthetization method was performed on a healthy volunteer with no known history of neurological diseases.
Quantitative analysis of physics-based, hybrid and conventional FLAIR images from clinical dataThe lesion-to-GM ratio, lesion-to-WM ratio, and contrast-to-noise ratio (CNR) were used to compare physics-based, hybrid and conventional FLAIR images. These quantities were computed by first segmenting the lesion and healthy-appearing tissue (grey and white matter) on the FLAIR images.
The lesion-to-GM ratio was calculated as the mean signal intensity of a lesion divided by that of the healthy appearing GM. The lesion-to-GM CNR was calculated as the difference between the mean signal intensity of a lesion and that of the healthy appearing GM divided by the median standard deviation of all tissues in each patient [6]. The median standard deviation of the signal intensity of, respectively, the lesion and healthy-appearing tissue (grey and white matter) of the FLAIR images was defined as the noise [26]. The lesion-to-WM ratio and lesion-to-WM CNR were calculated likewise.
Statistical analysisThe Wilcoxon signed rank test was used to analyze the difference in the signal ratios and CNRs of physics-based FLAIR images and hybrid FLAIR images. A p value smaller than 0.05 was considered as statistical significance.
For five patients, the lesion appeared to be either hypointense (patient ID 36) or composite (hyper and hypointense, patients ID 37–40). See also the yellow arrows in Figure S7. For this reason, we had to exclude these five datasets from the statistical analysis.
Comments (0)