
Remember me
The quality of wine is significantly influenced by the Wine Microbial Consortium (WMC), which comprises various microorganisms, including yeasts, lactic acid bacteria, and acetic acid bacteria (Camilo et al., 2022). The wine production process begins with the harvest of grapes and progresses through multiple fermentation stages, where the interactions among these microbial populations play a crucial role in shaping the final product’s sensory and chemical attributes (Van Leeuwen and Seguin, 2006; Bokulich et al., 2014; Nardi, 2020). The composition of the WMC is affected by several factors, including grape cultivar, ripeness, climate conditions, and vineyard management practices (Čadež et al., 2010; Pinto et al., 2014; Yao, 2023).
Although Saccharomyces cerevisiae is the dominant yeast in wine fermentation, its isolation from mature, healthy grapes can be challenging (Capece et al., 2013). Initially, a diverse array of yeast communities including Candida, Hanseniaspora, Issatchenkia, Kluyveromyces, Metschnikowia, and Pichia are present, but S. cerevisiae takes over in the later stages of fermentation (Ribereau-Gayon et al., 2005; Ciani and Comitini, 2019; Fazio et al., 2023). The dynamics of these fungal microbiomes are critical, with specific genera like Hanseniaspora uvarum being prevalent during the fermentation process (Onetto et al., 2024). These communities exhibit significant temporal and spatial variability, affecting fermentation outcomes. Microbial populations metabolize grape sugars, producing secondary metabolites and enzymes that significantly impact the sensory properties of the wine (Fleet, 2003; Tofalo et al., 2021; Romano et al., 2022). Notably, non-Saccharomyces yeasts enhance the hydrolysis of monoterpene glycosides, thereby influencing aroma profiles (Schober et al., 2023).
The wine industry is increasingly investigating non-Saccharomyces yeasts for their ability to impart distinct flavors and aromas by converting organic compounds into specific volatile compounds during fermentation (Tofalo et al., 2011; Steensels and Verstrepen, 2014; Berbegal et al., 2020; Tufariello et al., 2021). The introduction of new strains from grapes and fermented musts can deepen our understanding of fermentation dynamics and support the development of innovative starter cultures (Fleet, 2008; Ciani et al., 2010; Zhu et al., 2021). Specific enzymatic activities exhibited by these yeasts, such as glycosidases, are essential for releasing volatile terpenes and other aroma compounds, further enhancing wine complexity (Romano et al., 2022).
Traditionally isolated from grape berries and juice, non-Saccharomyces yeasts have also been found in spontaneously fermented musts, showcasing their vitality during fermentation processes (Combina et al., 2005; Cordero-Bueso et al., 2013; Vilela et al., 2020). Studies have highlighted strains such as Torulaspora delbrueckii and various Hanseniaspora species for their positive contributions to fermentation dynamics and aromatic complexity (Borren and Tian, 2020). Their presence has been associated with improved sensory evaluations and the release of varietal aromas (López-Enríquez et al., 2023; Duka et al., 2024). Co-culturing non-Saccharomyces yeasts with S. cerevisiae has demonstrated that they can withstand higher levels of alcohol, sulfur dioxide, and sugar concentrations, enhancing their viability in challenging fermentation environments (Maicas and Mateo, 2023). As fermentation progresses, S. cerevisiae produces ethanol, limiting the growth of other microbes, while tartaric acid acts as a growth inhibitor for S. cerevisiae, creating a stable fermentation context (Fleet, 2008; Albergaria and Arneborg, 2016).
Effective isolation of non-Saccharomyces yeast strains occurs during the early stages of fermentation, with species such as Candida, Hanseniaspora, Metschnikowia, Lachancea (formerly Kluyveromyces), Pichia, and Saccharomyces participating in spontaneous wine fermentation driven by the native WMC (Cocolin et al., 2000; Mills et al., 2002; Fleet, 2008; Maicas and Mateo, 2023). Major wine-producing countries utilize commercial strains of S. cerevisiae alongside non-Saccharomyces yeasts to create distinctive wines (Franco et al., 2021). Recent studies have revealed regional distributions of WMC in various countries, contributing to our understanding of wine microbiome dynamics and biodiversity (Setati et al., 2012; Bokulich et al., 2014; Taylor et al., 2014; De Gioia et al., 2022).
Despite extensive research on Saccharomyces strains in wine fermentation, the exploration of non-Saccharomyces yeasts, particularly their dynamics and biodiversity in Sri Lanka, remains largely unexplored. Although industrial-scale wine production is limited in Sri Lanka, there is a growing interest among small-scale winemakers to showcase unique Sri Lankan wine flavors on the global stage. Therefore, this study aims to isolate efficient wild-type non-Saccharomyces yeasts from specific geographical regions of Sri Lanka using Israel blue grapes (Vitis vinifera L.) and to correlate their microbial profiles with the sensory properties of the produced wine.
2 Materials and methods2.1 Sampling, isolation, and identification of non-Saccharomyces yeastsInitially, healthy, undamaged Israel blue grape (Vitis vinifera L.) samples were collected from various districts in Sri Lanka: Jaffna District (Urumpirai), Kilinochchi District (Palai), Puttalam District (Kalpitiya), Anuradhapura District (Mahailuppallama) and Kandy District (Kundasale).
Non-Saccharomyces yeasts were isolated from the collected grapes using two sample types; fresh grape skin, and different fermentation stages (early, middle, and late) of grape must. The grape skin was washed with saline solution (0.9%) in a shaker at 120 rpm for 15–20 minutes to extract the microorganisms from the grape skin. For the fermentation technique, grapes were crushed and allowed to undergo spontaneous fermentation. Microorganisms were then isolated from the early (1st day), middle (7th day), and final (14th day) stages of fermentation using YPD (Yeast extract peptone dextrose, HiMedia, India), and TSA (Tryptic soya agar, HiMedia, India) mediums and incubated at 28-30°C for 48 hrs (Kántor et al., 2017). Morphological characterization and budding formations were observed under microscopic view. To check the fermentation ability and CO2 production of the isolates, phenol red glucose broth with Durham tubes was used (Barnett et al., 2000).
2.2 Molecular identificationDNA extraction of selected yeasts was carried out using a Wizard genomic DNA purification kit (Promega, USA). The polymerase chain reaction (PCR) was then performed using a thermocycler (BIOER, LifeECO) with universal primers for the internal transcribed spacer (ITS) region: ITS1 (5´-TCC GTA GGT GAA CCT TGC GG-3´), and ITS4 (5´-TCC TCC GCT TAT TGA TAT GC-3´) to amplify the ITS region of the yeast rDNA (Kurtzman and Robnett, 1997). The PCR parameters were as follows: for the ITS amplification, the procedure begins with an Initial Denaturation step, where the reaction is heated to 95 °C for 5 minutes. This is followed by Cycling Steps repeated 35 times, consisting of Denaturation at 95 °C for 1 minute, Annealing at 52 °C for 45 seconds, and Extension at 72 °C for 1 minute. After the cycles, a Final Extension at 72 °C for 7 minutes is performed. The procedure concludes with a Final Hold at 40 °C to stabilize the PCR products for further analysis (Barata et al., 2012). Finally, PCR products were sent to Macrogen Inc., Korea for sequencing. Furthermore, phylogenetic characterization was carried out by comparing the sequences with previously identified non-Saccharomyces yeasts from other countries through BLASTN search of GenBank.
2.3 Substrate utilization and fermentation kinetics of isolated yeast strainsThe thermovinification process was carried out on the fresh grapes. This technique involves heating grapes to temperatures between 60–80°C for 20–30 minutes, which facilitates the release of anthocyanins and other phenolic compounds from the grape tissues (Hanamant et al., 2015). After cooling the grapes naturally, they were then crushed aseptically. Subsequently, 1 mL of each identified non-Saccharomyces yeast strain (10⁸ CFU mL-1) was inoculated separately into 200 mL of grape must and allowed to ferment at room temperature. Fermentation for each strain was performed in triplicate under the same conditions. No additives were added to the must during fermentation.
2.3.1 Residual sugar analysisTo analyze the substrate, residual sugar in the must and wine was calculated. Using the total soluble solids measured with a Brix meter (RHB-32ATC, ERMA, Tokyo) and the density of the wine during fermentation (monitored by weight and volume), residual sugars were determined following the model developed by Yaa’ri et al. (2024).
2.3.2 Alcohol level determinationTo determine the produced alcohol level, standard solutions containing 10% ethanol and 10% internal standards were prepared, along with sample solutions containing 10% wine sample and 10% internal standards, all prepared in triplicates. These solutions were mixed, and filtered through 0.4 µm GC nylon filters into GC vials. The analysis was performed using an Agilent 7890A gas chromatograph (Agilent Technologies, USA) with an injector temperature of 120°C, an oven temperature of 50°C, and a flame ionization detector temperature of 200°C. The procedure used a split ratio of 50:1 and an injection volume of 0.4 µL, following ISO 7609:1985 and SLS 1619:201 standards for alcohol analysis in wine.
2.3.3 Fermentation kinetics modelAlcohol levels, residual sugar, and biomass of each strain were monitored during fermentation (0-14 days). The dilution series was prepared for each wine sample and the pour plate was carried out on WLN agar (Wallerstein Laboratory Nutrient agar, HiMedia, India). The colony count was taken after 24 h of incubation at 28°C. Here, colony counts were taken from the early, middle, and later stages of fermentation of every wine sample (Wang et al., 2022b) to analyze their growth kinetics. For the evaluation of fermentation kinetics, the growth rate constant (r) of yeasts was calculated by using the derived Equation 1 (Zhang et al., 2006).
The reaction demonstrated an exponential decrease of residual sugar concentration as a function of time, where Ct is the residual sugar concentration at time t, C0 is the initial residual sugar concentration (i.e., at time t = 0), and r is the specific rate constant. The next useful sign of the fermentation reaction rate is the time taken for residual sugar concentration to drop to half its initial concentration (half-life, t1/2) Zhang et al., 2006). In the case of a first-order reaction, the time taken for the reduction of residual sugar concentration from N0 to 1/2 N0 is given by Equation 2.
N (t) = N0 (1/2) t/t (half)(2)Furthermore, the fermentation kinetics of selected yeast strains were analyzed by using the following Michaelis-Menten Equation 3.
V0=(Vmax [S]/(Km+[S])(3)Where V0 is the initial reaction velocity, [S] is the concentration of substrate, Vmax is the maximum reaction velocity and Km is the Michaelis constant (Palma et al., 2012). Here substrate concentration was measured for all selected wine samples during the fermentation period and the graph was plotted showing the reaction rate against the substrate concentration. The substrate concentration was measured as described previously in Section 2.3.1. According to the kinetics the Michaelis constant (Km) is given by the substrate concentration where the reaction rate is half of the maximum value (Vmax). Then R2 value of every strain was analyzed to study the goodness of fit of the data to the Michaelis Menten equation.
2.4 Determination of pH and acid contentAfter fermentation (on the 14th day), wine samples from each strain were checked for pH using a pH meter (Hanna Instruments HI 83141, USA) and subjected to High Performance Liquid Chromatography (HPLC) analysis to quantify tartaric acid, malic acid, acetic acid, and lactic acid in the fermented grape wine. For this, organic acids analysis, an Agilent 1260 Infinity HPLC with a quaternary gradient pump, diode array detector (UV-210 nm), and refractive index (RI) detector were used. Chromatographic separation was performed with a Phenomenex Rezex ROA Organic Acid H⁺ 8% (7.8 × 300 mm, 5 μm) analytical column and a guard column (4 × 3 mm). The mobile phase was 0.005 N H2SO4, with a flow rate of 0.6 mL min-1, a total run time of 18 minutes, and an injection volume of 10 µL. The column compartment temperature was 40°C (García-Beneytez et al., 2003).
2.5 Fourier Transform Infrared (FTIR) analysisWine samples produced by selected strains were analyzed using FTIR (Nicolet iS10 spectrophotometer, Thermo Fisher Scientific, USA) within the range of 4000 to 500 cm⁻¹. KBr pellets with wine samples were prepared and analyzed in transmission mode (Basalekou et al., 2020). The data was processed using OMNIC 7.3 software (Thermo Fisher Scientific Inc.).
2.6 E-Nose analysisThe olfactory properties of wine produced by selected yeast strains were analyzed using an E-Nose (AIRSENSE Analytics, PEN3.5), which consists of 10 sensors (Table 1). Volatile compounds were detected in graphical format by a 10-fold array of thick film metal oxide gas sensors. The E-Nose underwent a 10-minute pre-warming before each test. A standardized run schedule was employed for all samples, following a two-stage run cycle. The sensors required 100 seconds of sampling run time to attain a stable value. The duration for sensor cleaning before every analysis was set to 100 seconds. The volatile gas samples from the headspace of sealed vials were pumped over the sensors at a flow rate of 200 mL min-1, and the sample run analysis was carried out using Winmuster software (AIRSENSE ANALYTICS GmbH, Schwerin, Germany) Sun et al., 2018).
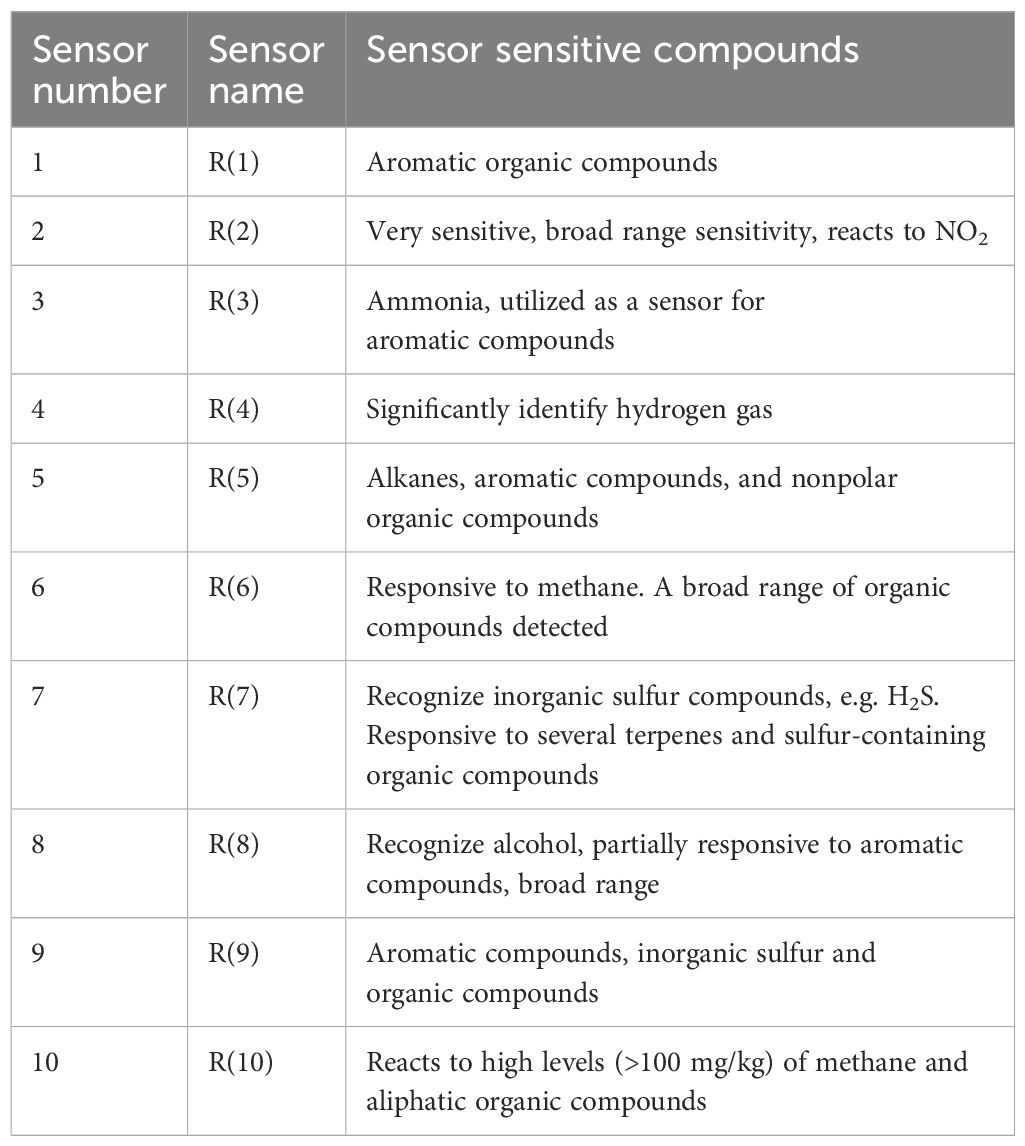
Table 1. Sensor sensitivity for the PEN 3.5 sensor array.
2.7 Headspace Solid Phase Microextraction (HS/SPME) - Gas Chromatography-Mass Spectrometry (GC-MS) analysisThe volatile profile of wine samples produced by non-Saccharomyces yeast was determined using the SPME-GC-MS method. The headspace SPME sampling conditions were as follows: Initially, 10 mL of the liquid sample, along with 3 g of NaCl, were mixed and carefully transferred into a 20 mL headspace vial. This vial was equipped with a Teflon-lined septum and sealed using an aluminum crimp seal. The contents in the vial were subjected to magnetic stirring for 5 minutes at 60°C. Subsequently, a fiber (DVB/C-WR/PDMS - 50/30 µm, 10 mm, Supelco, Bellefonte, PA, USA) was inserted into the headspace region of the GC-MS (Agilent Technologies 7890A GC, USA) and allowed to remain there for 45 minutes, with a constant fiber length. Desorption of volatile compounds occurred in the injector of the gas chromatograph, operating in spitless mode, at a temperature of 240°C. Before each analysis, the fiber was exposed to the injection port for 5 minutes to remove any volatile contaminants that might be present. The helium flow rate was maintained at 0.8 mL/min during the experiment. The initial oven temperature was set at 40°C for 1 minute, followed by a ramp of 15°C min-1 to 140°C, and then a further increase to 260°C for 1.5 minutes. The spectrometer operated in electron impact mode (EI) at 70 eV and a temperature of 240°C for 3 minutes (Wang et al., 2022a).
2.8 Sensory evaluation of grape winesThe wine samples were evaluated by quantitative descriptive sensory analysis using a scale from 0 to 9 (0 = very low, 9 = very high) Niu et al., 2011). A group of 11 trained assessors, 5 females and 6 males aged from 25 to 40 involved in the sensory analysis of wine samples. The sensory analysis was carried out according to the reference protocol of Niu et al. (2011). The volatile and visual attributes were evaluated. The volatile profile included fruity, floral, herbaceous, alcoholic, solvent, and phenolic attributes, and the visual profile included color and clarity. The sensory evaluation was carried out at a controlled room temperature between 20-25 °C.
2.9 Statistical analysisStatistical analysis was carried out by using SPSS 20.0 (IBM, US). Tukey’s one-way ANOVA was used to analyze physiochemical and fermentation kinetics parameters to determine the significant differences at a confidence level of 0.05. Data were interpreted as mean ± standard. The Principal Component Analysis (PCA) and heat map graphing were performed using OriginPro 2022 software.
3 ResultsTwenty-eight non-Saccharomyces yeast strains were isolated from grape skin and from different wine fermentation stages (early, middle, and late) of must samples collected from various areas in Sri Lanka. The best performing isolates were identified as Hanseniaspora opuntiae J1Y-T1 (OP143841), H. guilliermondii Y5P-T5 (OP924274), H. uvarum JF3-T1N (PQ169565), Pichia kudriavzevii Y8P-T8 (OP924553), and Starmerella bacillaris WMP4-T4 (OP890585) according to their glucose fermenting ability,alcohol production ability and survival ability in ethanol stress (Supplementary Table 1).
3.1 Yeast population dynamics, substrate utilization and fermentation kineticsAs depicted in Figure 1, the initial grape juice had a total sugar content of 237.92 ± 3.52 g L⁻¹ and ethanol levels below 0.01 g L⁻¹. During fermentation, residual sugar levels decreased while alcohol levels increased. The growth dynamics of the selected yeast strains on the first day indicated that all five strains entered the exponential growth phase, rapidly utilizing the available sugar.
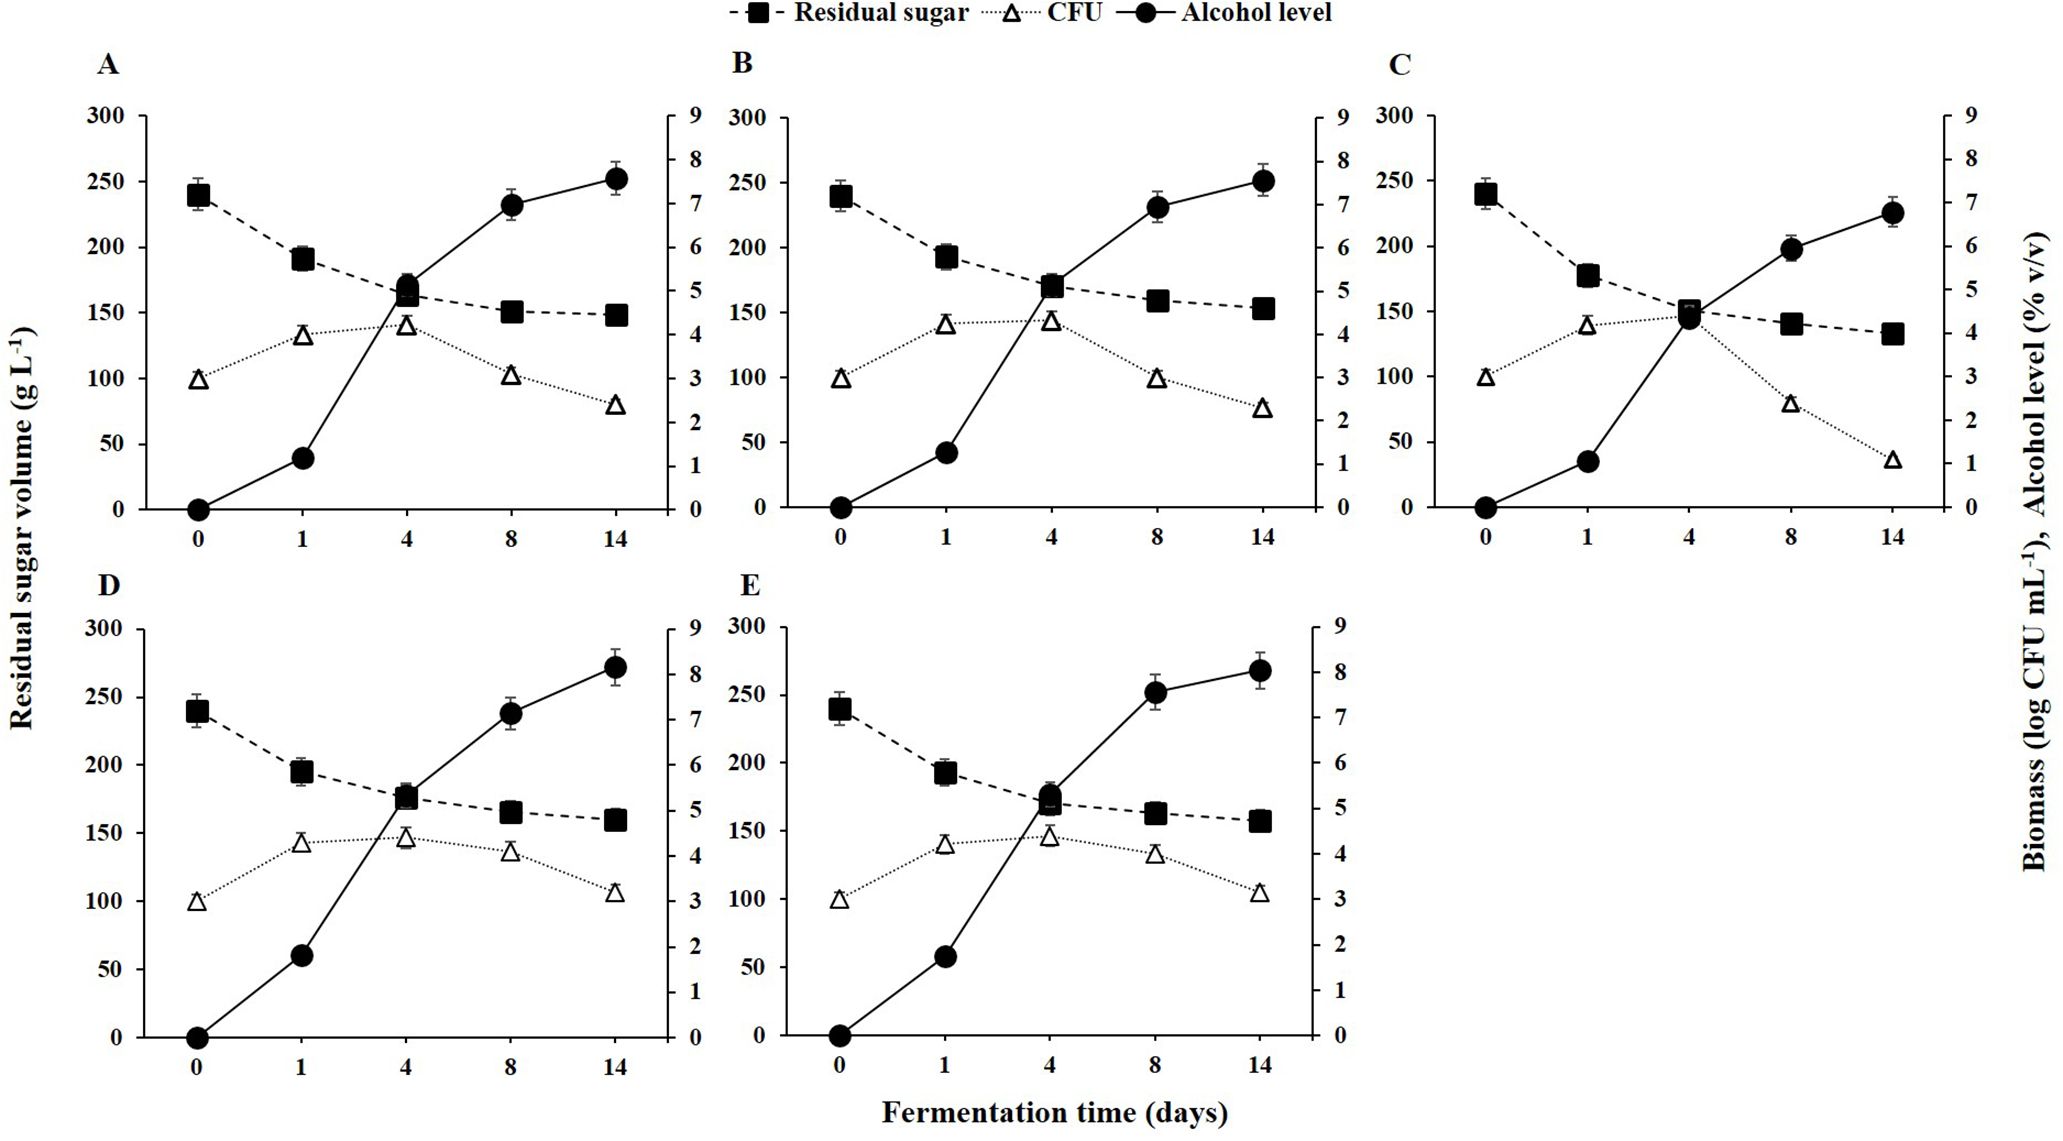
Figure 1. Yeast population dynamics, residual sugar, and alcohol levels during fermentation from 0 to 14 days for different non-Saccharomyces yeast strains: (A) H. opuntiae J1Y-T1; (B) P. kudriavzevii Y8P-T8; (C) H. guilliermondii Y5P-T5; (D) H. uvarum JF3-T1N; and (E) S. bacillaris WMP4-T4.
Despite the efficient initial sugar utilization and rapid growth of H. guilliermondii Y5P-T5, its biomass declined after the fourth day due to poor alcohol tolerance (Figure 1), with alcohol levels reaching 5% (v/v) by that time. Between days 4 and 14, alcohol levels increased to 8%, but H. guilliermondii Y5P-T5 remained the least efficient alcohol producer. In contrast, H. uvarum JF3-T1N and S. bacillaris WMP4-T4 maintained their populations in high-alcohol conditions, sustaining a biomass of 10³ CFU mL⁻¹.
During the initial fermentation period (days 1-4), all strains exhibited elevated biomass levels, reaching approximately 10⁴ CFU mL⁻¹ (Figure 1). However, as fermentation progressed (days 5-8), biomass levels declined due to alcoholic stress. Notably, H. uvarum JF3-T1N and S. bacillaris WMP4-T4 showed a slower decline compared to the other strains. A significant reduction in sugar levels occurred during the first four days, after which the rates of sugar consumption and alcohol production decreased as colony counts dropped.
By the 14th day of fermentation, the residual sugar levels (g L⁻¹) were as follows: H. uvarum JF3-T1N (162.37 ± 2.48) > S. bacillaris WMP4-T4 (161.54 ± 3.04) > P. kudriavzevii Y8P-T8 (152.16 ± 3.25) > H. opuntiae J1Y-T1 (150.34 ± 2.95) > H. guilliermondii Y5P-T5 (135.68 ± 2.76). These results indicate that H. guilliermondii Y5P-T5 consumed significantly more sugar than the other strains. Similarly, alcohol levels on the 14th day (% v/v) showed the following order: H. uvarum JF3-T1N (8.16 ± 0.05) > S. bacillaris WMP4-T4 (8.04 ± 0.04) > P. kudriavzevii Y8P-T8 (7.57 ± 0.08) > H. opuntiae J1Y-T1 (7.57 ± 0.04) > H. guilliermondii Y5P-T5 (6.78 ± 0.07), highlighting significant variations in alcohol production among the strains.
Fermentation kinetic studies (Table 2) further revealed that H. guilliermondii Y5P-T5 exhibited the shortest half-life (2.29 ± 0.03 days) and the highest growth rate (0.302 ± 0.001 day⁻¹), whereas H. uvarum JF3-T1N showed the longest half-life (3.34 ± 0.03 days) and the lowest growth rate (0.207 ± 0.001 day⁻¹). No significant differences (p > 0.05) were observed in the half-life and growth rates of P. kudriavzevii Y8P-T8 and S. bacillaris WMP4-T4.
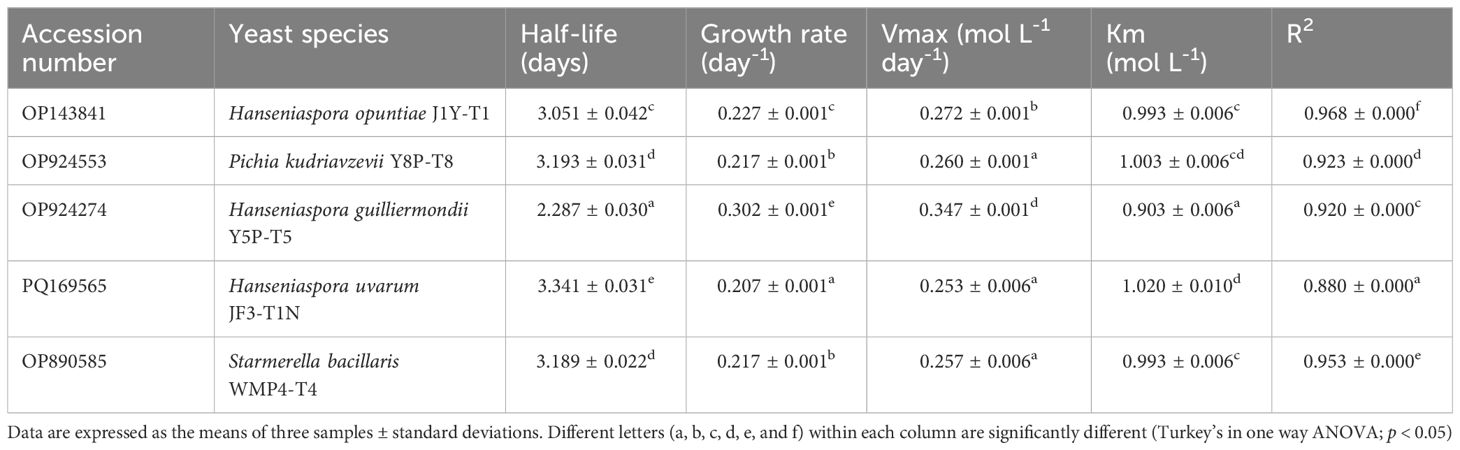
Table 2. GenBank accession numbers and fermentation kinetic parameters of selected non-Saccharomyces yeast strains.
Kinetic results (Table 2) confirmed that H. guilliermondii Y5P-T5 had the highest growth rate and Vmax, followed by H. opuntiae J1Y-T1. H. guilliermondii Y5P-T5 also exhibited the shortest half-life and the lowest Km value. The R² values obtained for all strains showed a strong correlation with the Michaelis-Menten model, with H. opuntiae J1Y-T1 and S. bacillaris WMP4-T4 showing the best fit, while other strains exhibited slight deviations from this model. In summary, H. guilliermondii Y5P-T5 exhibited a significantly higher growth rate during the initial four days of fermentation but struggled under high alcohol conditions. In contrast, H. uvarum JF3-T1N and S. bacillaris WMP4-T4 maintained their populations and continued alcohol production during the later stages of fermentation.
3.2 Acid profile and functional group analysis in fermented wineBased on the analysis, the initial grape juice had a pH of 3.89 ± 0.02 and contained tartaric acid (5.21 ± 0.18 g L⁻¹), malic acid (2.24 ± 0.80 g L⁻¹), and acetic acid at levels below 0.01 g L⁻¹. The HPLC results from the fermented wine samples revealed the presence of significant amounts of acetic acid, tartaric acid, and malic acid. As shown in Figure 2, the tartaric acid levels in the wine produced by each strain remained relatively consistent with the initial grape juice values. However, malic acid levels showed a significant reduction (p > 0.05) compared to the initial values, particularly in wines fermented with H. uvarum JF3-T1N and S. bacillaris WMP4-T4, which exhibited the greatest malic acid reductions.
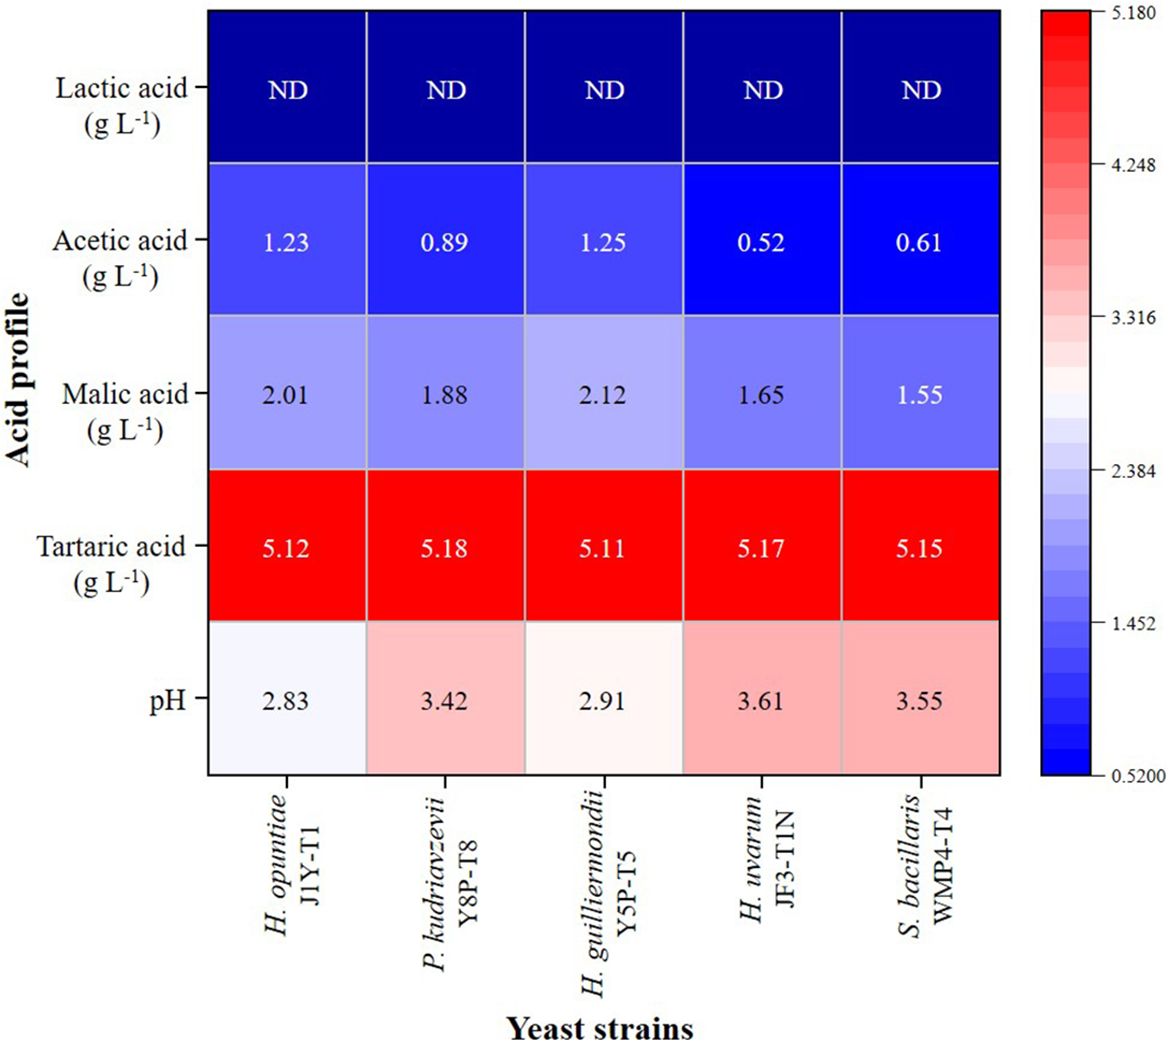
Figure 2. Acid profile heat map of wine samples produced by selected non-Saccharomyces yeast strains.
None of the five yeast strains were able to produce lactic acid. Notably, H. opuntiae J1Y-T1 and H. guilliermondii Y5P-T5 produced significantly higher amounts of acetic acid (greater than 2.0 g L⁻¹) compared to the other strains, while H. uvarum JF3-T1N exhibited the lowest acetic acid production. Wines fermented with H. opuntiae J1Y-T1 and H. guilliermondii Y5P-T5 also displayed elevated levels of fixed acids, which corresponded with their lower pH values (below 3). These lower pH levels contributed to the wines’ overall acidity.
In addition to the organic acids, alcohols, and sugars identified in the wine samples, their presence was tentatively confirmed by Fourier-transform infrared (FTIR) spectroscopy, as indicated by the functional bonds observed in the spectra (Figure 3). Broad O-H stretching from acids and alcohols, along with C-H stretching in hydrocarbons, was detected in the 3200-3550 cm⁻¹ range. Stretching vibrations from -OH, -CH₃, -CH₂, and -CH groups were also observed in the 1626-1662 cm⁻¹ range, while the 1415-1380 cm⁻¹ range exhibited stretching vibrations from -C=O, -C=C, -CH₂, and -CH groups, characteristic of aldehydes, acids, proteins, and esters. The 1050-1085 cm⁻¹ range corresponded to C-O and O-H stretching from sugars and organic acids, and the presence of sulfur compounds was identified in the 600-500 cm⁻¹ range. Phenolic groups were noted around the 1500-1400 cm⁻¹ region, and the 1800-1000 cm⁻¹ range included deformations and stretching vibrations of C-OH, CH₃, CH₂, C=C, and C≡N, indicating the presence of phenols, alcohols, aldehydes, acids, sugars, and amino acids in the wines. The amide I and II regions, which typically range between 1600 and 1700 cm⁻¹, were also observed.
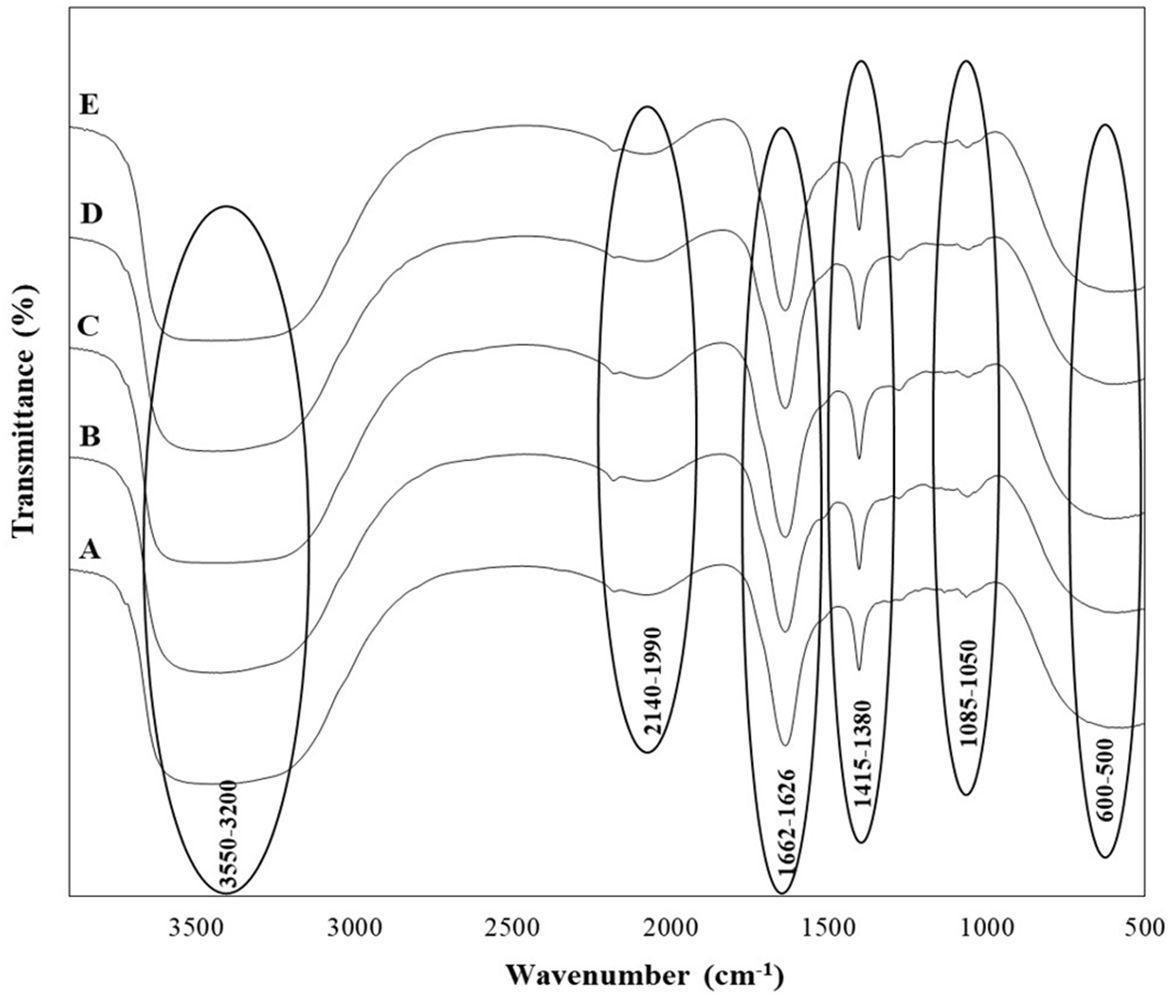
Figure 3. FTIR spectra of wine samples produced by selected non-Saccharomyces yeast strains (A) H. opuntiae J1Y-T1; (B) P. kudriavzevii Y8P-T8; (C) H. guilliermondii Y5P-T5; (D) H. uvarum JF3-T1N; and (E) S. bacillaris WMP4-T4.
All five wine samples produced by the isolated strains showed nearly identical FTIR spectra, indicating similar chemical compositions across the different fermentation products.
3.3 Organoleptic properties of wine produced by isolated non-Saccharomyces yeast strainsThe quantitative values for the volatile profile of wine samples produced by non-Saccharomyces yeast strains from the Israel blue grapes (Vitis vinifera L.) variety are presented as relative peak area percentages in Figure 4. Significant differences were observed between the strains (p > 0.05). Notably, S. bacillaris WMP4-T4 exhibited the highest level of alcoholic flavor, followed by H. uvarum JF3-T1N, while H. guilliermondii Y5P-T5 showed the lowest alcohol percentage. This pattern aligns with the alcohol levels observed in Figure 1.
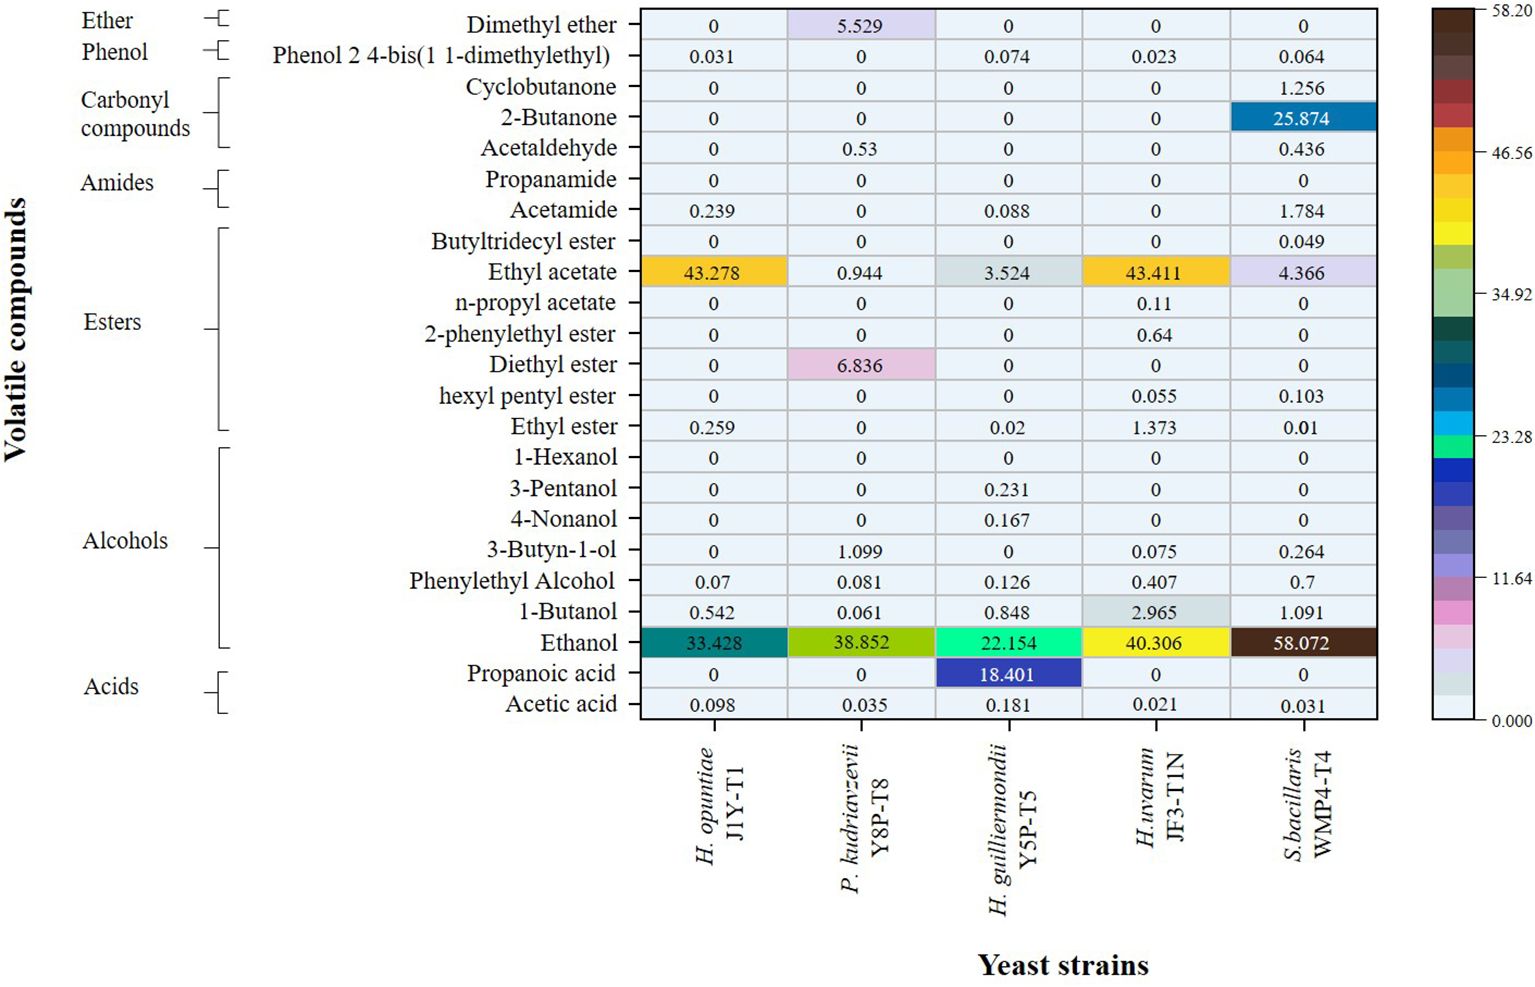
Figure 4. Comparison of the volatile profiles of wine samples produced by selected non-Saccharomyces yeast strains through SPME GC/MS analysis.
In addition to ethanol, trace amounts of volatile compounds, including 1-butanol, phenylethyl alcohol, 3-butyne-1-ol, 4-nonanol, and 3-pentanol, were detected. Among these, H. guilliermondii Y5P-T5 was the only strain capable of producing 4-nonanol and 3-pentanol, while H. guilliermondii Y5P-T5, H. uvarum JF3-T1N, and S. bacillaris WMP4-T4 produced low amounts of 3-butyne-1-ol.
Regarding ester production, H. opuntiae J1Y-T1 and H. uvarum JF3-T1N generated higher amounts of ethyl acetate (43%). H. uvarum JF3-T1N produced the greatest variety and total amount of esters, including ethyl ester, hexyl pentyl ester, 2-phenylethyl ester, n-propyl acetate, and ethyl acetate.
In terms of carbonyl compounds, S. bacillaris WMP4-T4 was the only strain that produced 2-butanone (25.874 ± 0.6165), along with small amounts of cyclobutanone (1.2558 ± 0.0417) and acetaldehyde (0.4625 ± 0.0374). P. kudriavzevii Y8P-T8 also produced a small amount of acetaldehyde (0.5300 ± 0.0424), while the other strains did not produce any carbonyl compounds.
When comparing volatile acidity, acetic acid was present in higher percentages among the strains. The acetic acid levels decreased in the following order: H. guilliermondii Y5P-T5 (0.1812 ± 0.0325) > H. opuntiae J1Y-T1 (0.0981 ± 0.0134) > P. kudriavzevii Y8P-T8 (0.0352 ± 0.0241) > S. bacillaris WMP4-T4 (0.0310 ± 0.0388) > H. uvarum JF3-T1N (0.0213 ± 0.0134). This trend correlates with the HPLC results for acetic acid presented in Figure 2. Additionally, H. guilliermondii Y5P-T5 was the only strain to produce a significant amount of propionic acid (18.4010 ± 0.3698).
In addition, the E-nose was also used to analyze the volatile profile of produced wine. The wine samples produced by selected strains exhibited similar patterns with minor variations (Figure 5). Key sensors such as the broad-range sensor (R2), broad-methane sensor (R6), terpenes and inorganic sulfur sensor (R7), broad-alcohol sensor (R8), and aromatic compounds sensor (R9) showed significant responses.
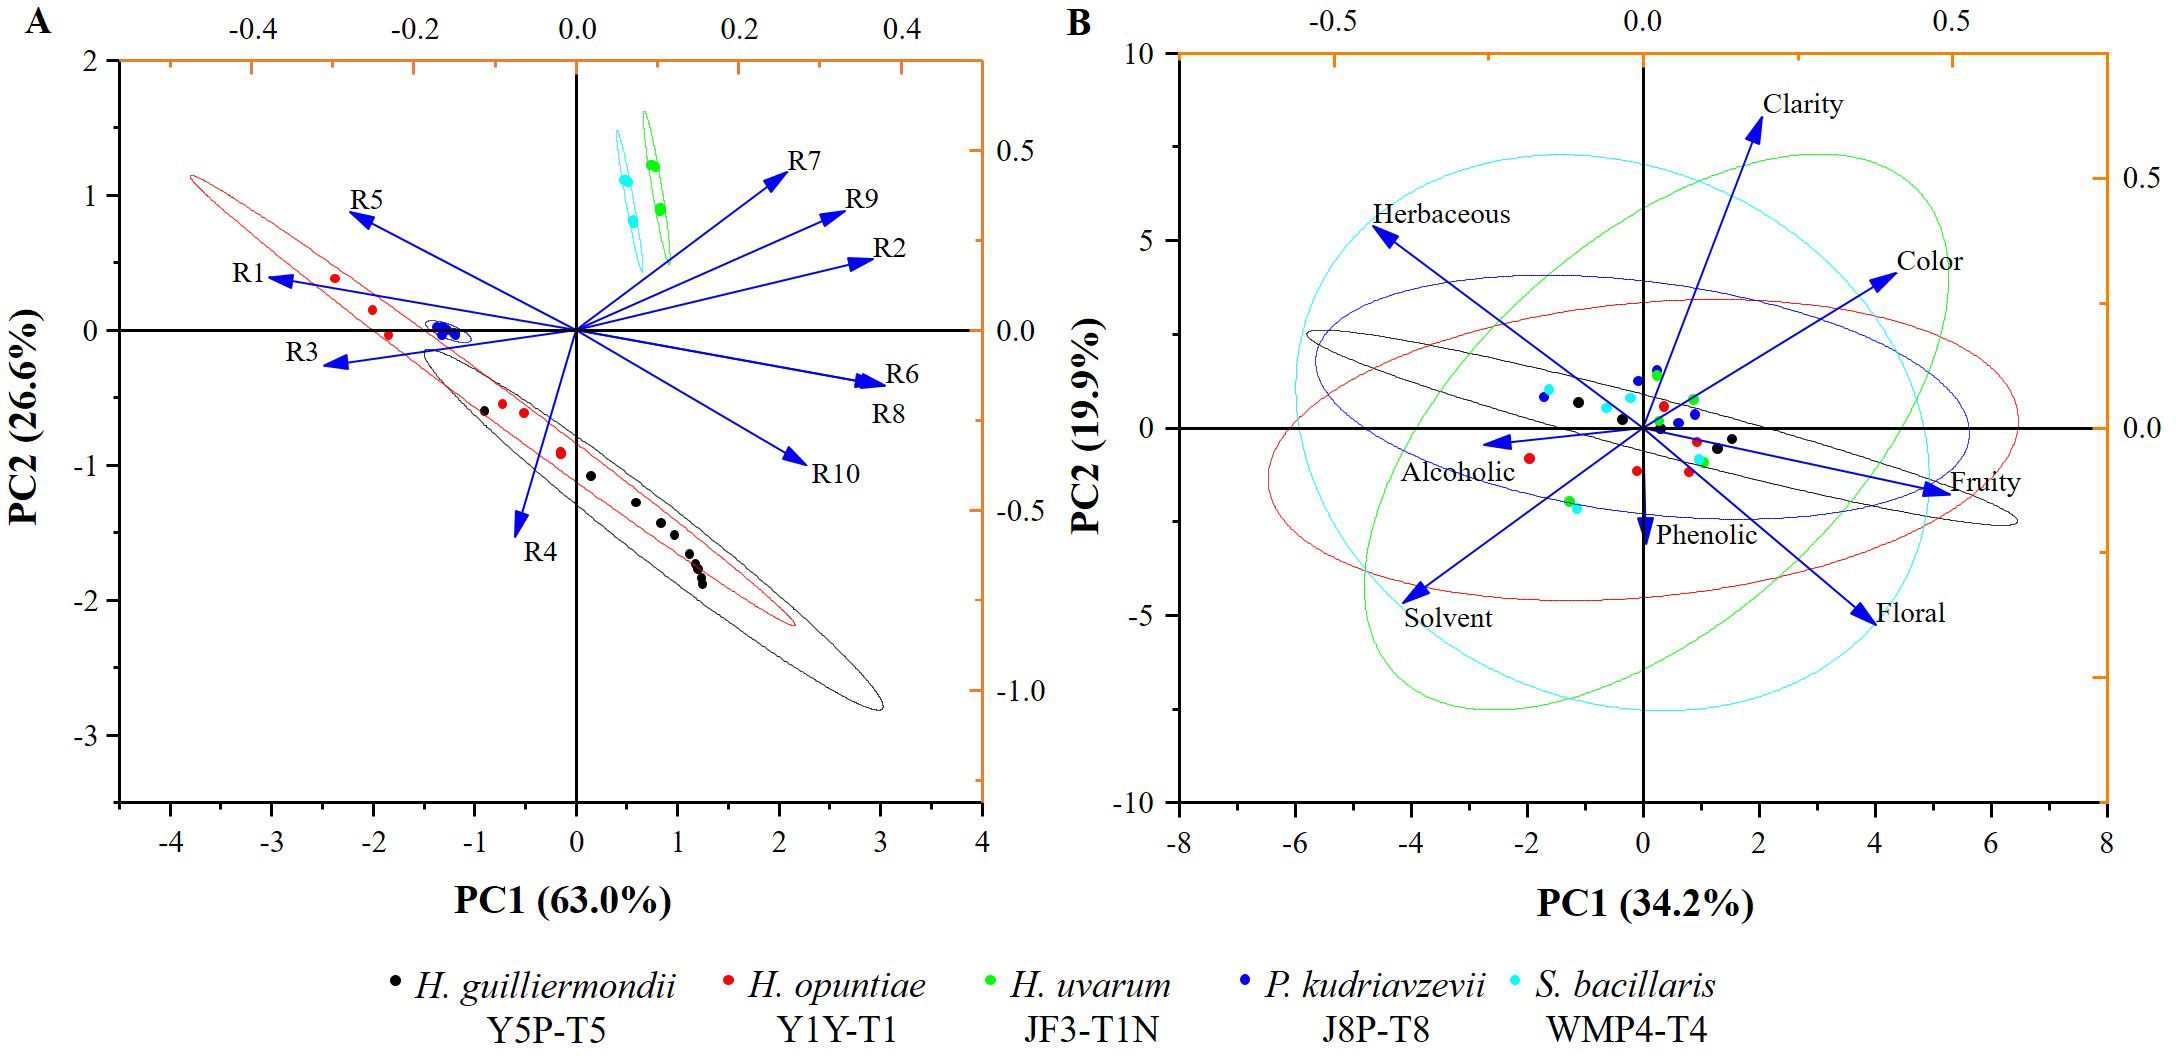
Figure 5. The biplots illustrating the PCA graphs (A) for typical E-nose sensory values (R1-R10); (B) for sensory attributes of wine samples produced by selected non- Saccharomyces yeast strains.
E-nose and sensory analysis data were utilized for principal component analysis (PCA) to enhance discrimination accuracy by reducing the dimensionality of the data (Figure 5). According to Figure 5A, the first two principal component scores for the E-nose data, PC1 and PC2, accounted for 63.0% and 26.6% of the variance, respectively, displaying a total variance of about 89.6%. Wine produced by H. uvarum JF3-T1N and S. bacillaris WMP4-T4 showed positive PC1 and PC2 scores (Figure 5A) and were characterized by higher responses of the R2, R6, R7, R8, and R9 sensors compared to other sensors. H. opuntiae J1Y-T1, H. guilliermondii Y5P-T5, and P. kudriavzevii Y8P-T8 showed both negative and positive scores for PC1 and PC2. Notably, the E-nose profiles of H. opuntiae J1Y-T1 and H. guilliermondii Y5P-T5 overlapped, and they highly correlated with the R1, R3, R4, R5, R6, and R8 sensors. All strains showed a significant response to sensor R8. Additionally, H. uvarum JF3-T1N, and S. bacillaris WMP4-T4 showed a significant response to R7 during E-nose analysis.
Results of the sensory evaluation are presented in Figure 5B. The first two principal component scores of PCA for the sensory evaluation, PC1 and PC2, accounted for 34.2% and 19.9% of the variance, respectively, displaying a total variance of about 54.1%. All strain profiles overlapped around the central value of PC1 and PC2, with slight variations. S. bacillaris WMP4-T4 showed balanced values for all the sensory attributes but specifically correlated with herbaceous, solvent, fruity, and floral sensory attributes of wine.
H. uvarum JF3-T1N showed lower scores than S. bacillaris WMP4-T4 for the herbaceous attribute. Additionally, H. uvarum JF3-T1N correlated more with color, and clarity attributes of wines than S. bacillaris WMP4-T4. H. guilliermondii Y5P-T5 showed a very narrow range of results, mostly herbaceous, fruity, and alcoholic attributes. H. opuntiae J1Y-T1 and P. kudriavzevii Y8P-T8 leaned more toward alcoholic, solvent, fruity, and herbaceous attributes.
4 DiscussionThis study aims to isolate efficient wild-type non-Saccharomyces yeasts from specific geographical regions of Sri Lanka using Israel blue grapes (Vitis vinifera L.) and to correlate their microbial fingerprints to the sensorial properties of the produced wine. Hanseniaspora opuntiae, H. guilliermondii, H. uvarum, Pichia kudriavzevii, and Starmerella bacillaris were also identified from previous studies confirming their abundance in grape wine (Tofalo et al., 2011; Cordero-Bueso et al., 2013; Raymond et al., 2017). According to Kalopesa et al. (2023), the total sugar and ethanol content of the initial grape juice were at preferable levels for wine fermentation. After the first day of fermentation, the rapid consumption of sugars by the yeasts resulted in a decrease in residual sugars and an increase in alcohol levels (Renouf et al., 2007). Non-Saccharomyces yeasts typically used in sequential wine fermentation can produce alcohol levels ranging from 7 to 14 g L-1, and generally show less tolerance to high alcohol concentrations (Vilela, 2019). Specifically, in this study, H. opuntiae J1Y-T1, H. guilliermondii Y5P-T5, and P. kudriavzevii Y8P-T8 showed poor alcohol tolerance beyond 5% (v/v). In contrast, H. uvarum JF3-T1N and S. bacillaris WMP4-T4 showed remarkable alcohol tolerance, maintaining a significantly higher biomass level in the late fermentation stage. Microorganisms that survived during the late fermentation stage significantly influence the sensory properties of wine (Renouf et al., 2007; Hranilovic et al., 2018).
Generally, in wine fermentation, the amount of glucose in the must determines the fermentation rate (Nissen et al., 2004). At low sugar concentrations, yeast growth is controlled by sugar availability, and the fermentation rate shows a positive correlation with sugar concentration (Palma et al., 2012). At high sugar concentrations, the fermentation rate depends on the yeast’s ability to consume sugar until it reaches the maximum rate (Vmax) Galaction et al., 2010). The higher Vmax shown by H. guilliermondii Y5P-T5 and H. opuntiae J1Y-T1 indicates their efficient substrate utilization. Further, the Km value indicates the affinity of yeast enzymes for sugar during fermentation, with a lower value suggesting they can effectively consume sugar even at lower concentrations (Robinson, 2015). Here, H. guilliermondii Y5P-T5 exhibited a lower Km value, indicating higher sugar affinity, which correlated with its highest growth rate (Table 2). Consequently, wines from H. guilliermondii Y5P-T5 efficiently utilized sugar during fermentation, which tended to reduce the residual sugars and could affect the sensory properties of wine.
The maximum R² values obtained for H. opuntiae J1Y-T1 and S. bacillaris WMP4-T4 indicated the best fit to the Michaelis-Menten model, attributed to their high alcohol tolerance and survival. The deviation observed in other strains was due to alcohol toxicity during extended fermentation. However, R² values alone cannot fully determine the fermenting ability of yeast strains, although they can be useful for monitoring and optimizing the fermentation process.
In terms of acid profile tartaric acid, followed by malic acid, is primarily found in grapes and constitutes the most abundant fixed acid in grape wines (Izquierdo-Llopart et al., 2020). L-Tartaric acid is resistant to microbial degradation. Hence, the initial tartaric acid values remained almost consistent, but a slight reduction occurred possibly due to precipitation as calcium or potassium tartrate during the fermentation process (Dutraive et al., 2019; Cioch-Skoneczny et al., 2021). In this study, significant reductions in malic acid concentration were observed for P. kudriavzevii Y8P-T8, H. uvarum JF3-T1N, and S. bacillaris WMP4-T4 after fermentation, which may be due to their partial metabolism of malic acid (Vilela, 2019; Cioch-Skoneczny et al., 2021). Further, acetic acid produced during fermentation plays a crucial role in determining the quality of wine as it affects the total acidity and volatile acidity of wine. The typical threshold of acetic acid in wine is 0.8 g L-1; beyond which the wine may develop undesired vinegar characteristics (Benito et al., 2019; Vilela, 2019). Therefore, wines produced by H. opuntiae J1Y-T1 and H. guilliermondii Y5P-T5 were mostly considered unpleasant. Acetic acid fermenting microorganisms involved in wine fermentation can oxidize alcohol into acetic acid (Mas et al., 2014), which causes a reduction in alcohol level. Hence, H. opuntiae J1Y-T1 and H. guilliermondii Y5P-T5 showed lower alcohol levels. All five strains identified in this study were unable to produce lactic acid as they do not engage in malolactic fermentation (Virdis et al., 2021). According to Kalopesa et al. (2023), the obtained results in this study for tartaric acid, malic acid, and acetic acid fall within the acceptable range of wine.
The preferable pH range for wine is 3-4 (Morata et al., 2021). But H. opuntiae J1Y-T1 and H. guilliermondii Y5P-T5 demonstrated a lesser pH level making them more acidic than other wine samples. However, pH levels above 4 typically increase susceptibility to spoilage (Morata et al., 2021). H. uvarum JF3-T1N and S. bacillaris WMP4-T4 showed higher pH and alcohol levels, with lower acetic acid levels compared to other strains, providing preferable organoleptic qualities to the final product. Previous studies indicated that using S. bacillaris positively affects wine characteristics by reducing excess ethanol and acetic acid levels (Nisiotou et al., 2018; Vilela, 2019; Li et al., 2023). The level of total sugar, ethanol, pH, and total acids in wines from each strain obtained in this study aligned with the People’s Republic of China national standard (GB/T15038-2006), confirming the required quality of the wine.
In the FTIR analysis, all the wine samples from the five different yeasts showed similar functional groups (Figure 3), which align with the previous studies conducted by Zhang et al. (2010); Budziak-Wieczorek et al. (2023), and Teixeira dos Santos et al. (2024). This includes functional groups related to carbonyl compounds, esters, acids, alcohols, and phenols in the wine (Figure 3). The functional groups observed related to the acids were due to the presence of tartaric, malic and acetic acids, while the bonds for alcohol were mainly due to ethanol. The peaks related to amide groups served as indicators of wine type and sweetness, while the 1580-950 cm⁻¹ range, rich in various compounds, indicated wine quality (Budziak-Wieczorek et al., 2023). Some peaks presented in other studies were not identified here, likely due to differences in grape types, yeast starter cultures, and winemaking and aging techniques.
The presence of carbonyl compounds, esters, acetates, terpenes, acids, alcohols, and phenols reflects the organoleptic properties in wine (Gómez-Míguez et al., 2007; Borren and Tian, 2020). Higher amounts of volatile acids produced by H. guilliermondii Y5P-T5 also caused a lower pH value in the wine, as previously described. The higher amount and varieties of esters produced by H. uvarum JF3-T1N could positively affect the aroma profile, as esters contribute to highly preferable fruity flavor and floral aroma profile (Benito et al., 2019; Dutraive et al., 2019; Borren and Tian, 2020). Acetaldehyde, one of the main carbonyl compounds observed in the produced wine, was an intermediate in acetic acid production, corroborating the results of Borren and Tian (2020). Overall, S. bacillaris WMP4-T4 and H. uvarum JF3-T1N exhibited a higher number of favorable volatile wine compounds compared to other non-Saccharomyces yeast strains, making them more preferable.
The sensors in the E-nose provided specific values for different wine samples. The corresponding sensory readings by the E-nose were defined as the ratio between the conductance of the wine sample (G) and the carrier gas or baseline signal (G0) over time (Gardner and Bartlett, 2000; Cao et al., 2020), effectively depicting the specific patterns of the sensor responses to the wine samples. The closely associated or overlapping wine samples in PCA possess almost the same sensory compounds and volatile aromas (Lozano et al., 2005). This indicates a similarity between H. guilliermondii Y5P-T5 and H. opuntiae J1Y-T1 in aroma profile, as well as a similarity between H. uvarum JF3-T1N and S. bacillaris WMP4-T4.
The E-nose sensor showed higher values in sensors R7, R8, and R9 for wines produced by H. uvarum JF3-T1N and S. bacillaris WMP4-T4, indicating a preferable aroma profile in winemaking. The higher response was shown for sensor R8 by all the strains correlated with their alcohol production. Wines produced by H. opuntiae J1Y-T1 and P. kudriavzevii Y8P-T8 contained higher amounts of terpenes, inorganic sulfur, and aromatic compounds than other sensory compounds. H. opuntiae J1Y-T1 showed a high level of broad-methane presence due to the response of sensor R6 during e-nose analysis, contributing to an unpleasant taste in wine, making it less preferable. The response for sensor R9 was significantly higher for H. uvarum JF3-T1N and S. bacillaris WMP4-T4, correlating with the GC-SPME results as they produced higher amounts of aromatic compounds. Hence, the volatile and other sensory compounds present in the wine samples can be confirmed based on the data produced from GC-MS-SPME and E-nose analyses.
Even though S. bacillaris WMP4-T4 and H. uvarum JF3-T1N were noted as the best candidates for wine production based on fermentation ability and volatile profile analysis, the wine produced with H. uvarum JF3-T1N preferred by panelists in sensory evaluation. Due to its production of more esters, which impart a more pleasant aroma and taste, reduce herbaceous flavor, and enhance color and clarity, H. uvarum JF3-T1N is the most preferred. Also, it has an acceptable alcohol percentage in wine (8.16 ± 0.05% v/v), less acetic acid, and contains significant amounts of residual sugars, making it more palatable (Figures 1, 2).
Considering all other analyses and fermentation kinetics, H. uvarum JF3-T1N appears to have advantages over other strains, making it preferable to use in coculture with Saccharomyces species in wine production. A recent study also revealed that the sequential inoculation of H. uvarum with S. cerevisiae enhanced the polyphenolic and volatile compounds of the final wine, resulting in pleasant characteristics (Testa et al., 2021).
This study confirmed the role of non- Saccharomyces yeasts from Sri Lankan grapes in wine sensory properties. Mixed culture applications of S. cerevisiae with non-Saccharomyces yeasts like Starmerella bacillaris, Pichia spp., and Hanseniaspora spp. could enhance flavor diversity and complexity (Martin et al., 2018; Benito et al., 2019; Dutraive et al., 2019; Vilela, 2019). Therefore, these selected strains can be used in coculture with S. cerevisiae to create starter cultures for wine production with favorable characteristics. Furthermore, immobilization techniques can be used to immobilize these cultures in the optimal carrier medium, allowing them to be reused for continuous winemaking process on a large scale (Moreno-García et al., 2018). These approaches will open up new avenues in the winemaking industry.
5 ConclusionAmong twenty-eight non-Saccharomyces yeast isolates from Vitis vinifera L., five strains—Hanseniaspora opuntiae J1Y-T1, Pichia kudriavzevii Y8P-T8, H. guilliermondii Y5P-T5, H. uvarum JF3-T1N, and Starmerella bacillaris WMP4-T4—demonstrated promising potential for fermentation, exhibiting rapid initial sugar consumption and efficient alcohol production. Notably, H. guilliermondii Y5P-T5 showed instant sugar utilization and growth but faced challenges with high alcohol concentrations later in fermentation. In contrast, H. uvarum JF3-T1N and S. bacillaris WMP4-T4 displayed superior alcohol tolerance, maintaining high alcohol levels (~8-10% v/v) and yeast biomass throughout the process. Each strain influenced wine acidity differently, with H. opuntiae J1Y-T1 and H. guilliermondii Y5P-T5 producing elevated acetic acid levels that negatively impacted wine quality, while H. uvarum JF3-T1N and S. bacillaris WMP4-T4 maintained lower acetic acid levels and a favorable pH range. The volatile compound profiles varied significantly among the analyzed wine samples, with H. uvarum JF3-T1N and S. bacillaris WMP4-T4 yielding more desirable aromatic compounds, particularly fruity and floral esters from H. uvarum, enhancing the wine’s sensory appeal. Due to its reduced herbaceous taste and enhanced color, H. uvarum JF3-T1N emerges as the preferred strain, showing great promise for coculture fermentations with S. cerevisiae to create wines that reflect Sri Lankan flavors. These findings underscore the critical role of strain selection in optimizing wine quality through controlled fermentation processes.
Data availability statementThe datasets presented in this study can be found in online repositories. The names of the repository/repositories and accession number(s) can be found in the article/Supplementary Material.
Author contributionsST: Data curation, Formal analysis, Investigation, Methodology, Project administration, Writing – original draft. DP: Data curation, Formal analysis, Writing – original draft. CG: Writing – review & editing. LU: Conceptualization, Project administration, Resources, Supervision, Validation, Writing – review & editing. PM: Resources, Supervision, Writing – review & editing. RN: Supervision, Writing – review & editing. PB: Supervision, Writing – review & editing. KT: Investigation, Project administration, Supervision, Writing – review & editing. FA-A: Supervision, Writing – review & editing. IP: Conceptualization, Supervision, Writing – review & editing.
FundingThe author(s) declare financial support was received for the research, authorship, and/or publication of this article. The research was funded by the research council of the University of Sri Jayewardenepura, Sri Lanka under the research grant number: ASP/01/RE/TEC/2021/83.
AcknowledgmentsWe would like to acknowledge the Department of Bio-systems Technology, Faculty of Technology, and the University of Sri Jayewardenepura, Sri Lanka, Department of Materials and Mechanical Technology, Faculty of Technology, University of Sri Jayewardenepura, Sri Lanka and Centre for water quality and algae research, Department of Zoology, Faculty of Applied Sciences, University of Sri Jayewardenepura, Sri Lanka for their assistance in carrying out this research. We also extend our gratitude to Chiang Mai University, Thailand for partial support of this research. The authors express their gratitude to the Deanship of Scientific Research (DSR) at King Faisal University (Project no. KFU241523).
Conflict of interestThe authors declare that the research was conducted in the absence of any commercial or financial relationships that could be construed as a potential conflict of interest.
Publisher’s noteAll claims expressed in this article are solely those of the authors and do not necessarily represent those of their affiliated organizations, or those of the publisher, the editors and the reviewers. Any product that may be evaluated in this article, or claim that may be made by its manufacturer, is not guaranteed or endorsed by the publisher.
Supplementary materialThe Supplementary Material for this article can be found online at: https://www.frontiersin.org/articles/10.3389/fcimb.2024.1495177/full#supplementary-material
ReferencesAlbergaria, H., Arneborg, N. (2016). Dominance of Saccharomyces cerevisiae in alcoholic fermentation processes: role of physiological fitness and microbial interactions. Appl. Microbiol. Biotechnol. 100, .2035–.2046. doi: 10.1007/s00253-015-7255-0
PubMed Abstract | Crossref Full Text | Google Scholar
Barnett, J. A., Payne, R. W., Yarrow, D. (2000). Yeasts- characteristics and identification. New York: Cambridge University Press.
Comments (0)