
Remember me


The central Veterans Affairs (VA) institutional review board (IRB) approved the MVP study. All relevant ethical regulations for work with human subjects were followed in the conduct of the study and informed consent was obtained from all participants. The iPSYCH study was approved by the scientific ethics committee in the Central Denmark Region (case no. 1-10-72-287-12) and the Danish Data Protection Agency. The QIMR Berghofer study was approved by the QIMR Berghofer Medical Research Institute Human Research Ethics Committee. The Yale–Penn study was approved by Yale Human Research Protection Program and University of Pennsylvania IRB.
Study designIn the previous PAU study9, the rg between MVP AUD and PGC AD was 0.98, which justified the meta-analysis of AUD (includes AUD and AD) across the two datasets, and the rg between AUD and UKB AUDIT–P was 0.71, which justified the proxy-phenotype meta-analysis of PAU (including AUD, AD and AUDIT–P) across all datasets. In this study, we use the same definitions, defining AUD by meta-analyzing AUD and AD across all datasets, and defining PAU by meta-analyzing AUD, AD and AUDIT–P (Table 1). No statistical method was used to predetermine sample size.
MVP datasetMVP enrollment and genotyping have been described previously17,18. MVP is a biobank supported by the United States Department of VA with rich phenotypic data collected using questionnaires and the VA electronic health record system.
MVP genotype data were processed by the MVP release 4 (R4) data team. A total of 729,324 samples were genotyped using an Affymetrix Axiom biobank array. Rigorous sample-level quality control (QC) served to remove samples with duplicates, call rates <98.5%, sex mismatches, >7 relatives or excess heterozygosity. After QC, MVP R4 data contained 658,582 participants and 667,995 variants (pre-imputation). Pre-imputation QC removed variants with high missingness (>1.5%), that were monomorphic, or with Hardy–Weinberg equilibrium (HWE) P value of ≤1 × 10⁻⁶, leaving 590,511 variants for imputation. As in our previous work, we ran a principal component analysis (PCA)61 for the R4 data and 1000 Genome phase 3 reference panels62. The Euclidean distances between each MVP participant and the centers of the five reference ancestral groups were calculated using the first ten principal components (PCs), with each participant assigned to the nearest reference ancestry. A second round of PCA within each assigned ancestral group was performed and outliers with PC scores >6 standard deviations from the mean of any of the 10 PCs were removed. This two-stage approach resulted in the assignment of 468,869 EUR ancestry, 122,024 AFR, 41,662 LA, 7,364 EAS and 536 SAS individuals for analysis.
Imputation was done by the MVP R4 data team. The entire cohort was prephased using SHAPEIT4 (v4.1.3) (ref. 63), then imputed using Minimac4 (ref. 64) with the African Genome Resources reference panel by the Sanger Institute and the 1000 Genomes Project phase 3 as reference. Single-nucleotide variants with an imputation score <0.8, HWE P value ≤1 × 10⁻⁶ or minor allele frequency (MAF) lower than the threshold set in each ancestral group based upon their sample size (EUR, 0.0005; AFR, 0.001; LA, 0.005; EAS, 0.01; and SAS, 0.01) were removed before association analysis.
Participants with at least one inpatient or two outpatient ICD-9/10 codes for AUD were assigned as AUD cases, while participants with zero ICD codes for AUD were controls. Those with one outpatient diagnosis were excluded from the analysis. In total, 80,028, 36,330, 10,150, 701 and 107 cases were included in EUR, AFR, LA, EAS and SAS, respectively, and 368,113, 79,100, 28,812, 6,254 and 389 controls were included in EUR, AFR, LA, EAS and SAS, respectively. BOLT-LMM65 was used to correct for relatedness, with age, sex and the first ten PCs as covariates.
UKBUKB released genotype and imputed data for ∼500,000 individuals from across the United Kingdom20, which were accessed through application 41910. UKB defined White-British (WB) participants genetically. For the non-WB individuals, we used a PCA to classify them into different genetic groups, as was performed for MVP. Individuals with available AUDIT–P scores were included in this study. The final sample included 132,001 WB (hereafter called UKB–EUR1) and 17,898 non-WB EURs (hereafter called UKB–EUR2), and 1,220 SAS. SNPs with genotype call rate >0.95, HWE P value >1 × 10⁻⁶, imputation score ≥0.8 and MAF ≥0.001 in EUR1 and EUR2 and ≥0.01 in SAS were kept for GWAS. BOLT-LMM was used for association correcting for relatedness, age, sex and the first ten PCs.
FinnGenSummary statistics for AUD from FinnGen data freeze 5 were downloaded from the FinnGen website (http://r5.finngen.fi/). Details of the genotyping, imputation and QC for FinnGen data were described previously19. There were 8,866 AUD cases defined by ICD-8/9/10 codes and 209,926 controls. Association analysis was performed using a SAIGE66 mixed model with age, sex and ten PCs as covariates. Positions of the variants were lifted over to build 37 (GRCh37/hg19) for meta-analysis.
iPSYCHThe iPSYCH21,22 samples were selected from a baseline birth cohort comprising all singletons born in Denmark between 1 May 1981 and 31 December 2008.
AUD was diagnosed according to the ICD-10 criteria (F10.1–F10.9 diagnosis codes). The iPSYCH cohort was established to investigate genetic risk for major psychiatric disorders (that is, attention-deficit/hyperactivity disorder, schizophrenia, bipolar disorder, major depressive disorder and autism spectrum disorder) but not AUD (or PAU), so comorbidity of psychiatric disorders among these AUD cases is higher than expected for cases selected randomly from the population. Therefore, we generated a control group around five times as large as the case groups and, to correct for the bias introduced by high comorbidity of psychiatric disorders among cases, we included within the control group individuals with the above listed psychiatric disorders (without comorbid AUD) at a proportion equal to what was observed among the cases.
The samples were genotyped in two genotyping rounds referred to as iPSYCH1 and iPSYCH2. iPSYCH1 samples were genotyped using Illumina’s PsychArray and iPSYCH2 samples using Illumina´s GSA v.2 (Illumina). QC and GWAS were performed using the Ricopili pipeline67. More details can be found in ref. 68. GWAS were performed separately for iPSYCH1 (2,117 cases and 13,238 controls) and iPSYCH2 (1,024 cases and 5,732 controls) using dosages for imputed genotypes and additive logistic regression with the first five PCs (from the final PCAs) as covariates using PLINK v1.9 (ref. 69). Only variants with a MAF >0.01 and imputation score >0.8 were included in the final summary statistics.
QIMR Berghofer cohortsThe AGDS recruited >20,000 participants with major depression between 2017 and 2020. Recruitment and subject characteristics have been reported23. Participants completed an online self-report questionnaire. Lifetime AUD was assessed on DSM-5 criteria using the Composite International Diagnostic Interview. A total of 6,726 individuals with and 4,467 without AUD were included in the present study.
The Australian twin family study of AUD (TWINS, including Australian Alcohol and Nicotine Studies) participants were recruited from adult twins and their relatives who had participated in questionnaire- and interview-based studies on alcohol and nicotine use and alcohol-related events or symptoms (as described in ref. 70). They were predominantly of EUR ancestry. Young adult twins and their non-twin siblings were participants in the Nineteen and Up study24. A total of 2,772 cases and 5,630 controls were defined using DSM-III-R and DSM-IV criteria. Most alcohol-dependent cases were mild, with 70% of those meeting AD criteria reporting only three or four dependence symptoms and ≤5% reporting seven dependence symptoms.
The GBP study recruited >5,000 participants living with bipolar disorder between 2018 and 2021. The sample’s recruitment and characteristics have been reported25: participants completed an online self-report questionnaire. Lifetime DSM-5 AUD was assessed using the Composite International Diagnostic Interview.
QIMR cohorts were drawn from larger batches genotyped over an extended period using several different Illumina genotyping microarrays. The microarrays used were (1) Global Screening Array v1 or v2 used for AGDS and GBP, and for TWINS participants either GSA (N = 48); (2) Illumina Omni or Core+Exome family chips (Core+Exome N = 1,023, PsychArray N = 255, OmniExpress N = 102 and 2.5M N = 321; total N = 1,701) or (3) older Illumina HapMap-derived chips (370K N = 3,728, 610K N = 2,319, 317K N = 580 and 660K N = 27; total N = 6,654). Per-batch imputation QC removed variants with GenTrain score <0.6, MAF <0.01, SNP call rate <95% and HWE deviation (P < 1 × 10⁻⁶). Genotypes from each of the three Illumina microarray families were merged for the core set of markers that passed QC in all batches, then were imputed using the TOPMed Imputation Server with the TOPMed-r2 reference panel64,71. The core set used ∼441K, ∼232K and ∼280K markers for (1), (2) and (3), respectively. Association analysis was performed using SAIGE with the LOCO = TRUE flag; age, sex, ten PCs and two covariates that model the three imputation runs, which were used for the individuals. Participants of non-EUR ancestry (defined as >6 standard deviations from the PC1 and PC2 centroids) were excluded. Association analyses were limited to variants with a MAF ≥0.0001, minor allele count ≥5 and an R2 ≥ 0.1.
PGCLifetime DSM-IV diagnosis of AD in both EUR and AFR ancestries were analyzed by PGC, with details reported previously8. This included 5,638 individuals from Australia. To avoid overlap with the new QIMR Berghofer cohorts, we re-analyzed the PGC data without two Australian cohorts: Australian Alcohol and Nicotine Studies and Brisbane Longitudinal Twin Study. This yielded 9,938 cases and 30,992 controls of EUR ancestry and 3,335 cases and 2,945 controls of AFR ancestry.
Yale–Penn 3There are three phases of the Yale–Penn study defined by genotyping epoch; the first two were incorporated in the PGC study, thus they are included in the meta-analyses. Here, we included Yale–Penn 3 individuals as a separate sample. Lifetime AD was diagnosed based on DSM-IV criteria. Genotyping was performed in the Gelernter laboratory at Yale using the Illumina Multi-Ethnic Global Array, then imputed using Michigan imputation server with Haplotype Reference Consortium reference. We performed PCA analyses to classify EAs (567 cases and 1,074 controls) and AAs (451 cases and 410 controls). Variants with MAF >0.01, HWE P value >1 × 10⁻⁶ and imputation quality score (INFO) ≥0.8 were retained for association analyses using linear mixed models implemented in GEMMA72 and corrected for age, sex and ten PCs.
EAS cohortsSummary statistics for AUD/AD GWAS from five EAS cohorts (MVP EAS, Han Chinese–GSA, Thai METH–MEGA, Thai METH–GSA and Han Chinese–Cyto) were included in the cross-ancestry meta-analysis. Analyses of these five cohorts were previously published and the detailed QC can be found in ref. 26.
Meta-analysesMeta-analyses were performed using METAL73 with effective sample size weighting. For all the case-control samples, we calculated effective sample size as:
$$_}=\frac_}}+\frac_}}}$$
For AUDIT–P in UKB, a continuous trait, we used actual sample sizes for meta-analysis. For all meta-analyses within or across ancestries, variants with a heterogeneity test P value <5 × 10⁻⁸ and variants with effective sample size <15% of the total effective sample size were removed. For the cross-ancestry and EUR within-ancestry meta-analyses, we required that variants were present in at least two cohorts. For the AFR and SAS within-ancestry meta-analyses, which are small samples, this was not required.
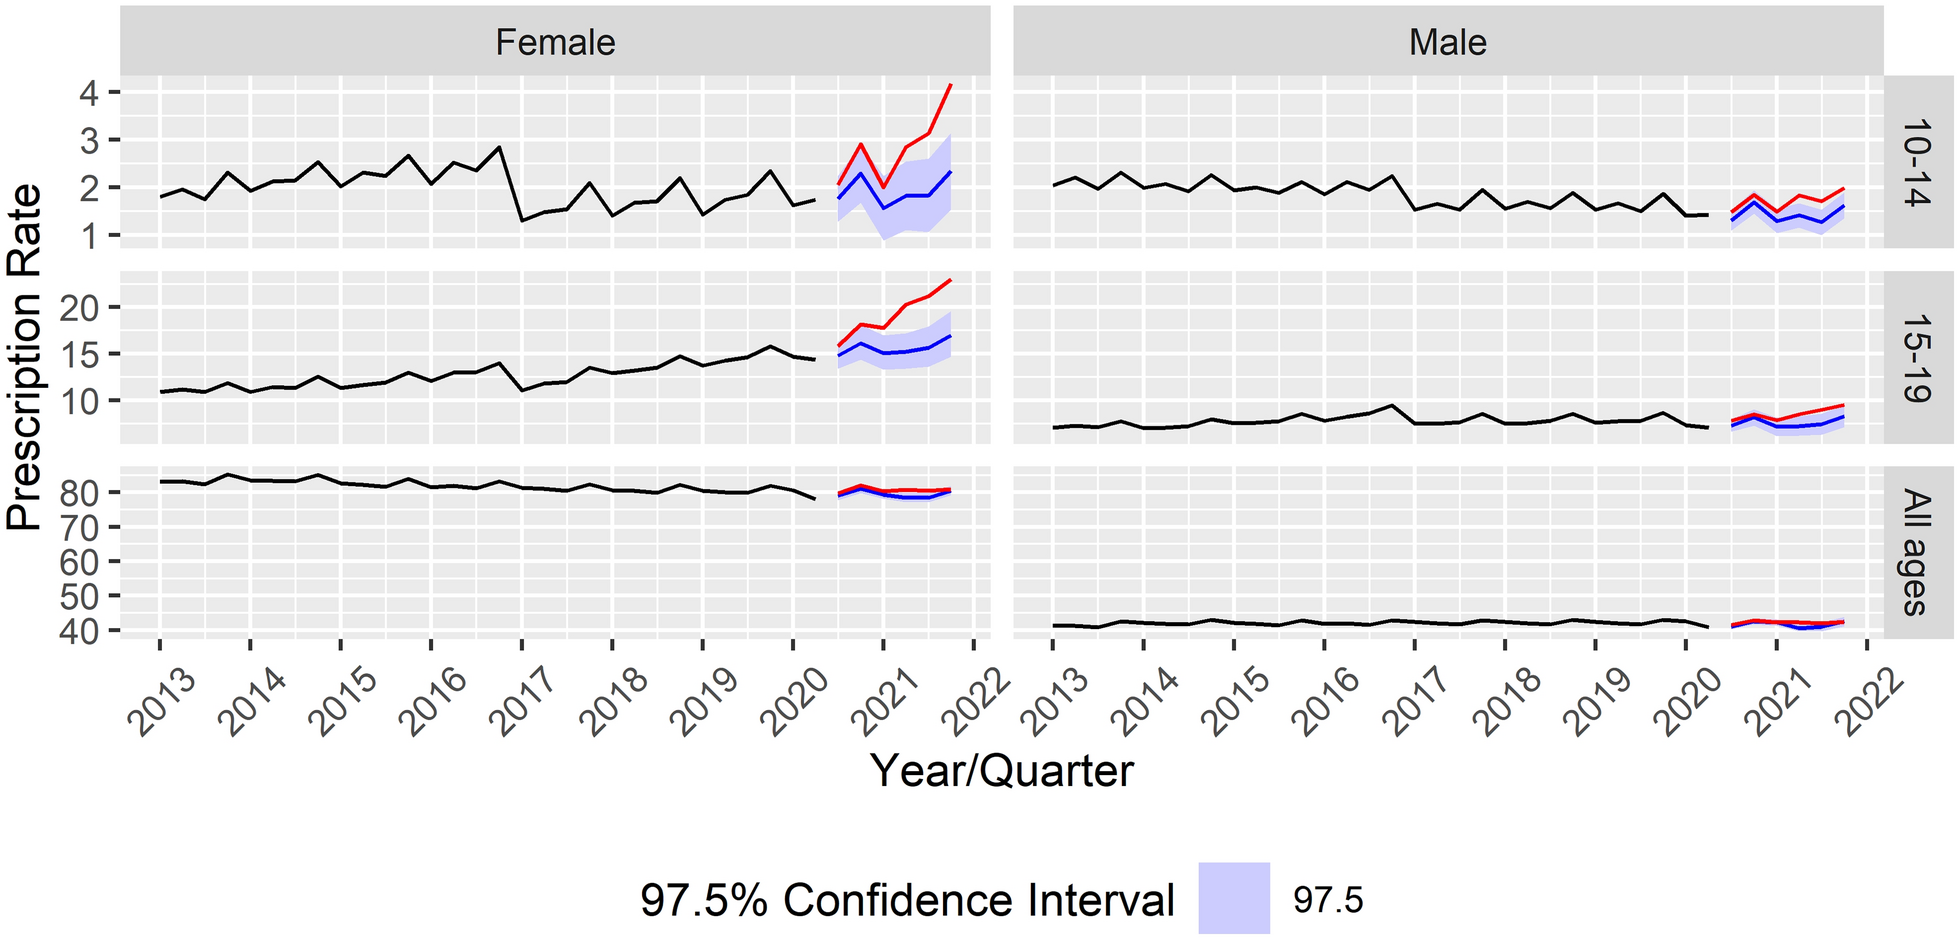
Sex-stratified analysesSex-stratified GWAS were performed in EUR. Seven cohorts with individual-level data available and a sample size >1,000 in both sexes were included: MVP, UKB–EUR1, UKB–EUR2, iPSYCH1, iPSYCH2, AGDS and TWINS. The same QCs and association analyses were applied as in the combined samples.
Independent variants and conditional analysesWe identified the lead variants using PLINK with parameters of clumping region 500 kb and LD r2 = 0.1. We then ran conditional analyses using Genome-wide Complex Trait Analysis conditional and joint analysis (GCTA-COJO)74 to define conditionally independent variants among the lead variants using the 1000 Genomes Project phase 3 as the LD reference panel. Any two independent variants <1 Mb apart whose clumped regions overlapped were merged into one locus.
Cross-ancestry lookupFor the 85 independent variants associated in EUR, we looked up the associations in non-EUR groups. If the variants were not observed in another ancestry, we substituted proxy SNPs defined as associated with PAU (P < 5 × 10⁻⁸) and in high LD with the EUR lead SNP (r2 ≥ 0.8).
SNP-based heritability (h 2)SNP-based h2 for common SNPs mapped to HapMap3 was estimated in EUR, AFR and LA ancestries using LD Score regression (LDSC)75; corresponding populations in the 1000 Genomes Project phase 3 were used as LD reference panels. For PAU in EUR, we only estimated the observed-scale h2. For AUD, both observed-scale h2 and liability-scale h2 were estimated, using population lifetime prevalence estimates of 0.326, 0.220 and 0.229 in EUR, AFR and LA, respectively2. These prevalence estimates were for lifetime DSM-5 AUD in the United States, which could introduce bias given the different definitions and prevalence in different cohorts. By default, LDSC removes SNPs with sample size <90th percentile N/2. Here, we skipped this filtering and kept all SNPs for analyses because we did basic filtering based on the number of cohorts and sample size. The final number of SNPs in the analyses ranged from 527,994 to 1.17M.
Cross-ancestry genetic correlationWe estimated the genetic correlations between different ancestries using Popcorn76, which can estimate both the genetic-effect correlation (ρge) as correlation coefficient of the per-allele SNP effect sizes and the genetic-impact correlation (ρgi) as the correlation coefficient of the ancestry-specific allele variance-normalized SNP effect sizes. Populations in 1000 Genomes were used as reference for their corresponding population. A large sample size and number of SNPs are required for accurate estimation, which explains the nonrobust estimates for EAS and SAS samples.
Within- and cross-ancestry fine mappingWe performed fine mapping using MsCAVIAR77, which can leverage LD information from multiple ancestries to improve fine mapping of causal variants. To reduce bias introduced by populations with small sample size, here we performed fine mapping using summary statistics from the EUR, AFR and LA populations. Three sets of analyses were conducted. The first is within-ancestry fine mapping for the 85 regions with independent variants in EUR using EUR summary data and 1000 Genomes Project phase 3 EUR LD reference data. For each region, we selected SNPs that clumped (within 500 kb and LD r2 > 0.1) with the lead SNP and with P < 0.05 for fine mapping. We then calculated the pair-wise LD among the selected SNPs. If two SNPs were in perfect LD (r2 = 1, indicating that they are likely to be inherited together), we randomly removed one from the analysis. The second is cross-ancestry fine mapping for the 100 regions with independent variants identified in cross-ancestry meta-analyses. For each region, we performed clumping (within 500 kb and LD r2 > 0.1) in EUR, AFR and LA summary data for the lead SNP separately, to select three sets of SNPs (P < 0.05) for fine mapping, with corresponding LD reference panels from the 1000 Genomes Project. For each set of SNPs, we calculated the pair-wise LD and randomly removed one SNP if r2 = 1. If the lead SNP was not presented in the EUR SNP set, we did not perform fine mapping for this region. Loci with limited numbers of variants cannot have convergent results, so they are not included in the results. After that, this cross-ancestry analysis included 92 regions. For the ten regions in which the lead SNPs are missing in both AFR and LA populations, we did within-ancestry fine mapping in EUR instead to keep the lead SNP (cross-ancestry fine mapping will only analyze the SNPs common in analyzed ancestries). Next, because the credible set length identified is related to the number of variants in the input, to provide a more direct comparison between the cross-ancestry fine mapping and the fine mapping using information only from EUR, we used the same lists of SNPs from the above 92 regions in the cross-ancestry fine mapping as for the EUR-only fine mapping. ‘Credible set’ was defined as plausible causal variants with accumulated PIP >99%. For each credible set, we report the variant with the highest PIP. We assumed that each locus contains only one causal variant by default, and increased to three at maximum if the analysis was unable to converge.
Gene-based association analysesWe performed gene-based association analysis for PAU or AUD in multiple ancestries using MAGMA implemented in FUMA78. Default settings were applied. Bonferroni corrections for the number of genes tested (range from 18,390 to 19,002 in different ancestries) were used to determine GWS genes.
TWASFor PAU in EUR, we performed TWAS using S-PrediXcan to integrate transcriptomic data from GTEx79. With prior knowledge that PAU is a brain-related disorder (evidenced by significant enrichment of gene expression in several brain tissues), 13 brain tissues were analyzed. The transcriptome prediction model database and the covariance matrices of the SNPs within each gene model were downloaded from the PredictDB repository (http://predictdb.org/). Significance of the gene–tissue association was determined following Bonferroni correction for the total number of gene–tissue pairs (P < 0.05/166,064 = 3.01 × 10⁻⁷). We also used S-MultiXcan to integrate evidence across the 13 brain tissues using multivariate regression to improve association detection. In total, 18,383 genes were tested in S-MultiXcan, leading to a significance P value threshold of 2.72 × 10⁻⁶.
Association with chromatin interactions in brainWe used H-MAGMA, a computational tool that incorporates brain chromatin interaction profiles from Hi-C, to identify risk genes associated with PAU based on EUR inputs. Six brain annotations were used: fetal brain, adult brain, adult midbrain dopaminergic, iPSC-derived astrocyte, iPSC-derived neuron and cortical neuron. In total, 319,903 gene–chromatin associations were analyzed across the six brain annotations. Significant genes were those with a P value below the Bonferroni corrected value for the total number of tests (P < 0.05/319,903 = 1.56 × 10⁻⁷).
Probabilistic fine mapping of TWASWe performed fine mapping for TWAS in EUR using FOCUS, a method that models correlation among TWAS signals to assign a PIP for every gene in the risk region to explain the observed association signal. The estimated credible set containing the causal gene can be prioritized for functional assays. FOCUS used 1000 Genomes Project EUR samples as the LD reference and multiple expression quantitative trait loci reference panel weights. Under the model of PAU as substantially a brain disorder, we did fine mapping while prioritizing predictive models using a brain tissue-prioritized approach.
Drug repurposingTo match inferred transcriptional patterns of PAU with transcriptional patterns induced by perturbagens, we related our S-PrediXcan results to signatures from the Library of Integrated Network-based Cellular Signatures L1000 database80. This database catalogs in vitro gene expression profiles (signatures) from thousands of compounds from >80 human cell lines (level 5 data from phase I: GSE92742 and phase II: GSE70138). Our analyses included signatures of 829 chemical compounds in five neuronal cell lines (NEU, NPC, MNEU.E, NPC.CAS9 and NPC.TAK). To test significance of the association between PAU signatures and Library of Integrated Network-based Cellular Signatures perturbagen signatures, we followed the procedure from So et al.81. Briefly, we computed weighted (by proportion of heritability explained) Pearson correlations between transcriptome-wide brain associations and in vitro L1000 compound signatures using the metafor package82 in R. We treated each L1000 compound as a fixed effect incorporating the effect size (rweighted) and sampling variability (se2) from all signatures of a compound (for example, across all time points and doses). We only report those perturbagens that were associated after Bonferroni correction (P < 0.05/829 = 6.03 × 10⁻⁵).
Cross-ancestry PRSWe used PRS-CSx, a method that couples genetic effects and LD across ancestries via a shared continuous shrinkage (CS) prior, to calculate the posterior effect sizes for SNPs mapped to HapMap3. Three sets of AUD GWAS summary data were use as input and corresponding posterior effect sizes in each ancestry were generated: EUR (without AUDIT–P from UKB, Neffective = 352,373), AFR (Neffective = 105,433) and LA (Neffective = 30,023). Three sets of AUD PRS based on the posterior effect sizes were calculated for UKB–EUR1 and UKB–EUR2 individuals using PLINK, following standardization (zero mean and unit variance) for each PRS. For each related pair (≥3rd degree, kinship coefficient ≥0.0442 as calculated by UKB), we removed the individual with the lower AUDIT–P score, or randomly if they had the same score, leaving 123,565 individuals in UKB–EUR1 and 17,401 in UKB–EUR2. Then, we ran linear regression for AUDIT–P in UKB–EUR2 as a validation dataset using PRSEUR, PRSAFR and PRSLA as independent variables. The corresponding regression coefficients were used as weights in the test dataset (UKB–EUR1) to calculate the final PRS: PRSfinal = ωEUR × PRSEUR + ωAFR × PRSAFR + ωLA × PRSLA. We used linear regression to test the association between AUDIT–P and PRSfinal after standardization, correcting for age, sex and the first ten PCs. We also ran a null model of association between AUDIT–P and covariates only, to calculate the variance explained (R2) by PRSfinal. For comparison, we also calculated PRS in UKB–EUR1 using only the AUD summary data in EUR, then calculated the variance explained by PRSsingle. The improved PRS association was measured as the difference of the variance explained (ΔR2).
Genetic correlationGenetic correlations (rg) between PAU or AUD and traits of interest were estimated using LDSC. For EUR, we tested rg between PAU and 49 traits using published summary data and the EUR LD reference from the 1000 Genomes Project. The rg with P values <1.02 × 10⁻³ were considered significant. For AFR, we tested rg between AUD and 13 published traits in AFR using MVP in-sample LD (most of the analyzed AFR were from MVP) built from 1,000 randomly selected AFR individuals by cov-LDSC83. The rg with P values <3.85 × 10⁻³ (0.05/13) in AFR were considered as significant. For comparison, we also tested rg using 1000 Genomes AFR as the LD reference, which showed similar estimates.
PAU PRS for phenome-wide associationsWe calculated PRS using PRS-CS for PAU (based on the EUR meta-analysis of PAU) in 131,500 individuals of EUR ancestry, and PRS for AUD (based on the AFR meta-analysis of AUD) in 27,494 individuals of AFR ancestry in four independent datasets (Vanderbilt University Medical Center’s Biobank, Mount Sinai (BioMe), Mass General Brigham Biobank (MGBB)84 and Penn Medicine Biobank (PMBB)85) from the PsycheMERGE Network86, followed by PheWAS. Details for each dataset are described below.
Vanderbilt University Medical Center’s BiobankGenotyping of individuals was performed using the Illumina MEGEX array. Genotypes were filtered for SNP and individual call rates, sex discrepancies and excessive heterozygosity using PLINK. Imputation was conducted using the Michigan Imputation Server based on the Haplotype Reference Consortium reference panel. PCA using FlashPCA2 (ref. 87) combined with CEU, YRI and CHB reference sets from the 1000 Genomes Project phase 3 was conducted to determine participants of AFR and EUR ancestry. One individual from each pair of related individuals was removed (\(}}\) > 0.2). This resulted in 12,384 AFR and 66,903 EUR individuals for analysis.
BioMeFrom the BioMe biobank, the Illumina Global Screening Array was used to genotype the BioMe samples. The SNP-level QC removed SNPs with (1) MAF <0.0001, (2) HWE P value ≤1 × 10⁻⁶ and (3) call rate <98%. The individual-level QC removed participants with (1) sample call rate <98% and (2) heterozygosity F coefficient ≥3 s.d. In addition, one individual from each pair of related samples with a genomic relatedness (proportion identity by descent) >0.125 was removed (–rel-cutoff=0.125 in PLINK). Imputation was performed using 1000 Genomes phase 3 data. Each ancestry was confirmed by the genetic PC plot. A final sample size of 4,727 AFR and 9,544 EUR individuals were included for this study.
MGBBIndividuals in the MGBB were genotyped using the Illumina Multi-Ethnic Global array with hg19 coordinates. Variant-level QC filters removed variants with a call rate <98% and those that were duplicated across batches, monomorphic, not confidently mapped to a genomic location or associated with genotyping batch. Sample-level QC filters removed individuals with a call rate less than 98%, excessive autosomal heterozygosity (±3 s.d. from the mean) or discrepant self-reported and genetically inferred sex. PCs of ancestry were calculated in the 1000 Genomes phase 3 reference panel and subsequently projected onto the MGBB dataset, where a random forest classifier was used to assign ancestral group membership for individuals with a prediction probability >90%. The Michigan Imputation Server was then used to impute missing genotypes with the Haplotype Reference Consortium dataset serving as the reference panel. Imputed genotype dosages were converted to hard-call format and subjected to further QC, where SNPs were removed if they exhibited poor imputation quality (INFO <0.8), low MAF (<1%), deviations from HWE (P < 1 × 10⁻¹⁰) or missingness (variant call rate <98%). Only unrelated individuals (\(}}\) < 0.2) of EUR ancestry were included in the present study. These procedures yielded a final analytic sample of 25,698 individuals in the MGBB.
PMBBPMBB is approved under IRB protocol no. 813913. Genotyping of individuals was performed using the Illumina Global Screening Array. QC removed SNPs with marker call rate <95% and sample call rate <90%, and individuals with sex discrepancies. Imputation was performed using Eagle2 (ref. 88) and Minimac4 on the TOPMed Imputation Server. One individual from each pair of related individuals (\(}}\) threshold of 0.25) were removed from analysis. PCA was conducted using smartpca61 and the HapMap3 dataset to determine genetic ancestry. This resulted in 10,383 AFR and 29,355 EUR individuals for analysis.
PheWASThe AFR AUD PRS and EUR PAU PRS scores in each dataset were standardized for the PheWAS analyses. ICD-9 and -10 codes were extracted from the electronic health record and mapped to phecodes. Individuals were considered cases if they had two instances of the phecode. We conducted PheWAS by fitting a logistic regression for each phecode within each biobank. Covariates included sex, age and the top ten PCs. PheWAS results were meta-analyzed within each ancestral group across biobanks (AFR 27,494 and EUR 131,500) using the PheWAS package89 in R. Phecodes with Ncase < 100 were removed, resulting in the testing of 1,493 phenotypes in EUR and 793 in AFR. We applied a Bonferroni correction to control for multiple comparisons (P < 0.05/1493 = 3.35 × 10⁻⁵ in EUR and P < 0.05/793 = 6.31 × 10⁻⁵ in AFR).
Yale–PennWe also conducted PheWAS in Yale–Penn, a deeply phenotyped cohort with comprehensive psychiatric assessments (SUDs and psychiatric disorders) and assessments for physical and psychosocial traits28. QC and creation of the PheWAS dataset have been described previously90. We calculated PRS for PAU in EUR and AUD in AFR (using summary statistics that leave out the Yale–Penn 3 and PGC sample, which includes Yale–Penn 1). We conducted PheWAS by fitting logistic regression models for binary traits and linear regression models for continuous traits. We used sex, age at recruitment and the top ten genetic PCs as covariates. We applied a Bonferroni correction to control for multiple comparisons.
Reporting summaryFurther information on research design is available in the Nature Portfolio Reporting Summary linked to this article.
Comments (0)