
Remember me

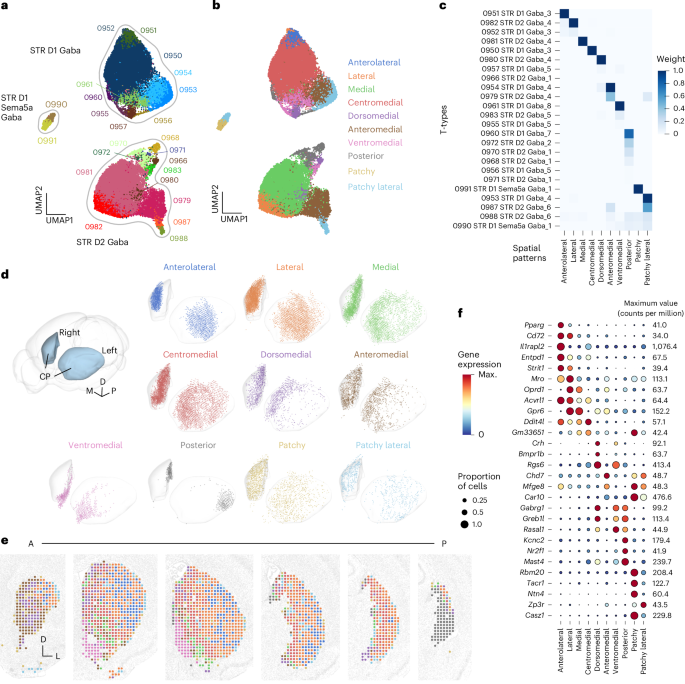

To reveal the spatial patterns of t-types of the basal ganglia and thalamic PF nucleus, we analyzed the scRNA-seq and MERFISH data from the ABC Atlas37. We curated 24 striatal MSN t-types enriched in CP across 3 transcriptomic subclasses: dopamine D1 receptor-expressing direct-pathway MSNs (STR D1 Gaba), dopamine D2 receptor-expressing indirect-pathway MSNs (STR D2 Gaba) and atypical MSNs (STR D1 Sema5a Gaba), which contain some ‘hybrid’ neurons expressing dopamine D1 receptors and a short variant of the D2 receptor (Fig. 1a).
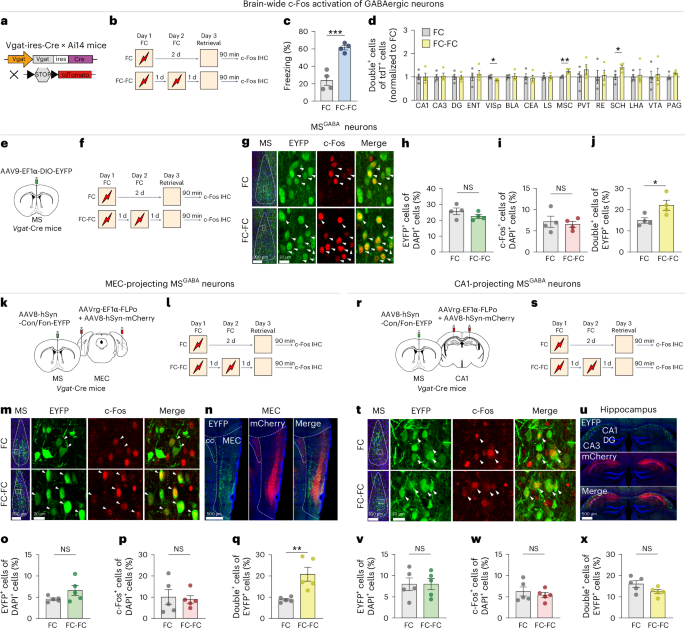
Fig. 1: Distinct spatial patterns of the transcriptomic MSN types in CP. The alternative text for this image may have been generated using AI.
a, Transcriptomic Uniform Manifold Approximation and Projection (UMAP) plot of the 24 t-types of MSNs in the CP. The t-types are labeled by color and number; see c for full names. Outlines indicate transcriptomic subclasses. b, Spatial patterns of these MSN t-types in the same UMAP as a. c, Weight matrix between CP MSN t-types (rows) and spatial patterns (columns). Note that most t-types predominantly belong to a single spatial pattern. d, Three-dimensional views of MSN t-type spatial patterns determined by NMF analysis (Methods). e, The 2D coronal views of MSN t-type spatial patterns from anterior (A) to posterior (P). Each spatial bin is colored by the spatial pattern with the highest weight in that bin. f, Marker gene expression dot plot illustrating differences across spatial patterns. The dot size represents the proportion of neurons in that spatial pattern that expresses the gene and the color represents the level of gene expression. Maximum (Max.) values for that gene (as counts per million) are shown on the right.
Using the spatial distributions of these t-types from the MERFISH dataset, we performed an unsupervised, learning, non-negative matrix factorization (NMF) analysis (Methods) to reveal spatial patterns shared by these MSN t-types. Spatial histograms were calculated from the MERFISH t-type distributions and the NMF algorithm found a ‘dictionary’ of spatial patterns (each pattern consisting of a set of weights for each spatial bin) that best described the data. Using a stability-based criterion to select the optimal number of patterns for the dictionary46, we identified ten MSN spatial patterns in the CP (Fig. 1b–e). After calculating the coefficient weight matrix, which was multiplied by the spatial patterns to estimate the t-type spatial distributions, we observed that most t-types had a high coefficient for only a particular spatial pattern each (Fig. 1c). Several spatial patterns were associated with both dopamine D1 receptor-expressing and D2 receptor-expressing MSN t-types (for example, anterior medial and patchy lateral patterns). Others had either the D1 or D2 t-type only. However, as the spatial patterns identified by the NMF analysis are not strictly mutually exclusive, but rather can have substantial overlap, we noted that many of these patterns had overlapping counterparts containing the other type (for example, D1-specific anterior lateral versus D2-specific lateral and D2-specific medial versus D1-specific central medial). Most coefficient weights estimated by the NMF analysis were robust across multiple replicates (Supplementary Fig. 1).
Given the strong association between MSN t-types and individual spatial patterns, we sought to identify marker genes that could distinguish these spatial patterns alone or in combination (Fig. 1f). We grouped t-types by the spatial patterns for which they had the strongest weight and identified differentially expressed genes (DEGs) for those groupings using the scRNA-seq dataset37. Although some patterns could be identified using individual marker genes, most required a combination of markers for specific discrimination (Fig. 1f). These spatially resolved MSN t-types labeled by specific marker genes and registered to the CCFv3 average template served as a foundational reference for delineating CP subdivisions.
We extended this spatial analysis to other basal ganglia and PF nuclei, identifying distinct spatial patterns of t-types across these nuclei. Two spatial patterns were exhibited in GPe (Extended Data Fig. 1a–e), with the lateral containing clusters from subclasses GPe-SI Sox6 Cyp26b1 Gaba (likely corresponding to previously described Penk+ or Npas1+ neurons) and NDB-SI-MA-STRv Lhx8 Gaba (corresponding to Pvalb+ neurons), and the medial containing cluster no. 927 of subclass PAL-STR Gaba-Chol (Chat+ cholinergic neurons)47,48 (where: SI, substantia innominata; NDB, diagonal band nucleus; MA, magnocellular nucleus; STRv, striatum ventral region; and PAL, pallidum). Two spatial patterns exhibited in GPi (Extended Data Fig. 1f–j) had the shell containing clusters from subclass GPi Tbr1 Cngb3 Gaba-Glut (corresponding to Sst+ glutamate-GABA co-releasing neurons) and the core containing the unique cluster no. 1,731 (corresponding to Pvalb+ neurons) of subclass ZI Pax6 Gaba29 (where ZI is zona incerta). Two spatial patterns exhibited in STN (Extended Data Fig. 2a–e) are posterior ventral (STNpv) and anterior dorsal (STNad), along with a parasubthalamic nucleus (PSTN)-specific pattern, each containing different clusters of the STN-PSTN Pitx2 Glut subclass. Five spatial patterns were exhibited in SNr (Extended Data Fig. 2f–j), sparse medial, medial, central, posterior central and anterior central, each containing different clusters from subclasses SNr-VTA Pax5 Npas1 Gaba and SNr Six3 Gaba (where VTA is the ventral tegmental area). Five spatial patterns were exhibited in PF, medial (PFm), dorsal (PFd), central (PFc), posterior lateral (PFpl) and anterior lateral (PFal), each containing different clusters from the PF Fzd5 Glut subclass (Extended Data Fig. 3). These spatial arrangements were independently validated using ISH data38 (Extended Data Figs. 4–6).
Delineation of subdivisions of the basal ganglia and PF nucleusTo delineate three-dimensional (3D) subdivisions, we co-registered multimodal reference datasets (cytoarchitecture, myeloarchitecture, chemoarchitecture, genoarchitecture and connectivity) into the CCFv3 average template. Cytoarchitecture, myeloarchitecture and chemoarchitecture were particularly useful for gross nucleus boundaries (Supplementary Fig. 2), whereas finer distinctions relied heavily on genoarchitecture and connectivity (Fig. 2).
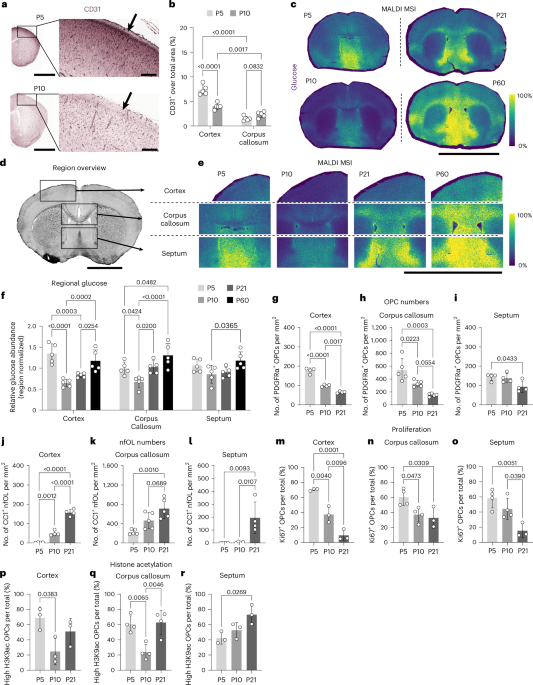
Fig. 2: The 3D delineation of the basal ganglia and PF subdivisions in the CCFv3 average template. The alternative text for this image may have been generated using AI.
a–e, The 3D delineation of five CP subdivisions, CPvm (a), CPl (b), CPdm (c), CPiv (d) and CPp (e), based on multimodal reference datasets. Inherent contrast, reflecting cytoarchitectural difference in the CCFv3 average template, is brighter in CPl, CPiv and CPp than CPdm and CPvm in coronal sections. Red lines in the top row and white lines in the second and third rows show the borders of five CP subdivisions defined by a combination of ISH data (pink), transgenic lines (cyan) and connectivity (yellow). These references, overlaid with the average template, are shown in corresponding coronal views (second row) and horizontal views (third row). f,g, Manually delineated CP subdivisions in the lateral (f) and medial (g) 3D views labeled with distinct colors. h, Relationship between CP t-type spatial patterns and subdivisions. Top row: five CP subdivisions with different colors in a series of coronal sections from anterior to posterior. Below this, weights of the eight spatial patterns of the t-type clusters from NMF analysis are labeled (in red) in coronal sections corresponding to the top row. They are related to module-specific cortical projections in CP subdivisions. i, The 3D subdivisions of the smaller basal ganglia nuclei GPe, GPi, STN and SNr and the thalamic PF nucleus delineated manually based on multimodal references and coded with different colors. The abbreviations represent cortical inputs (in white), gene expression (in cyan), transgenic lines (in yellow) and spatial patterns of t-types (in green) for the delineations. The distinct spatial patterns of t-types in the basal ganglia and PF nucleus are detailed in Extended Data Figs. 1–3. Full neuroanatomical terms for the abbreviations are shown in Supplementary Table 1. AUD, auditory cortical module; LAT, lateral cortical module; MED, medial cortical module; PREF, prefrontal cortical module; SOM, somatomotor cortical module; VIS, visual cortical module.
By integrating multimodal information, we manually delineated five 3D subdivisions for CP: ventromedial (CPvm), lateral (CPl), dorsomedial (CPdm), intermediate-ventral (CPiv) and posterior (CPp) (Fig. 2a–h). Cytoarchitecturally, CPdm and CPvm exhibited smaller, darker neuronal clusters reminiscent of striosomes, which were enriched in Pydn expression and labeling of Chrna2-Cre_OE25 (Extended Data Figs. 4 and 7j), whereas CPl, CPp and CPiv exhibited higher neuron density than CPdm and CPvm (Supplementary Fig. 2a,k). This cytoarchitectural difference was reflected in the inherent contrast in the CCFv3 average template (CPl, CPp and CPiv brighter than CPdm and CPvm) (Fig. 2a–e) and aligned with distinct gene expression, connectivity and fluorescent signals of transgenic mouse lines showing axons derived from neurons expressing Cre in different layers of cortical areas or neurons enriched in expression of certain genes in the CP and other basal ganglia nuclei.
CPvm was enriched in expression of Col6a1 and received strong inputs from the prelimbic (PL) area and orbital (ORB) area in transgenic mouse lines Sim1-Cre, Grp-Cre_KH288, Rbp4-Cre_KL100 and Ntsr1-Cre_GN220 and also from PL and ORB injections (Fig. 2a, Extended Data Fig. 7a–c and Supplementary Figs. 3 and 4). CPl was enriched in expression of Astn2, Acvrl1 and Deptor and received strong inputs from somatosensory (SS) and motor (MO) areas in transgenic lines Trib2-T2A-CreERT2 and Slc17a8-IRES2-Cre and also from SS and MO injections (Figs. 2b and 3c, Extended Data Fig. 7h–i and Supplementary Figs. 3 and 4). CPdm was enriched in expression of Fos, exhibited dense axons from anterior cingulate areas (ACAs) in transgenic line Calb2-IRES-Cre and received inputs from injections into the ACA, visual (VIS) and retrosplenial (RSP) areas (Figs. 2c and 3c and Supplementary Figs. 3 and 4). CPiv was enriched in expression of Wfs1, exhibited fluorescent signals of transgenic lines Etv1-CreERT2, Calb1-T2A-dgCre, Nr5a1-Cre, Sst-IRES2-Cre and Glt25d2-Cre_Nf107 and received strong inputs from injections into the anterior insular (AI), gustatory (GU) and visceral (VISC) areas (Figs. 2d and 3c, Extended Data Fig. 7d–g and Supplementary Figs. 3 and 4). Calb1 antibody staining also showed denser neurons in CPiv than in the rest of the CP (Supplementary Fig. 2p,q). The CPp was enriched in the expression of Otof, exhibited dense neurons in the transgenic line Tacr1-T2A-Cre and received dominant auditory (AUD) cortical inputs (Figs. 2e and 3c and Supplementary Figs. 3 and 4).
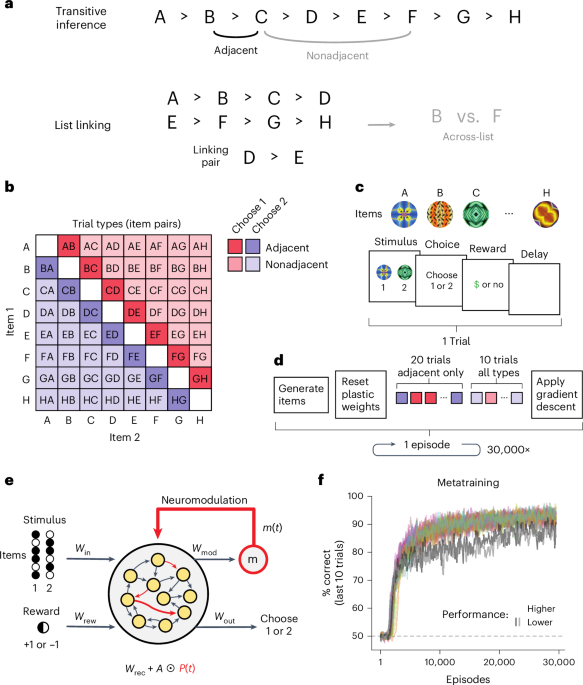
Fig. 3: Cortical and subcortical module-specific projections in five CP subdivisions revealed with anterograde AAV tracing. The alternative text for this image may have been generated using AI.
a, Centroids of injection sites in cortical (cyan) and subcortical (light-pink) structures projecting to CP visualized in the dorsal and lateral views. These injections were used for generating matrices in b. b, Matrices (ipsilateral and contralateral) showing the fractional density of axons contained in each subdivision normalized by the subdivision volume for five CP subdivisions (columns) from individual cortical and subcortical injection experiments (rows). Six cortical modules and eight major subcortical structures are labeled with different colors to the left of the brain regions. c, Representative examples of injections in the ACAv and RSP of the medial module, VISp of the visual module, SSp and MOp of the somatomotor module, GU of the lateral module and the primary auditory area (AUDp) of the auditory module, showing projections to CPdm, CPl, CPiv and CPp, respectively. Left: whole-brain projections from these cortical areas in dorsal view. The black dot indicates the injection site and the dashed line (in red) the CP boundary. Right: projections in representative coronal, sagittal and horizontal sections. d, Isocortical areas (left) and modules (right) on flatmap, with white dots representing the centroids of injection sites on the flatmap and their laminar locations on the top and right of the flatmap. Thick colored lines indicate the borders of cortical modules and thin white lines indicate the borders of cortical areas. e, Matrix for pairwise comparison of projection overlap in the ipsilateral CP generated from L5 IT neurons of these cortical areas. Pairwise Dice coefficients are calculated as the ratio of 2× intersecting voxels to the sum of voxels in both projection volumes; values range from 0 (no overlap) to 1 (perfect overlap). Cortical modules on the left side of the matrix are color coded as in b and d. f, Representative examples of subcortical projections in different CP subdivisions shown in coronal views. Scale bar: 930 µm in c and f. Contr., contralateral; Ipsi., ipsilateral. OLF, olfactory areas; HPF, hippocampal formation; CTXsp, cortical subplate; CNU, cerebral nuclei; TH, thalamus; HY, hypothalamus; MB, midbrain; P, pons.
These five CP subdivisions are shown in the lateral and medial 3D views, with CPl being the largest and CPp the smallest (Fig. 2f,g). CP subdivisions were related to eight spatial transcriptomic patterns that had a unique relationship with module-specific cortical inputs (Fig. 2h). Some of the spatial patterns closely aligned with individual CP subdivisions (for example, CPp with the posterior pattern and CPl with the lateral and anterior lateral patterns), whereas other patterns covered more than one subdivision. Using the adjusted Rand index (ARI) (Methods), quantitative comparison between the spatial transcriptomic patterns and manual CP subdivisions indicated moderate concordance (ARI ≈ 0.19), increasing (ARI ≈ 0.28) after merging closely related spatial patterns (that is, the D1-specific anterior lateral and D2-specific lateral and the D2-specific medial and D1-specific central medial).
Using analogous multimodal criteria, we manually delineated subdivisions in additional nuclei. GPe was divided into medial (GPe-m) and lateral (GPe-l) subdivisions (Fig. 2i, Extended Data Figs. 1a–e, 5a and 7k–m and Supplementary Figs. 2b,v and 5). GPi was divided into core (GPi-co) and shell (GPi-sh) subdivisions (Fig. 2i, Extended Data Figs. 1f–j, 5b and 7n,o and Supplementary Fig. 6). STN was divided into posteroventral (STNpv) and anterodorsal (STNad) subdivisions (Fig. 2i, Extended Data Figs. 2a–e, 5c and 7p,q and Supplementary Fig. 7). SNr was divided into five subdivisions: dorsomedial (SNr-dm), ventromedial (SNr-vm), central (SNr-c), dorsolateral (SNr-dl) and lateral (SNr-l) (Fig. 2i, Extended Data Figs. 2f–j, 5d and 7r and Supplementary Fig. 8). PF was divided into four subdivisions: dorsal (PFd), medial and central (PFm/c), lateral (PFl) and ventromedial (PFvm) (Fig. 2i, Extended Data Figs. 3, 6 and 7s,t and Supplementary Fig. 9).
Cortical and subcortical module-specific and cell-type-specific projections in the basal ganglia and PF nucleusTo reveal projection organization, we curated anterograde viral tracing data from the Allen Mouse Brain Connectivity Atlas39,40, selecting hundreds of cortical and subcortical injections with basal ganglia and PF projections and minimal contamination (Fig. 3a and Supplementary Table 1). Across the isocortex, all areas projected to one or more CP subdivisions with different axon densities; axon terminal fields were typically elongated along the anteroposterior axis of CP in the dorsal view (Fig. 3b,c and Supplementary Fig. 3). Prefrontal, lateral and somatomotor cortical areas sent stronger and wider projections to bilateral CP than medial, visual and auditory cortical areas. The contralateral projections mirrored the ipsilateral patterns but were generally weaker. Representative examples showed axon terminals in different CP subdivisions from 42 cortical areas (Fig. 3c and Supplementary Figs. 3 and 4).
CPdm received convergent inputs strongly from ACA and VIS but weakly from RSP and AUD areas. Convergent inputs to CPdm were also observed from different visual fields of the primary visual area (VISp), which sent segregated projections in the superior colliculus and lateral geniculate nucleus dorsal part (LGd) (Extended Data Fig. 8a–c). CPvm received inputs strongly from the PL, frontal pole (FRP) and ORB but weakly from the infralimbic area (ILA). CPiv received convergent inputs from the VISC, GU and the ectorhinal (ECT) area. CPp received inputs from AUD, temporal association area (TEa) and posterior VIS. CPl received somatotopic yet convergent inputs from subregional SS and MO cortical areas with mouth (m) and nose (n) subregions ventrally and upper limb (ul), lower limb (ll), trunk (tr) and barrel field (bfd) subregions dorsally (Extended Data Fig. 8a,d–h). VISp and primary SS area (SSp) sent fewer axon projections to the CP than higher visual areas, supplementary SS areas (SSs) and motor cortical areas (Fig. 3b). Some cortical areas, PL and ILA, sent more projections to the striosomes than to the matrix (inset in Supplementary Fig. 4).
To assess cortical cell-type contributions, we analyzed average axonal density in CP using Cre-dependent AAV injections into 38 cortical areas of transgenic mouse lines (Supplementary Fig. 10a). We found that both excitatory and inhibitory neurons projected to the CP with different axon densities, although projections from inhibitory interneurons were very weak (Supplementary Fig. 10b). Excitatory projections to the CP were from layer (L) 2 or 3 (L2/3) intratelencephalic (IT), L4 or L5 (L4/5) IT, L5 IT and L5 extratelencephalic (ET) neuronal types across cortical areas. L2/3 IT neurons sent weak projections to bilateral CP with an ipsilateral predominance. L5 IT neurons sent more stronger projections to CP bilaterally than any other excitatory neuronal types (Supplementary Fig. 10b,c). L5 ET neurons sent projections to the ipsilateral CP (Supplementary Fig. 10c). L6 CT neurons sent very sparse projections to the ipsilateral CP from several cortical areas of Syt6-Cre_KL148 and Ntsr1-Cre_GN220 mice (Supplementary Fig. 10b,c). As these L6 corticothalamic (CT) transgenic lines exhibit weak gene expression in deep L5 neurons and injections into them show axon labeling in the midbrain, such sparse projections to the CP could possibly be from L5 ET neurons rather than L6 CT neurons. For the inhibitory interneurons, we found sparse projections to the ipsilateral or bilateral CP from injections into seven cortical areas of Sst-IRES-Cre mice and injections into two cortical areas of Pvalb-IRES-Cre and Pvalb-T2A-CreERT2 mice (Supplementary Fig. 10b). In addition to the CP, we also observed projections in the thalamus and pontine from injections into the VISp and SSp of Pvalb Cre mice. Therefore, Pvalb neuron projections to the CP could possibly be derived from L5 ET neurons because Pvalb Cre mice are known to label these structures.
Cortical areas have been partitioned into six modules based on corticocortical and CT connections39: prefrontal, lateral, somatomotor, medial, visual and auditory. Injections into L5 as well as in other layers are shown (Fig. 3d). To reveal whether excitatory projections from cortical areas are spatially segregated, we measured pairwise Dice coefficients to quantitatively analyze overlapping projections in the ipsilateral CP, focusing on L5 IT neuron projections to minimize contamination by passing fibers. The overlapping projections within the CP were clustered by cortical modules (Fig. 3e). The module-organized cortical inputs in CP subdivisions were largely confirmed by hierarchical cluster analysis and 79% of them could be predicted by the confusion matrix (Supplementary Table 4). The six cortical modules observed in this study (Fig. 3d,e) have slightly different compositions compared to those in the previous study39. The medial module consists of ACA and RSP. The prefrontal module consists of FRP, PL, ILA and ORB. The lateral module consists of AI, GU, VISC and ECT. The auditory module consists of AUD and TEa. The somatomotor module consists of SSp, SSs, primary motor area (MOp) and secondary motor area (MOs). The visual module consists of ten visual cortical areas41,42 (Fig. 3b) that are divided into dorsal and ventral streams (Fig. 3e).
The medial and visual modules mainly projected to CPdm, the prefrontal module to CPvm, the somatomotor module to CPl, the lateral module to CPiv and the auditory module to CPp (Fig. 3b–e and Supplementary Figs. 3 and 4). The medial, visual and auditory modules clustered by their overlapping inputs, whereas the somatomotor, lateral and prefrontal modules clustered together (Fig. 3e and Supplementary Table 4). Somatomotor module inputs overlapped more with the dorsal stream visual areas than the ventral stream visual areas. No overlapping inputs were observed from mouth and nose subregions of SSp, SSs, MOp and MOs with those from the medial, visual and auditory modules (Fig. 3e and Supplementary Fig. 4).
Unlike the CP, the smaller basal ganglia nuclei (GPe, GPi, STN and SNr) received inputs from limited cortical areas. GPe-m and GPe-l received inputs from the medial cortical module and somatomotor module, respectively (Supplementary Fig. 5). GPi-co and GPi-sh received inputs from the medial module and somatomotor module (except SSp), respectively (Supplementary Fig. 6). STNad and STNpv received inputs from the somatomotor module and the medial and prefrontal modules, respectively (Supplementary Fig. 7). In addition to SNr-l receiving CPp input, four SNr subdivisions received inputs from different cortical areas: motor input to SNr-c, ACA input to SNr-vm, PL input to SNr-dm (Supplementary Fig. 8), and Al and GU input to SNr-dl.
PF subdivisions also received module-biased cortical inputs (Supplementary Fig. 9). PFl, including both PFal and PFpl defined by spatial t-types, received somatomotor inputs with rough somatotopic organization (Supplementary Fig. 9a–f). PFd received medial, visual and/or auditory module inputs (Supplementary Fig. 9g–l), PFm/c received prefrontal module inputs with subregional specificity (Supplementary Fig. 9m–q), and PFvm received lateral module inputs (Supplementary Fig. 9r–t).
Some subcortical structures in olfactory areas, hippocampal formation, cortical subplate, cerebral nuclei, thalamus, hypothalamus, midbrain and pons sent projections to one or more subdivisions of the CP with different axon densities (Fig. 3b,f and Supplementary Fig. 11). The basolateral amygdala nucleus (BLA), ventromedial nucleus (VM), PF and substantia nigra pars compacta (SNc) sent denser projections to the CP than other subcortical regions. Most of the subcortical structures, such as thalamic nuclei, sent projections to the ipsilateral CP and a few regions, such as the nucleus of the lateral olfactory tract (NLOT), entorhinal area (ENT) and BLA sent projections to the bilateral CP with an ipsilateral predominance. The intralaminar thalamic nuclei, central medial nucleus (CM) and paracentral nucleus (PCN), projected strongly to the CP. The higher-order visual thalamic nucleus, lateral posterior nucleus (LP), consists of the rostromedial (LPrm) and caudolateral (LPcl) subdivisions which projected to the anterior CPdm and posterior CPdm, respectively. The auditory thalamic nuclei, suprageniculate nucleus (SGN), medial geniculate nucleus (MG) and posterior intralaminar nucleus (PIL) sent projections to CPp. The somatomotor-related thalamic nuclei, VM, ventral anterolateral complex (VAL), posterior complex (PO), ventral posteromedial nucleus (VPM) and ventral posterolateral nucleus (VPL), sent projections to CPl. BLA sent denser projections to CPiv and CPvm than to CPdm, CPl and CPp (Fig. 3b). ENTl projected to CPp, CPiv and CPdm, densely and moderately to CPvm, but barely to CPl. Projections from midbrain nuclei SNc, VTA and medial accessory oculomotor nucleus (MA3) displayed topographic mapping across CP subdivisions, with more to the matrix than to the striosomes (Fig. 3b and Supplementary Fig. 12).
Cortical cell-type-specific, single-neuron projections in the subdivisions of the basal gangliaTo validate bulk tracing patterns, we analyzed 6,417 fully reconstructed single pyramidal neurons collected across datasets (Supplementary Table 2)17,43,44,45. For visualization and comparison, all neurons were flipped to the right cortex (Fig. 4a). Neurons were reclassified into major cell types: L2/3 IT, L5 IT, L5 ET, L6 IT and L6 CT neurons based on projection targets (Methods). Aggregated axon arbors across types recapitulated module-specific targeting of CP subdivisions (Fig. 4b and Supplementary Fig. 13). Neurons in the prefrontal module mainly projected to CPvm, those in the lateral module to CPiv, those in the somatomotor module to CPl, those in the medial and visual modules to CPdm and those in the auditory module to CPp.
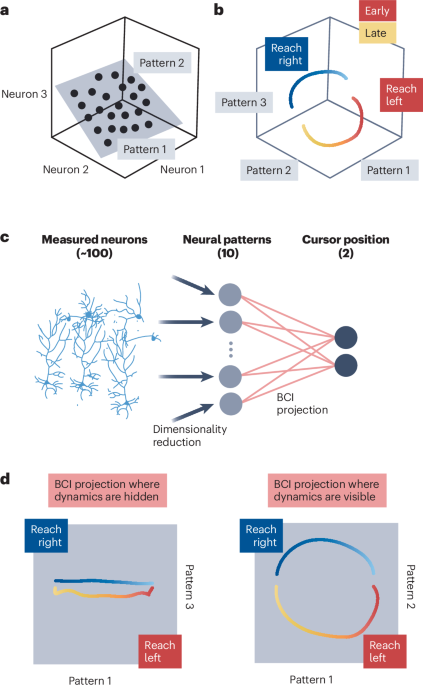
Fig. 4: Cortical cell-type-specific, single-neuron projections in five CP subdivisions. The alternative text for this image may have been generated using AI.
a, Soma locations of fully reconstructed individual neurons that send projections to the CP shown on the flatmap of the right isocortex. White dots represent L2/3 IT, L5 IT, L5 ET, L6 CT and L6b neurons reconstructed in 42 cortical areas and subregions. Laminar distribution of these neurons is shown at the top and right of the flatmap. Thick colored lines indicate the borders of six cortical modules and thin white lines indicate the borders of cortical areas. b, Matrices showing that L2/3 and L5 neurons in different cortical areas send projections in CP subdivisions with different densities. Contralateral CP projections mirror the ipsilateral ones with fewer axon terminals. c, Matrices showing that L5 IT neurons send stronger projections to bilateral CP than any other cell types, with an ipsilateral predominance. d, Representative examples of four morphological subtypes of L2/3 IT and L5 IT neurons and one type of L5 ET neurons from MOs. L2/3 IT and L5 IT neurons are color coded by morphological subtypes and L5 ET neurons by cell identity. e, Bar graph showing three morphological subtypes (ipsilateral, contralateral and bilateral CP-projecting neurons) of L2/3 IT, L5 IT and L6 IT with different proportions in the cortical areas. f,g, Total axon arbor lengths in the ipsilateral CP versus numbers of axon terminals from individual cortical neurons. Axon arbor lengths are slightly larger in the somatomotor module than in the medial module across cortical modules (f) and larger for L5 IT neurons than L5 ET neurons (g). D, dorsal; M, medial.
On average, L5 IT neurons sent stronger projections to the CP than any other cell types across cortical areas, although some cortical areas, such as SSp-m, SSs, VISam and VISl, don’t have enough reconstructed neurons to draw solid conclusions (Fig. 4c). Based on projection targets and strengths, IT neurons (L2/3, L5 and L6) could be further classified into three or four morphological subtypes (ipsilateral, contralateral, bilateral with ipsilateral or contralateral bias). Representative examples showed projections in the CP from these subtypes of L2/3 IT and L5 IT neurons as well as L5 ET neurons of MOs (Fig. 4d). IT morphological subtypes projected to CP in different proportions for each layer and each cortical area, with apparently many more ipsilateral-projecting and bilateral-projecting L2/3 IT and L5 IT neurons than contralateral-projecting ones (Fig. 4e). Axon arbor lengths of individual neurons within the CP varied in each of the cortical areas, but in a similar range across cortical modules when all cell types were pooled together (Fig. 4f). Axon arbor lengths within the CP were larger from L5 IT neurons than from L5 ET neurons (Fig. 4g).
We showed representative examples of convergent inputs within the territory of CPdm from L2/3 IT, L5 ET, L5 IT and L6 IT neurons of ACAv (Extended Data Fig. 9a). Analysis of overlaps among single-neuron axon terminal fields revealed substantial convergent inputs within module-matched CP subdivisions, particularly from L5 IT neurons, whereas the partial overlaps declined with soma separation distance (Extended Data Fig. 9b). L5 ET neurons had lower overlaps in the corresponding CP subdivisions. L5 IT neurons from the same cortical module showed greater overlaps than those from different modules, although cross-module convergence was observed in specific cortical areas, for example, between ACA and VIS (Extended Data Fig. 9c).
We showed representative examples of partially overlapping axon terminal fields in corresponding CP subdivisions from individual L5 IT and L5 ET neurons of ACAv and L5 IT neurons of MOs (Extended Data Fig. 9d). By calculating corticocortical and corticostriatal projections of single neurons from the prefrontal cortical areas PL, ILA and ORBl, we found stronger corticocortical connections within the same module than cross-modules (Extended Data Fig. 9e, left three panels). These cortical areas of the prefrontal module sent stronger convergent inputs to CPvm than to other CP subdivisions. They also sent strong inputs to other selective CP subdivisions, with PL and ILA projecting strongly to CPdm whereas ORBl projected strongly to CPl (Extended Data Fig. 9e, right three panels). This reflects a unique intermodule convergent input characteristic.
L5 ET neurons provided direct, module-specific projections to smaller basal ganglia nuclei, including GPe, GPi, STN and SNr, and they were classified into 9–15 morphological subtypes based on projection targets (Supplementary Fig. 14a,b). L5 ET neurons from different cortical modules sent topographic projections to subdivisions of these nuclei (Supplementary Fig. 14c–f). L5 ET neurons in ACA and PL sent projections to GPe-m, GPi-sh, STNpv and SNr-dm or SNr-vm, those in SS and MO sent projections to GPe-l, GPi-co, STNad and SNr-c and those in Ald and Alv sent projections to SNr-dl. Representative examples showed such topographic projections in subdivisions of these nuclei from L5 ET neurons of MOs and ACAd (Extended Data Fig. 9f). Representative examples of axon arbors in these nuclei from L5 ET neurons of different cortical modules are show
Comments (0)